

 PDF
PDF ePub
ePub Citation
 Print
Print


Cerebral ischemia is associated with high mortality and severe disability [1]. The risk of cerebral ischemia is higher under hyperglycemic conditions than normal conditions [2]. Hyperglycemia exacerbates brain damage from acute cerebral ischemia and worsens the outcome of stroke [3]. Hyperglycemia increases blood-brain barrier permeability and vascular inflammation, and impairs cellular metabolism during cerebral ischemia [456]. Moreover, good control of blood glucose levels decreases mortality after ischemic stroke and improves the outcome of cerebral ischemia [7]. Ischemic injury, including cerebral ischemia, leads to increases in intracellular calcium, reactive oxygen species (ROS) generation, mitochondrial dysfunction, and the inflammatory response [89]. Ultimately, cerebral ischemic conditions cause neuronal dysfunction and neuronal cell damage.
Dynamin-like protein 1 (DLP-1) is a GTPase that controls mitochondrial fission and fusion. DLP-1 is a member of the dynamin superfamily of proteins, and is abundantly localized in synapses [10]. Mitochondria maintain a dynamic reticular network by fission and fusion events. An imbalance between mitochondrial fission and fusion can cause mitochondrial dysfunction and structural impairment. Mitochondria are involved in various cellular functions, including supplying cellular energy, controlling the cell cycle, and playing a role in cell signaling, differentiation, and death [11]. Thus, dysfunction of mitochondria in neurons can cause the disruption of energy generation and can lead to neuronal damage [121314]. Moreover, the expression of DLP-1 is associated with synaptic formation in hippocampal neurons [15]. Deficient synaptic formation and mitochondrial aggregation in DLP-1 knockout mice has been shown to lead to developmental abnormalities in the forebrain [151617]. These data support that DLP-1 is an essential protein for synaptic formation and mitochondrial functioning in neurons. We previously demonstrated that cerebral ischemic injury decreases DLP-1 expression [18]. Although several studies have demonstrated that hyperglycemic conditions exacerbate brain damage during cerebral ischemia, little is known about DLP-1 expression in ischemic brains in the context of diabetes. Thus, the aim of this study was to investigate whether hyperglycemic conditions affect DLP-1 expression following focal cerebral ischemia.
Materials and Methods
Experimental animals
Male Sprague-Dawley rats (200-220 g, n=60) were purchased from Samtako Co. (Animal Breeding Center, Osan, Korea), maintained under controlled temperature (25℃) and lighting (12/12-h light/dark cycle), and were allowed free access to food. All experiments were carried out in accordance with guidelines approved by the ethics committee concerning animal research at Gyeongsang National University (GNU-141222-R0064). Rats were randomly divided into four groups: non-diabetic+sham, diabetic+sham, non-diabetic+MCAO, and diabetic+MCAO. Diabetic conditions were induced by intraperitoneal injection of streptozotocin (40 mg/kg, Sigma, St. Louis, MO, USA). Streptozotocin was dissolved in 10 mM citrate buffer (pH 4.6) and non-diabetic animals received only citrate buffer as the vehicle. Blood glucose levels were determined using a strip sensor (Accu-Chek-Roche Diagnostics, Mannheim, Germany) according to the manufacturer protocol. A fasting blood glucose of >300 mg/dL was considered diabetic. Body weight and blood glucose were measured before MCAO.
Middle cerebral artery occlusion
MCAO was conducted via an intraluminal procedure, as previously described, after 4 weeks of streptozotocin treatment [19]. Zoletil (50 mg/kg; Virbac, Carros, France) was used for anesthesia before MCAO. Briefly, the right common carotid artery, external carotid artery, and internal carotid artery were exposed through a midline cervical incision. The occipital and superior thyroid arteries were knotted with 6/0 black silk thread and subsequently cut. The external carotid artery was knotted with black silk thread, and a 4/0 monofilament nylon needle with a blunted round tip about 30 mm in length was inserted from the external carotid artery into the internal carotid artery until the tip blocked the origin of the middle cerebral artery. Sham-operated animals were subjected to the same procedures except for the insertion of the filament. Rats were decapitated 24 hours after the onset of permanent occlusion, and brain tissue was carefully excised. The infarction volume was determined by 2,3,5-triphenyltetrazolium chloride (TTC; Sigma) staining. Brain tissues were cut into 2-mm coronal sections using a brain matrix (Zivic Instruments, Pittsburgh, PA, USA). Brain sections were immersed in a 1% TTC solution in phosphate-buffered saline (PBS) for 20 min at 37℃, and then fixed in a 10% formalin solution [20]. The size of the infarct area was measured by Image-ProPlus 4.0 software (Media Cybernetics, Silver Spring, MD, USA). The volume of infarct lesions was calculated as the infarction area divided by the total section area, and reported as a percentage.
Two-dimensional gel electrophoresis
Our proteomics study was performed according to a previously described method [18]. The right cerebral cortices were excised according to experimental groups and homogenized in buffer solution (8 M urea, 4% CHAPS, ampholytes, and 40 mM Tris-HCl). After homogenization, the homogenates were centrifuged at 16,000 g for 20 min at 4℃ and the supernatant was removed. The pellets were dissolved in lysis buffer and the total protein concentration was determined via the Bradford method (Bio-Rad, Hercules, CA, USA) according to the manufacturer's protocol. Immobilized pH gradient (IPG) gel strips (pH range 4–7 and pH 6–9; 17 cm; Bio-Rad) were incubated in rehydration buffer (8 M urea, 2% CHAPS, 20 mM DTT, 0.5% IPG buffer, and bromophenol blue) for 13 hrs at room temperature. The assayed protein samples were loaded on IPG strips using the provided sample cups, and subjected to first-dimension isoelectric focusing (IEF) using the Ettan IPGphor 3 system (GE Healthcare, Uppsala, Sweden) with the following protocol: 250 V (15 min), 10,000 V (3 hours), and then 10,000-50,000 V. After first-dimension separation, the strips were incubated in equilibration buffer (6M urea, 30% glycerol, 2% sodium dodecyl sulfate (SDS), 50 mM Tris-HCl, and bromophenol blue) containing DTT and iodoacetamide. The strips were then loaded onto gradient gels (7.5–17.5%) and second-dimension electrophoresis was performed on Protean-II XI electrophoresis equipment (Bio-Rad) at 5 mA per gel for 2 hours followed by 10 mA per gel at 10℃ until the bromophenol blue dye migrated off the bottom of the gel.
Silver staining, image analysis and protein identification
For silver staining, the gels were first immersed in fixation solution (12% acetic acid, 50% methanol) for 2 hour, washed with 50% ethyl alcohol, and treated with 0.2% sodium thiosulfate. The gels were then washed with deionized water, followed by impregnation in a silver solution (0.2% silver nitrate), and were developed in a 0.2% sodium carbonate solution. The gel images were collected using Agfa Arcus 1200™ (Agfar-Gevaert, Mortsel, Belgium). The PDQuest 2-D analysis software (Bio-Rad) was used to analyze protein spots on gels after silver staining. Differentially expressed protein spots were determined based on the results of the PDQuest software. The protein spots were then excised and distained. The gel particles were digested in a trypsin-containing buffer. The extracted peptides were analyzed using a Voyager-DETM STR biospectrometry workstation (Applied Biosystem, Forster City, CA, USA) for peptide mass fingerprinting. Database searches were carried out using the MS-Fit and ProFound programs. SWISS-PROT and NCBI were used as the protein sequence databases.
Reverse transcription-PCR amplification
The right cerebral cortices were isolated under sterile conditions, immediately frozen in liquid nitrogen, and stored at −70℃. The TRIzol Reagent Kit (Life Technologies, Rockville, MD, USA) was used for extraction of total RNA according to the manufacturer's instructions. Total RNA (1 µg) was reverse-transcribed into complementary DNA with a SuperScript III First-Strand Synthesis System (Invitrogen, Carlsbad, CA, USA) following the manufacturer's instructions. The reverse transcription step was carried out at 42℃ for 30 min, the inactivation of reverse transcriptase at 95℃ for 5 min, followed by cooling down of the samples at 4℃ for 5 min. The primer sequences of DLP-1 were: 5'-TCACCAAAGAT GGTGCTCCCGGAT-3' (forward primer), 5'-AATTAC AGTACACAGGAA-3' (reverse primer). The primer sequences of actin were: 5'-GGGTCAGAAGGACTCC TACG-3' (forward primer), and 5'-GGTCTCAAACATG ATCTGGG-3' (reverse primer). The reverse-transcribed cDNA was used as a template for PCR amplification. The reaction conditions for PCR were as follows: an initial step of 94℃ for 5 min; 94℃ for 30 sec, 54℃ for 30 sec, and 72℃ for 1 min, repeated for 30 cycles; and a final extension at 72℃ for 10 min. The PCR products were loaded on 1% agarose gels, and the PCR product bands were visualized under ultraviolet light.
Western blot analysis
Western blot analysis was performed as previously described [18]. Briefly, the right cerebral cortices were dissolved and homogenized in lysis buffer (1 M Tris-HCI, 5M sodium chloride, 0.5% sodium deoxycholate, 10% sodium dodecyl sulfate, 1% sodium azide, and 10% NP-40) containing 200 µM phenylmethylsulfonyl fluoride as a protein inhibitor. After sonication, homogenates were separated by centrifugation at 15,000 g for 20 min at 4℃, and the supernatants were harvested for further process. A bicinchoninic acid kit (Pierce, Rockford, IL, USA) was used for the measurement of protein concentration according to the manufacturer's protocols. An equal amount of total protein (30 µg) from each sample was mixed with the loading buffer, boiled for 5 min, cooled down, and loaded onto a 10% SDS-polyacrylamide gel, where electrophoresis was carried out. The proteins were then transferred to polyvinylidene fluoride membranes (Millipore, Billerica, MA, USA). The membranes were incubated with 5% non-fat dry milk for 1 hour at room temperature to minimize non-specific antibody binding, washed in Tris-buffered saline containing 0.1% Tween-20 (TBST), and then incubated with either an anti-DLP-1 antibody (diluted 1:1,000; BD Biosciences, San Jose, CA, USA) or an anti-β-actin (diluted 1:1,000; Santa Cruz Biotechnology, Santa Cruz, CA, USA) overnight at 4oC. After washing in TBST, the membranes were reacted with horseradish perxoxidase-conjugated goat anti-rabbit IgG (1:5,000; Pierce). The enhanced chemiluminescence Western blot analysis system (Amersham Pharmacia Biotech, Piscataway, NJ, USA) was used according to the manufacturer's manual for the detection of immunoreactive bands.
Data analysis
The experimental data are expressed as mean±SEM. The intensity analysis was carried out using the SigmaGel 1.0 (Jandel Scientific, San Rafael, CA, USA) and SigmaPlot 4.0 (SPSS Inc., Point Richmond, CA, USA) programs. The relative expression levels of each group were normalized to that of the non-diabetic+sham group. The differences among various experimental groups were analyzed via two-way analysis of variance followed by post-hoc Scheffe's test. A P value of <0.05 was considered statistically significant.
Results
We monitored the increase in blood glucose levels and corresponding decrease in body weight in animals that with streptozotocin-induced diabetes. Blood glucose levels were 102.5±2.5 mg/dL in non-diabetic animals and 343.7±24.8 mg/dL in diabetic animals. The mean body weight was 327.2±22.5 g in non-diabetic animals and 203.6±17.8 g in diabetic animals. We examined the infarct volume following MCAO in animals with hyperglycemia and those without. Hyperglycemic animals exhibited more serious damage and an increased infarct volume following MCAO compared to non-diabetic animals. The average size of infarct was 28.25±3.35% and 35.75±3.35% of the total section size in non-diabetic+MCAO animals and diabetic+MCAO animals, respectively (Supplementary data).
The results of the proteomic analysis showed decreases in levels of DLP-1 in the cerebral cortex of MCAO animals when compared with control animals. We also found a more severe decrease in levels of DLP-1 in MCAO animals with hyperglycemia compared to MCAO animals without hyperglycemia. The peptide mass and sequence of DLP-1 were 14/90 and 21%, respectively. However, DLP-1 expression was similar between sham operated animals with hyperglycemia and sham operated animals without hyperglycemia. DLP-1 expression levels are reported as a ratio relative to that of non-diabetic+sham animal. DLP-1 expression levels were 0.67±0.04 in non-diabetic+MCAO animals and 0.53±0.03 in diabetic+MCAO animals, respectively (Figure 1). Reverse-transcription PCR and Western blot analyses also demonstrated a severe decrease in DLP-1 expression in diabetic+MCAO animals when compared with controls. Transcript levels of DLP-1 were 0.78±0.03 and 0.15±0.02 in non-diabetic+MCAO animals and diabetic+MCAO animals, respectively (Figure 2). Moreover, DLP-1 protein levels were 0.69±0.03 and 0.43±0.04 in non-diabetic+MCAO animals and diabetic+MCAO animals, respectively (Figure 3).
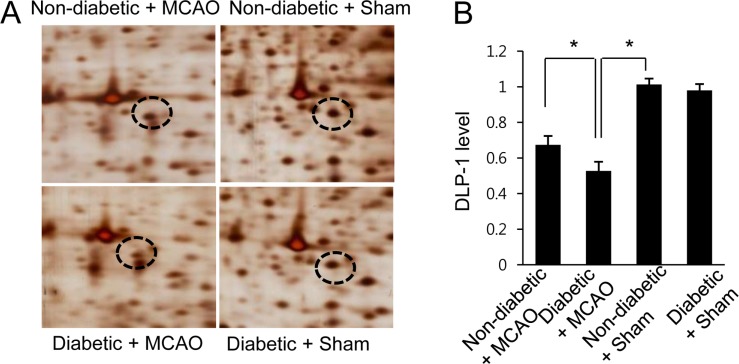
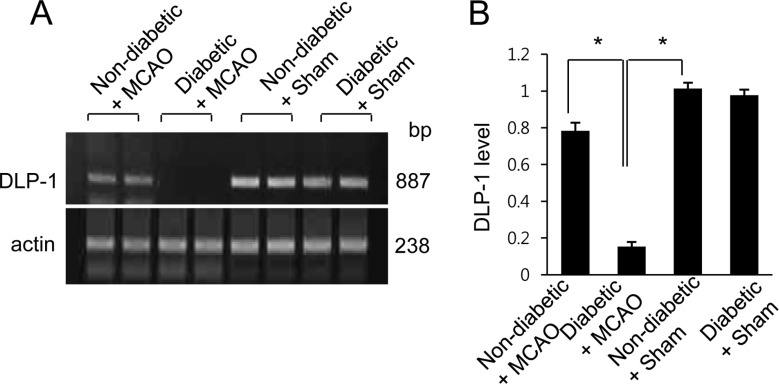
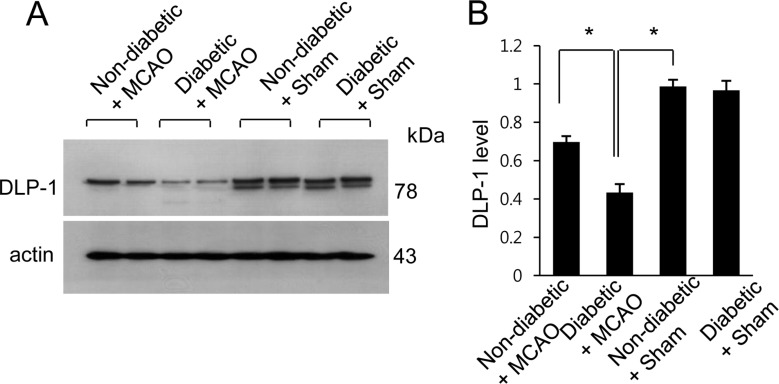
Figure 1
Two-dimensional SDS-PAGE analysis of dynamin-like protein 1 (DLP-1) in the cerebral cortex of non-diabetic+sham animals, diabetic+sham animals, non-diabetic+middle cerebral artery occlusion (MCAO) animals, and diabetic+MCAO animals. Circles indicate DLP-1 protein spots. The intensity of spots was measured using PDQuest software. The spot intensities are reported as a ratio relative to normal+sham control animals. Data are shown as mean±SEM. *P<0.05. (vs. non-diabetic+sham).
![]()
Figure 2
Reverse transcription PCR of DLP-1 in the cerebral cortex using RNA isolated from non-diabetic+sham animals, diabetic+sham animals, non-diabetic+MCAO animals, and diabetic+MCAO animals. The densitometric analysis is presented as the ratio of DLP-1 intensity to actin intensity. Data (n=5) are presented as mean±SEM. *P<0.05.
![]()
Figure 3
Western blot analysis of DLP-1 in the cerebral cortex of non-diabetic+sham animals, diabetic+sham animals, non-diabetic+MCAO animals, and diabetic+MCAO animals. Densitometric analysis is presented as a ratio of given protein intensities to actin intensities. Molecular weight markers (kDa) are depicted on the left. Data (n=5) are shown as mean±SEM. *P<0.05.
![]()
Discussion
This study confirmed that hyperglycemia leads to more serious brain damage following cerebral ischemic injury compared to a normal, non-hyperglycemic state. Our results are consistent with the results of previous studies [2122]. Moreover, we identified a decrease in DLP-1 protein levels in MCAO-injured animals with hyperglycemia compared to MCAO-injured animals without hyperglycemia. Oxidative stress leads to impaired mitochondrial function and neuropathological changes in diabetic conditions. Although the pathogenesis of diabetes mellitus is complex and not fully understood, hyperglycemia induces oxidative stress, nerve hypoxia and ischemia, and growth factor deficiency [232425]. Moreover, the increased generation of reactive oxygen species in hyperglycemic conditions can change mitochondrial morphology [26].
We recently reported a decrease in DLP-1 protein expression levels in cerebral ischemia following MCAO. Moreover, in an in vitro study, we confirmed the down-regulation of this protein in glutamate-exposed hippocampal neurons. DLP-1 is involved in outer mitochondrial membrane fission, helps maintain mitochondrial morphology, and regulates apoptotic cell death [2728]. Mitochondria are highly dynamic organelles that mediate cellular responses to stress and constantly undergo fission and fusion. Mitochondrial fusion and fission are critical processes for the maintenance of mitochondrial function and morphology. It has been reported previously that DLP-1 mediates the mitochondrial fission process [29]. Thus, it is thought that downregulation of DLP-1 can cause neuronal cell death and dysfunction in focal cerebral ischemia. Here, a proteomics approach identified a severe decrease in DLP-1 expression under hyperglycemic conditions when combined with ischemic brain injury. Moreover, reverse-transcription PCR and Western blot analyses clearly showed more a serious decrease in DLP-1 expression in hyperglycemic animals with cerebral ischemia when compared with non-hyperglycemic animals with cerebral ischemia. Hyperglycemia alone, without brain ischemic injury, did not decrease DLP-1 expression levels. A significant decrease in DLP-1 expression most likely leads to the dysregulation of mitochondrial fission and fusion, and consequently induces neuronal damage and disorder.
Hyperglycemia enhances DNA fragmentation, activates cell death pathways, and causes mitochondrial swelling after transient focal cerebral ischemia [303132]. Oxidative stress is thought to be one cause of neurodegenerative diseases, including cerebral ischemia and Parkinson's disease. Oxidative stress induces the increase of mitochondrial membrane permeability, energy metabolism disorder, and consequently apoptotic cell death [33]. This imbalance in mitochondrial dynamics causes neurodegenerative diseases [2934]. Patients with neurodegenerative diseases often exhibit impaired mitochondrial dynamics, including disturbances in shape, size, fission-fusion processes, and distribution [34]. Hyperglycemia changes mitochondrial fission and fusion proteins in cerebral ischemia and reperfusion [35]. Moreover, DLP-1 depletion leads to serious brain hypoplasia and neuronal cell death in DLP-1 knockout mice [1617]. The maintenance of mitochondrial function is a critical factor in the health of neurons. Decreases in DLP-1 expression lead to mitochondrial dysfunction and finally induce apoptotic cell death. In this study, we confirmed that diabetes leads to heightened brain damage following MCAO injury. Additionally, hyperglycemia induces a more severe reduction of DLP-1 during MCAO injury compared to a non-hyperglycemic condition. The reduction of DLP-1 indicates that there may be underlying neuronal cell damage and disorder. Thus, our findings suggest that the severe decrease in DLP-1 expression in focal cerebral ischemia seen with hyperglycemic conditions exacerbates brain damage when compared to the damage associated with focal cerebral ischemia under non-hyperglycemic conditions.
 XML Download