

 PDF
PDF ePub
ePub Citation
 Print
Print


A proper animal experimental design takes into consideration the species, strain, and sub-strain. Laboratory animals are broadly categorized into inbred, outbred, hybrid, recombinant inbred, and mixed breeds depending on the genetic background. Outbred rodents, such as ICR mice and Sprague Dawley rats, offer a varied genetic background, which is due to the less-rigorous genetic characterization and genetic quality control. Outbreds often lack complete genetic information at the individual level, which may lead to significant undetected genetic variation [123]. However, outbreds have been widely used in animal experimentation and have many advantages. Rodents have been selected to develop various models of human disease [4]. ICR mice as an outbred stock were first established by Hauschka at the Institute for Cancer Research after the introduction of Swiss mice into the United States from Lausanne in Switzerland [5]. ICR mice are also widely used in safety and efficacy testing, cancer research, aging studies, transgenic experiments, and gene mapping strategies [67].
Animal models have played a critical role in studies on disease pathophysiology and in the evaluation of therapeutics and treatments in vivo [7]. Diabetes mellitus is one of the most devastating chronic diseases; it is a metabolic disease mainly characterized by chronic hyperglycemia, a condition related to abnormal insulin secretion by pancreatic β cells, which results from either insulin resistance or impairment of insulin secretion [89]. Diabetes mellitus results in neuropathy, nephropathy, retinopathy, and cardiovascular disease [10].
Streptozotocin (STZ), a glucosamine-nitrosourea compound derived from Streptomyces achromogenes, is a broad-spectrum antibiotic with unique toxic selectivity for the β cells in the pancreatic islets of Langerhans. STZ is employed as a cytotoxic glucose analogue that tends to accumulate in pancreatic β cells through the action of glucose transporter2 [11]. STZ damages pancreatic β cells, resulting in hypoinsulinemia and hyperglycemia.
ICR mice are commonly used for various studies, and several mouse strains, including ICR mice, C57BL/6 mice, and BALB/c mice, have been utilized to conduct many experiments in studies on diabetes mellitus [121314]. Although C57BL/6 mice are known to be more susceptible to multiple low-dose streptozotocin (MLDS)-induced diabetes [15], the most suitable animal species and strain to produce animal models of diabetes mellitus to evaluate the anti-diabetic activity of different treatments has not been determined. Furthermore, no study has performed a comparative analysis of the responses of specific mice obtained from different sources to chemicals that cause diabetes mellitus. Therefore, the present study was conducted to compare the responses of ICR mice (Korl:ICR, A:ICR, and B:ICR) obtained from three difference sources to STZ-induced diabetes mellitus.
Materials and Methods
Animal experiment
Six-week-old male ICR mice were obtained from three difference sources. Korl:ICR mice were kindly provided by the Department of Laboratory Animal Resources in the National Institute of Food and Drug Safety Evaluation (NIFDS, Cheongju, Korea). The other two ICR groups of ICR mice were purchased from different vendors located in the United States (A:ICR) and Japan (B:ICR). All mice were given ad libitum access to a standard irradiated chow diet (Purina, Seoul, Korea) and sterilized water. During the experiment, mice were maintained in a specific pathogen-free state under a strict light cycle (lights on at 07:00 and off at 19:00) at 22±2℃ and 50±10% relative humidity. The mice were housed in the Kyungpook National University-Laboratory Animal Resources Center. All animal experiments were performed in accordance with the Guidelines for Animal Care and Use of Kyungpook National University.
The multiple low-dose streptozotocin (MLDS) diabetic mouse model
The Korl:ICR, A:ICR, and B:ICR mouse (six-weeks-old, n=42) groups were each divided into two groups (normal control group and MLDS-induced diabetic group, n=7 mice each). After an initial acclimation period (7 days), male ICR mice were given STZ (40 mg/kg i.p., dissolved in ice-cold 0.025 M sodium citrate-buffered solution, pH 4.5, freshly made right before injection) in 50 mM Na-citrate buffer, pH 4.5, for 5 consecutive days to induce chemical injury to the islet cells. Fasting blood glucose levels were measured 3 days after the final STZ treatment. Mice with a blood glucose concentration above 250 mg/dL were considered diabetic. Seven age-matched mice were intraperitoneally injected with the buffer solution as a control. For the next 8 weeks, body weight and 4 h fasting blood glucose levels were measured using an electronic balance (Mettler Toledo, Greifensee, Switzerland) and a glucometer (Super Glucocard II, Arkray Inc., Kyoto, Japan), respectively, once a week.
Oral glucose tolerance test
At the end of the 8-week observation, the oral glucose tolerance test (OGTT) was performed. All mice were fasted for 4 h before the OGTT. At 0 min, a drop of blood (5 µL) was taken via a tail nick before giving the oral glucose load. Mice were then given a glucose load (2 g/kg) in distilled water. Blood samples (40 µL) were obtained at 30, 60, 90, and 120 min after the glucose load for the determination of blood glucose with a glucometer. Plasma insulin levels were assayed using an enzyme-linked immunosorbent assay kit (Mercodia, Switzerland).
Serum biochemical measurements
Serum levels of aspartate aminotransferase (AST), alanine aminotransferase (ALT), alkaline phosphatase (ALP), creatinine (CRE), urea (URE), total protein (TP), and total cholesterol (TC), triglyceride (TG) were measured using commercial kits (Asan Pharmaceutical Co., Seoul, Korea) with an automatic chemistry analyzer (Hitachi 7180; Hitachi, Tokyo, Japan).
Histological examination
Animals were euthanized by CO2 inhalation, and the pancreas was removed, fixed with 4% paraformaldehyde, and embedded in paraffin. Paraffin block samples were cut into 5-µm sections and stained with hematoxylin and eosin (H&E) and anti-insulin antibody for histological observation.
Statistical analysis
The data are presented as the mean±standard deviation (SD). Statistical analysis was performed using SAS version 9.1 (SAS Institute Inc., Cary, NC, USA). Student's t-test was used for comparisons between the control and sample groups. A P value<0.05 was considered significant throughout the study.
Results
Body weight
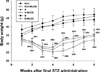
The body weight changes in the experimental groups are shown in Figure 1. The body weights of the mice in the normal groups of Korl:ICR, A:ICR, and B:ICR mice were similar at the beginning of the experiments (Figure 1). The three groups of normal ICR mice gained weight steadily at the same rate throughout the experimental period. Body weight increased in the order of the Korl:ICR, A:ICR, and B:ICR groups compared to the normal control group, and the body weight changes were similar. After 8 weeks, the Korl:ICR mice were about 7% heavier than the B:ICR mice. MLDS caused rapid and significant decreases in body weight. These results show that the MLDS treatment to induce diabetes mellitus did not result in significant differences in the body weight parameter among the three ICR groups.
Blood glucose levels
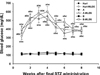
The blood glucose levels were measured once a week for 8 weeks (Figure 2). From 1 week to 8 weeks after the final STZ treatment, the blood glucose levels of the MLDS-induced mice were significantly (P<0.05) higher than those of the normal mice in all ICR mouse groups. The blood glucose levels were the highest 3-4 weeks after the final STZ treatment. Similar fluctuations in the blood glucose levels were observed in the Korl:ICR, A:ICR, and B:ICR mice. Therefore, the present results indicate that the Korl:ICR, A:ICR, and B:ICR mice showed similar blood glucose level patterns following MLDS treatment.
Plasma insulin levels
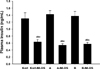
Plasma insulin levels were measured 8 weeks after the final STZ administration (Figure 3). Compared to the control group, the MLDS-induced diabetic mice in the Korl:ICR, A:ICR, and B:ICR mouse groups exhibited significant decreases in their plasma insulin levels (P<0.05).
Oral glucose tolerance test
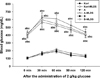
To further evaluate the MLDS-induced diabetes, oral glucose tolerance tests were conducted. The zero-time fasting blood glucose levels did not differ among the experimental groups. However, after glucose administration, the response to glucose loading in the normal control and MLDS-induced diabetic groups differed (Figure 4). In the normal control groups, the highest blood glucose level was observed 60 min after glucose administration, and the blood glucose level was near the normal value after 120 min. In the diabetic group, the highest blood glucose level was 600 mg/dL 30 min after glucose administration and returned to the initial level after 120 min.
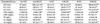
Serum biochemistry
Changes in the levels of serum enzymes and substances are presented in Table 1. All diabetic ICR mice treated with MLDS exhibited liver damage and kidney damage. The serum levels of AST, ALT, ALP, CRE, TC, and TG in the MLDS-induced diabetes groups increased significantly compared to those in the normal control group (P<0.05). On the other hand, serum TP levels were lower in the MLDS-induced diabetes groups than in the normal control group. However, the differences were not significant.
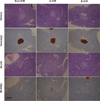
Histological changes in and insulin immunohistochemical evaluation of the pancreas
At the histological level, the Langerhans' islets of the pancreas exhibited a normal circular morphology with a regular cell lining in the normal mice (Figure 5). The exocrine acini portion of the islets was well organized and had a normal morphology. In the MLDS-induced diabetic group, extensive cell atrophy, vacuolization of islets, and invasion of connective tissues in the parenchyma of pancreatic islets were detected. Immunohistochemistry showed insulin positivity in the pancreatic islets of the normal control mice. The numbers of immunoreactive insulin-producing β-cells in MLDS-induced diabetic mice were markedly lower in restricted pancreatic islets compared to the normal controls. Overall, the above results indicate that diabetes mellitus was successfully induced by MLDS treatment in ICR mice from three different sources.
Discussion
Animal models of diabetes mellitus have been widely employed to evaluate therapeutic drugs and investigate the disease mechanisms. ICR mice, a type of outbred rodent, have been frequently applied to produce animal models of diabetes mellitus, but comparative studies of outbred animals obtained from different sources have not been conducted. STZ has been used in the clinical oncology field for the treatment of insulinomas and pancreatic β cell carcinoma [161718], and it has been used in diabetes research as a tool to induce hyperglycemia in laboratory animals [151920]. STZ causes the dysfunction of islet β-cells, including the induction of pancreatic cell apoptosis and inhibition of insulin gene expression and insulin synthesis [2122].
This study investigated the outcome of MLDS-induced diabetes in Korl:ICR, A:ICR, and B:ICR mice obtained from three different sources. Diabetes mellitus was successfully induced by various combinations of STZ concentrations in ICR mice [1314]. The onset of diabetes (as determined by glucose levels) in all ICR mice occurred within the first week following MLDS induction. Weight loss is a major characteristic of diabetes mellitus, and it may result from protein wasting [23]. All ICR mice became hyperglycemic 1 week after the final MLDS treatment (Figure 2). The onset of diabetes after MLDS treatment in the Korl:ICR mice occurred slightly faster than in the B:ICR and C:ICR mice. The Korl:ICR, A:ICR, and B:ICR mice began to recover from the hyperglycemia by 4 weeks after MLDS induction. This study showed that MLDS treatment caused significant elevations in blood glucose levels in the Korl:ICR, A:ICR, and B:ICR mice, independent of the genetic background in the same outbred mice. Insulin promotes peripheral glucose utilization, inhibits glucagon secretion, and enhances glycogenesis. However, diabetes mellitus impairs the normal function of islets of secreting sufficient amounts of insulin [9]. In this study, all diabetic ICR mice treated with MLDS exhibited a significant decrease in serum insulin levels compared with those in the normal mice. MLDS treatment resulted in diabetes mellitus, as indicated the levels of fasting blood glucose and serum insulin. Similar results were also reported in other studies [112425]. In the oral glucose tolerance test, all diabetic ICR mice treated with MLDS exhibited significant glucose intolerance compared with the normal mice. As expected, the MLDS treatment significantly increased the levels of serum AST, ALT, ALP, CRE, URE, TC, and TG and decreased levels of TP in all ICR mice compared with the normal control groups. Elevations in serum biomarker enzymes such as AST, ALT, ALP, CRE, URE, TC, and TG were observed in diabetic mice, indicating the deterioration of liver function (Table 1), possibly because STZ induced liver damage that caused the leakage of these enzymes into the blood [26]. In particular, the leakage of hepatic enzymes such as ALT and AST into the blood stream is directly associated with marked liver injury [27]. STZ-induced hepatic toxic events may occur in response to an excess of free fatty acids resulting from insulin impairment in diabetes mellitus [28]. High serum cholesterol and triglyceride levels are associated with diabetes mellitus [29]. The results of the present study indicated increased serum lipid concentrations in MLDS-induced diabetic mice. Based on these results, Korl:ICR mice are expected to be used with the more common A:ICR and B:ICR mice for assessments of liver function and diabetes induction and diabetes screening. The histological structure of the pancreas was assessed in Korl:ICR, A:ICR, and B:ICR mice treated with MLDS. ICR mice from three different sources showed similar histopathological results. In the MLDS-induced diabetic group, extensive cell atrophy, vacuolization of islets, and invasion of connective tissues in the parenchyma of pancreatic islets were detected. Therefore, these results suggested that the histopathological characteristics of diabetes mellitus were successfully induced by MLDS treatment in ICR mice from three different sources without significant differences. No other toxicity changes in other organs following administration of MLDS was observed in the three different ICR mice. We investigated the diabetes mellitus-related responses of ICR mice from different sources to MLDS treatment. In this study, MLDS induced hyperglycemia, hypoinsulinemia, glucose intolerance, β cell dysfunction, and β cell loss to equal degrees in Korl:ICR, A:ICR, and B:ICR mice. The MLDS-induced diabetic ICR mice exhibited typical characteristics, including body weight loss, hyperglycemia, hypoinsulinemia, glucose intolerance, hepatic injury, moderate lipid abnormalities, and islet degeneration. Overall, the results of this study suggest that the Korl:ICR, A:ICR, and B:ICR mice from different sources had similar overall responses to diabetes mellitus induced by MLDS treatment. Therefore, our results suggest that Korl:ICR mice can be used similar to other ICR mice provided by commercial vendors to produce animal models of diabetes mellitus.
 XML Download