

 PDF
PDF ePub
ePub Citation
 Print
Print


INTRODUCTION
Animal models used in biomedical research and clinical applications have proved to be indispensable tools and/or resources. Since the early days of human anatomical and physiological discovery, laboratory animals have been widely used to better understand human physiology, genetics, and pathology. Today, they are also used to investigate the effectiveness and toxicity of diverse medicines and chemicals, as well as the mechanisms underlying these attributes [1].
Rodent models such as rats and mice are especially popular (they make up about 95% of animals used in research) because of several benefits: their ability to be easily reared under laboratory conditions, the proximity of their genome and physiology to that of humans, their short lifespan, and their pliability for genetic manipulation [23]. Thus, it is necessary to establish the fundamental properties of these models with regard to genetics, biology, and physiology in order to minimize spurious interpretations and ensure a level of accuracy and reliability adequate for experimental research.
The resting metabolic rate (RMR) is defined as the minimal rate of energy expenditure at resting conditions and serves as an approximation of the metabolic phenotype. It is determined by physiological energy-consuming functions, including thermoregulation, respiration, muscle contraction, blood circulation, and nerve function. Thus, RMR is an important physiological homeostasis and biological equilibrium-related factor in the clinical context of human and animal research [456]. In fact, although estimating the RMR is impeded by various difficulties, the time-dependent estimation of RMR is generally used to obtain reliable data by measuring indirect variables such as oxygen consumption and carbon dioxide production through specialized open-circuit respirometers [78].
Among the rodent strains supplied by major providers, C57BL/6 and ICR mice are commonly used for research in aging, toxicology, pathology, and physiology [3910]. Several studies indicated that RMR differs depending on the strain, gender, weight gain, growth rate, and other conditions derived from genetic and circumstantial variables [2711]. Other studies approached the RMR-related analysis from the perspective of feeding, activity, and chemical substance administration, examining the effects of these variables within a strain as well as between strains [111213]. Recently, studies on Korl mice (a domestic mouse strain) reported that they show similar responses to chemical substances [914]. However, no scientific studies have analyzed the metabolic phenotypes of mice substrains derived from three different origins, especially in C57BL/6Korl and Korl:ICR mice.
In the present study, we compared the physiological features and metabolic phenotypes during the maturation phase of C57BL/6 mice (C57BL/6Korl, A:C57BL/6, B:C57BL/6) and ICR mice (Korl:ICR, A:ICR, B:ICR) substrains obtained from three different sources. Our results constitute the first scientific evidence that the physiological features and metabolic phenotypes of C57BL/6Korl and Korl:ICR mice are largely similar to the ones of other commercially available mice.
Materials and Methods
Animals
C57BL/6 and ICR mice were obtained from three different sources. C57BL/6Korl mice (n=5) and Korl:ICR mice (n=5) were kindly provided by the Department of Laboratory Animal Resources in the National Institute of Food and Drug Safety Evaluation (NIFDS, Cheongju, Korea). The other two subgroups of C57BL/6 and ICR mice were purchased from different vendors located in the United States [A:C57BL/6 (n=5) and A:ICR (n=5)] and Japan [B:C57BL/6 (n=5) and B:ICR (n=5)]. All mice were acclimatized to pathogen-free laboratory conditions (12:12 h dark-light cycle, 23±2℃, 50% relative humidity) for 2 weeks at the laboratory animal facility of Konkuk University. Food (5L69, Orient Bio Inc, Korea) and water were provided ad libitum, according to the schedule for laboratory animals. Body weight and body temperature were measured weekly for 8 weeks, while food intake and water consumption were obtained from the total provided amounts by subtracting remaining food and water, which were measured twice a week at the same time of day. Metabolic phenotype parameters were measured twice during the mouse maturation phase (at 8 weeks of age). All experimental procedures were approved by the Institutional Animal Care and Use Committee of Konkuk University (KU16094-1).
Extraction of Adipose tissue
Upon experiment completion, animals were fasted for 12 hours and then anesthetized by inhaling CO2 gas in a chamber. White adipose tissues (WAT; retroperitoneal adipose tissue and epididymal adipose tissue) were extracted at 8 and 16 weeks of age. After measuring their wet weight using a laboratory scale (Mettler Toledo, ML204, Switzerland), samples for the measurement of mass and histological analysis were thoroughly washed with phosphate-buffered saline (PBS) and fixed in 10% neutral buffered formalin (NBF), followed by storage at 4℃ until use.
Histological analysis
For the morphological comparative analysis of the extracted adipose tissues, hematoxylin & eosin (H&E) staining was used. Adipose tissue samples fixed in 10% formalin solution were embedded in paraffin wax using the routine process and then sectioned into 4-µm-thick slices with a microtome. Slices were placed on microscope slides where they were stained with a hematoxylin and eosin solution (Dako, Glostrup, Denmark) and then observed under a light microscope (DM 2500, Leica Microsystems, Wetzlar, Germany). Morphological analysis of adipose tissues was conducted using an image analyzer program (Image J 1.6.0_24, NIH). The average adipocyte size across the tissue depot was estimated by counting over 100 adipocytes per animal at 200× magnification as previously described [15]. Results were expressed as mean±SEM.
Measurement of metabolic phenotypes
The resting metabolic rate (RMR), which serves as an approximation of the metabolic phenotype, was measured at 8 and 16 weeks of age. Measurements were performed for 24 hours as previously described [16] in a metabolic chamber with an open-circuit system (WSMR-1400, Westron, Japan). In order to reduce stress, the mice were transferred to the chamber two hours before measurement initiation. The flow rate within the chamber was set at 1.2 L/min, with one of the chambers used to measure the contained air for calibration purposes. A mass spectrometry-based gas analyzer (RL-600, Alco System, Japan) equipped with a switching system (ANI6-A-S, Alco System, Japan) was used to measure O2 uptake, CO2 production, and the respiratory exchange rate (RER). The rates of carbohydrate (CHO) oxidation and fat oxidation were calculated with the following formulas [1718]:
Statistical analysis
Data were analyzed using SPSS v18.0 (SPSS, Chicago, IL, USA). All values were expressed as mean±SD. The statistical significance of differences among mice subgroups was determined using independent t-tests and one-way analysis of variance (ANOVA). The Bonferroni post hoc test was used for all pair-wise multiple comparisons when a statistically significant group main effect was found. Statistical significance was set at P<0.05.
Results
Body weight, body temperature, food intake, and water consumption
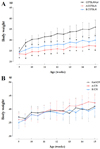
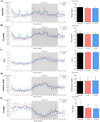
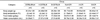
To compare the overall physiology among C57BL/6 and ICR mice derived from three different sources, we measured body weight, body temperature, food intake, and water consumption at 3.5-day intervals over a period of eight weeks, starting from eight weeks of age. Among the C57BL/6 mice subgroups, body temperature, food intake, and water consumption showed no significant differences (Table 1). However, the body weight of the C57BL/6Korl subgroup was significantly higher than that of A:C57BL/6 and B:C57BL/6 mice over a period of 8 weeks (Figure 1A). In contrast, the three ICR mice subgroups did not display statistically significant differences in any of the measured variables with the exception of the higher body temperature of the B:ICR mice compared to the Korl:ICR mice (F2,12=23.281, P<0.001, Figure 1B, Table 1).
Comparison of adipose tissue mass
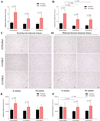
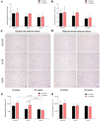
The wet mass of epididymal and retroperitoneal adipose tissue was measured at 8 and 16 weeks of age. Among C57BL/6 mice, the retroperitoneal adipose tissue mass of the C57BL/6Korl subgroup was significantly higher than that of A:C57BL/6 mice at 8 weeks of age (F2,12=5.657, P<0.05, Figure 2B) and higher than that of A:C57BL/6 and B:C57BL/6 mice at 16 weeks of age (F2,12=5.804, P<0.05, Figure 2B). In contrast, the weight of the epididymal adipose tissue did not differ significantly among the three C57BL/6 subgroups (Figure 2A). In the case of ICR mice, there was no significant difference in adipose tissue mass among the three subgroups, although the mass in Korl:ICR mice tended to be larger than in the other two subgroups (Figure 3A, 3B). These results indicate that C57BL/6 and ICR mice have similar WAT mass with a tendency to increase over time, except for the retroperitoneal adipose tissue.
Histological analysis of adipocytes
A quantitative histomorphometric analysis of WAT in C57BL/6 and ICR mice was performed, using light microscopy to determine the average adipocyte size in both types of WAT. Among the three C57BL/6 subgroups, the retroperitoneal adipocyte size of C57BL/6Korl mice was larger than that of A:C57BL/6 and B:C57BL/6 mice at 8 weeks of age (F2,12=14.258, P<0.01, Figure 2F). Overall, adipocyte size tended to increase over the next 8 weeks (Figure 2C, 2D, 2E, 2F). On the other hand, no significant difference in the size of epididymal and retroperitoneal adipocytes was observed among the three subgroups of ICR mice, except for the smaller epididymal adipocyte size of B:ICR mice compared to Korl:ICR and A:ICR mice at 16 weeks of age (F2,12=17.243, P<0.001, Figure 3E). Overall, the adipocyte size showed a tendency to increase over the 8-week period (Figure 3C, 3D, 3E and 3F). The results of the quantitative comparison indicate that C57BL/6 and ICR mice have similar WAT adipocyte sizes that tend to increase over the 8-week period, although there were some differences among the subgroups.
Comparison of resting metabolic rates
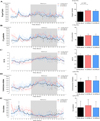
The resting metabolic rate of mice, which serves as an approximation of the metabolic phenotype, was measured for 24 hours at 8 weeks of age. In C57BL/6 mice, the average CO2 production, RER, CHO oxidation rate, and fat oxidation rate showed no significant differences among the subgroups, whereas the O2 uptake of C57BL/6Korl mice was lower than that of A:C57BL/6 mice (F2,12=5.761, P<0.05, Figure 4A). In ICR mice, none of the measured values showed significant differences among the three subgroups (Figure 5A-E). Our results indicated that C57BL/6 mice and ICR mice have similar resting metabolic phenotypes, with a higher metabolic rate observed in the dark period, as is typical for nocturnal rodents.
Discussion
As C57BL/6 and ICR mice are rodent strains widely utilized for various research studies, establishing their physiological metabolic phenotype is necessary to ensure the accuracy and reliability of experimental results, as well as to evaluate their value-in-use, especially in the case of the C57BL/6Korl and Korl:ICR substrains. However, a comparative analysis between mouse substrains derived from difference sources had not yet been performed. Therefore, we compared the resting metabolic rates and the physiological features of maturing mice using C57BL/6 and ICR mice derived from three different sources.
A few studies have reported that the body weight, body temperature, food intake, and water consumption are useful biomarkers related to the lifespan and disease progression in mice, which are fundamental to in vivo experimental research [192021]. In addition, physiological features vary depending on the strain as well as on other factors such as diet type and pharmacological administration [22]. In this study, these four physiological features were monitored and results showed that only the body weight of the C57BL/6Korl subgroup and the body temperature of the B:ICR subgroup were different, specifically higher, than those of the other C57BL or ICR subgroups, respectively. It was already known that some differences exist among mouse substrains [23]. Furthermore, considering the previous research according to which the comprehensive characteristics of strains vary because of differential genetic backgrounds and reactions to external stimuli [2425], the differences demonstrated in this study may result from corresponding genetic and/or epigenetic effects.
Most body fat is stored in WAT. Thus, the latter serves as a primary storage site for excess energy when the balance between energy intake and expenditure is positive. As such, WAT is involved in diverse biological functions and pathological processes in mammals [2627]. Moreover, it has been reported that the adipose tissue mass and morphological structure might differ based on its location in the body [28]. Therefore, we considered the tissue location in our comparative analysis of WAT mass and adipocyte size among mice of different origin. As shown in the stained tissue images (Figure 2C, 2D, 3C, 3D) and the accompanying bar graphs (Figures 2, 3), C57BL/6Korl and Korl:ICR mice tended to have higher tissue mass and larger adipocyte size than the other C57BL/6 and ICR subgroups, respectively, at 8 and 16 weeks of age, with a tendency to increase over a period of time. Regarding these results, more studies will be needed to investigate the causative and/or influencing factors underlying the differences of the C57BL/6Korl and Korl:ICR substrains.
RMR serves as an approximation of the metabolic phenotype. As such, its parameters, including O2 uptake, CO2 production, RER, CHO oxidation, and fat oxidation, vary depending on variables such as age, species, body mass, and environmental conditions [11]. RER, especially, is a crucial value obtained from the VCO2/VO2 ratio, indicating its high correlation with CHO and fat metabolism [29]. PER in mammals varies from 0.7 and 1.0, with these values representing pure CHO oxidation and pure lipid oxidation, respectively [30]. In this study, the different substrains of C57BL/6 mice or ICR mice showed similar metabolic phenotypes as there were no significant differences in their daily resting metabolic rates. The only exception was the low oxygen uptake of the C57BL/6Korl mice compared to the A:C57BL/6 mice, which might be the manifestation of genetic differences between these substrains or/and result from lower locomotor activity caused by higher body weight [23].
To sum up, we conducted a comparative analysis of physiological features and metabolic phenotypes in C57BL/6 mice and ICR mice derived from three different sources. Overall, the substrains of C57BL/6 mice (C57BL/6Korl, A:C57BL/6, and B:C57BL/6) and ICR mice (Korl:ICR, A:ICR, and B:ICR) showed similar physiological features (body weight, body temperature, food intake, and water consumption), WAT morphometric results, and metabolic phenotypes. However, it should be noted that the limited statistical reliability of this study, which only included 5 subjects per substrain, necessitates the conduction of follow-up studies with larger samples. Moreover, other physiological features, such as locomotor activity and maximal oxygen uptake, should be included in these future studies.
Despite these drawbacks, our study provides the first scientific evidence that C57BL/6Korl and Korl:ICR mice can be utilized as animal models for diverse experimental research with a level of accuracy and reliability similar to that ensured by using mice from commercial vendors.
 XML Download