This article has been
cited by other articles in ScienceCentral.
Abstract
Because changes in rat and dog hematological parameters according to storage conditions have been poorly documented, we sought to examine such changes. Blood analysis was performed using two hematology analyzers (ADVIA 2120i and Sysmex XN-V) after storage at room temperature and in cold storage for 5, 24, and 48 h, respectively. Interassay coefficients of variation for hematological parameters analyzed with the ADVIA 2120i and the XN-V showed similar. The levels of hematocrit, mean corpuscular volume, mean corpuscular hemoglobin, mean corpuscular hemoglobin concentration, and platelet (PLT) showed significant variations with time in blood samples of rats and dogs. The leukocyte subpopulation showed high variation with storage conditions. The data for leukocyte differential counts obtained using the ADVIA 2120i, XN-V, and a manual differential counting procedure showed good agreement for neutrophils and lymphocyte counts, but monocytes, eosinophils, and basophils showed differences between the procedures. In conclusions, most rat and dog hematological parameters showed minimal changes; however, some showed high variation with storage time and temperature, especially PLT and leukocyte subpopulations. In conclusion, when performing hematological analysis in dogs and rats, it will be exactitude to analyze blood samples in fresh condition and at least within 24 h in the cold storage.
Go to :

Keywords: Rat, dog, hematology, analysis, stability
It is recommended that hematological analyses be performed rapidly after taking the samples, or at least 24 h. However, in various situations, changes in experimental animal hematology measurements may occur when analyses are delayed for some reasons. Indeed, changes in animal hematology measurements may occur due to secondary factors, such as sample storage conditions or storage period [
1].
Human blood specimens stored at room temperature for more than 1 day were found to be acceptable, with some limitations for the complete blood count (CBC), but not for the differential [
2]. For rat blood samples, plasma should be run immediately after collection for reliable activated partial thromboplastin time results [
3]. For dog blood samples, differences in white blood cell (WBC) and platelet (PLT) counts varied with the specimen [
4]. As accurate automated measurements are very important for bioassays, these reports raise questions about the accuracy of measured variables and data validation after blood storage.
Reference ranges of standard experimental parameters are useful for comparisons in toxicology. Thus, historical control data of experimental animals would help interpreting the effects of test substances in routine toxicity and efficacy studies. With hematology, data may be influenced by environmental conditions, such as sample storage methods, and by animal factors, such as species, strain, age, and sex [
5].
Although reports about hematological parameters according to the age of the rodent and some blood parameters according to storage conditions have been published, changes in all hematological parameters according to storage conditions have been poorly documented for rat and dog blood samples. Thus, in this study, we sought to examine changes in hematological parameters with different storage condition, analyzed using two representative hematology analyzers (Siemens ADVIA 2120i and Sysmex XN-V). Blood samples from rats and dogs were measured with these analyzers within 5 h of sampling, and after storage for 24 and 48 h at 4 ℃ or room temperature.
Materials and Methods
Sample collection and storage methods
The animals had been fasted for ~18 h before sampling. Rat and dog samples were collected from various studies. The samples were placed into dipotassium ethylenediaminetetraacetic acid (EDTA) and analyzed within 5 h of collection, except those used in stability studies. Collected whole blood specimens were stored at 4 ℃ or room temperature, and assessed after 5, 24, and 48 h. This study (NSU-16-7) was approved by the animal experiment committee of Namseoul University, based on the Animal Protection Act.
Measurement of hematological parameters
The following hematological tests were performed using an automated hematology analyzer: an ADVIA 2120i (Siemens Healthcare Diagnostics, Tarrytown, NY) or an XN-V (Sysmex, Kobe, Japan). Hematological parameters included CBC parameters and leukocyte subpopulations; erythrocyte count (RBC), hemoglobin, hematocrit, reticulocytes, mean corpuscular volume (MCV), mean corpuscular hemoglobin (MCH), mean corpuscular hemoglobin concentration (MCHC), PLT, WBC, neutrophils, lymphocytes, monocytes, eosinophils, and basophils.
Interassay repeatability
Interassay repeatability was evaluated by calculating the coefficient of variation (CV) of 10 consecutive measurements of internal quality control material in three different controls (low, normal, and high). Coefficients of variation (%) were calculated as standard deviation (SD)/mean×100.
Changes of hematological parameters by storage time and temperature
Blood samples from rats (n=40) and dogs (n=20) were analyzed within 5 h of collection and then at 24 and 48 h after storage at 4 ℃ or room temperature using both the ADVIA 2120i, and the XN-V for hematological parameters. For both species, the differences between the first analysis and the subsequent analyzers for hematological parameters were examined.
Comparison of rat and dog hematological parameters analyzed by the ADVIA 2120i and XN-V
Hematological parameters analyzed by ADVIA 2120i and XN-V were compared for correlations at each time point.
Comparison of leukocyte differential counts between manual counting and automatic counting
The rat and dog blood samples showing high variation between ADVIA 2120i and XN-V were smeared on a microscopic slide and stained with Diff-Quick (Hemacolor, Merck). Leukocyte differential counts were carried out manually and these data were compared with those obtained with the ADVIA 2120i and XN-V.
Statistical analysis
Statistical analysis was performed with the SAS (software ver. 9.3, SAS Institute Inc., Cary, NC). Data were analyzed using Bartlett's test for homogeneity of variance. One-way analysis of variance was used for homogeneous data, and if significant, Dunnett's test was then used for multiple comparisons (significance levels: P<0.05 and P<0.01, two-tailed). The Kruskal-Wallis was sued with heterogeneous data, and then, if significant, Steel's test was applied for multiple comparisons (significance levels: P<0.05 and P<0.01, two-tailed).
Go to :

Results
Interassay repeatability
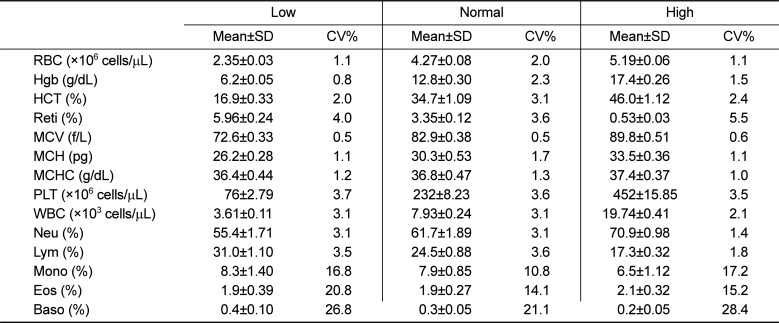
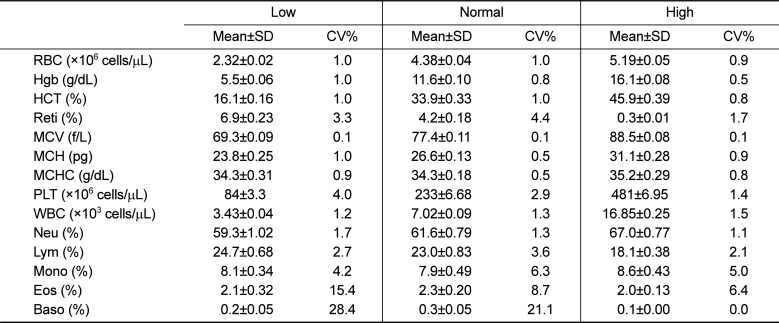
Interassay CV values are shown in
Tables 1 and
2 for the ADVIA 2120
i and XN-V, respectively. In analyses using the ADVIA 2120
i, CV values over 3% were seen in reticulocytes and PLT of low, normal, and high controls, and in hematocrit of the normal control. In analyses using the XN-V, CV values over 3% were seen in reticulocytes and PLT of both the low and the normal controls. Compared with the ADVIA 2120
i, the CV value of PLT was lower than with the XN-V. The CV values in leukocyte subpopulations of three different controls analyzed with the ADVIA 2120
i and XN-V showed high levels, ranging from 4.2 to 28.4%.
Table 1
Interassay repeatability of the Siemens ADVIA 2120i hematology analyzer performed with quality control materials at three different concentrations (low, normal, and high)
|
Low |
Normal |
High |
|
Mean±SD |
CV% |
Mean±SD |
CV% |
Mean±SD |
CV% |
|
RBC (×106 cells/µL) |
2.35±0.03 |
1.1 |
4.27±0.08 |
2.0 |
5.19±0.06 |
1.1 |
|
Hgb (g/dL) |
6.2±0.05 |
0.8 |
12.8±0.30 |
2.3 |
17.4±0.26 |
1.5 |
|
HCT (%) |
16.9±0.33 |
2.0 |
34.7±1.09 |
3.1 |
46.0±1.12 |
2.4 |
|
Reti (%) |
5.96±0.24 |
4.0 |
3.35±0.12 |
3.6 |
0.53±0.03 |
5.5 |
|
MCV (f/L) |
72.6±0.33 |
0.5 |
82.9±0.38 |
0.5 |
89.8±0.51 |
0.6 |
|
MCH (pg) |
26.2±0.28 |
1.1 |
30.3±0.53 |
1.7 |
33.5±0.36 |
1.1 |
|
MCHC (g/dL) |
36.4±0.44 |
1.2 |
36.8±0.47 |
1.3 |
37.4±0.37 |
1.0 |
|
PLT (×106 cells/µL) |
76±2.79 |
3.7 |
232±8.23 |
3.6 |
452±15.85 |
3.5 |
|
WBC (×103 cells/µL) |
3.61±0.11 |
3.1 |
7.93±0.24 |
3.1 |
19.74±0.41 |
2.1 |
|
Neu (%) |
55.4±1.71 |
3.1 |
61.7±1.89 |
3.1 |
70.9±0.98 |
1.4 |
|
Lym (%) |
31.0±1.10 |
3.5 |
24.5±0.88 |
3.6 |
17.3±0.32 |
1.8 |
|
Mono (%) |
8.3±1.40 |
16.8 |
7.9±0.85 |
10.8 |
6.5±1.12 |
17.2 |
|
Eos (%) |
1.9±0.39 |
20.8 |
1.9±0.27 |
14.1 |
2.1±0.32 |
15.2 |
|
Baso (%) |
0.4±0.10 |
26.8 |
0.3±0.05 |
21.1 |
0.2±0.05 |
28.4 |

Table 2
Interassay repeatability of the Sysmex XN-V hematology analyzer performed with quality control materials in three different concentrations (low, normal, and high)
|
Low |
Normal |
High |
|
Mean±SD |
CV% |
Mean±SD |
CV% |
Mean±SD |
CV% |
|
RBC (×106 cells/µL) |
2.32±0.02 |
1.0 |
4.38±0.04 |
1.0 |
5.19±0.05 |
0.9 |
|
Hgb (g/dL) |
5.5±0.06 |
1.0 |
11.6±0.10 |
0.8 |
16.1±0.08 |
0.5 |
|
HCT (%) |
16.1±0.16 |
1.0 |
33.9±0.33 |
1.0 |
45.9±0.39 |
0.8 |
|
Reti (%) |
6.9±0.23 |
3.3 |
4.2±0.18 |
4.4 |
0.3±0.01 |
1.7 |
|
MCV (f/L) |
69.3±0.09 |
0.1 |
77.4±0.11 |
0.1 |
88.5±0.08 |
0.1 |
|
MCH (pg) |
23.8±0.25 |
1.0 |
26.6±0.13 |
0.5 |
31.1±0.28 |
0.9 |
|
MCHC (g/dL) |
34.3±0.31 |
0.9 |
34.3±0.18 |
0.5 |
35.2±0.29 |
0.8 |
|
PLT (×106 cells/µL) |
84±3.3 |
4.0 |
233±6.68 |
2.9 |
481±6.95 |
1.4 |
|
WBC (×103 cells/µL) |
3.43±0.04 |
1.2 |
7.02±0.09 |
1.3 |
16.85±0.25 |
1.5 |
|
Neu (%) |
59.3±1.02 |
1.7 |
61.6±0.79 |
1.3 |
67.0±0.77 |
1.1 |
|
Lym (%) |
24.7±0.68 |
2.7 |
23.0±0.83 |
3.6 |
18.1±0.38 |
2.1 |
|
Mono (%) |
8.1±0.34 |
4.2 |
7.9±0.49 |
6.3 |
8.6±0.43 |
5.0 |
|
Eos (%) |
2.1±0.32 |
15.4 |
2.3±0.20 |
8.7 |
2.0±0.13 |
6.4 |
|
Baso (%) |
0.2±0.05 |
28.4 |
0.3±0.05 |
21.1 |
0.1±0.00 |
0.0 |

Changes in hematological parameters with storage time and temperature
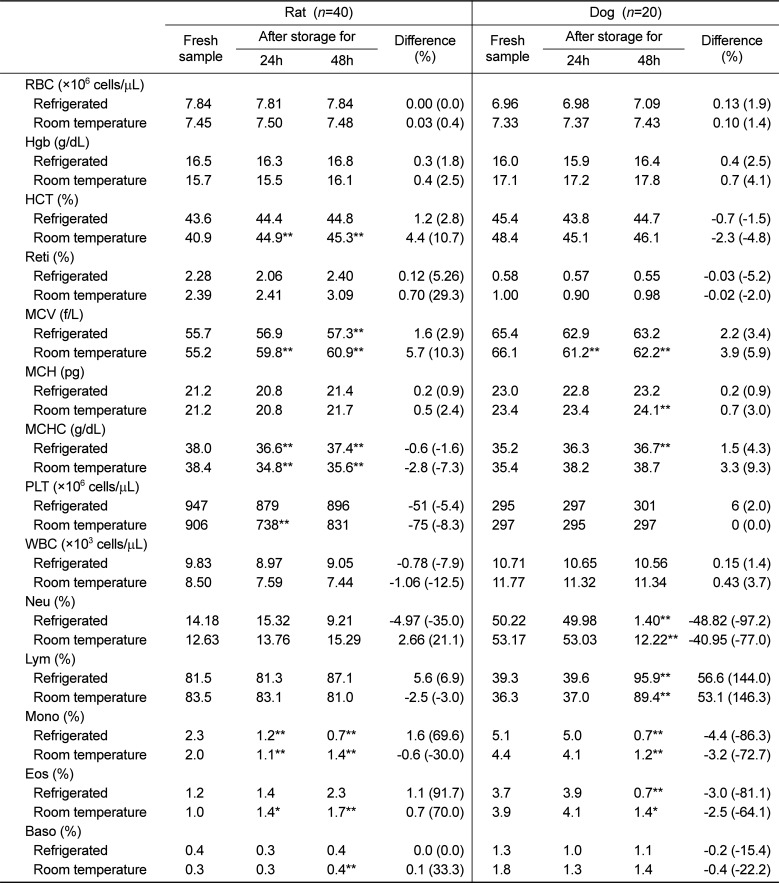
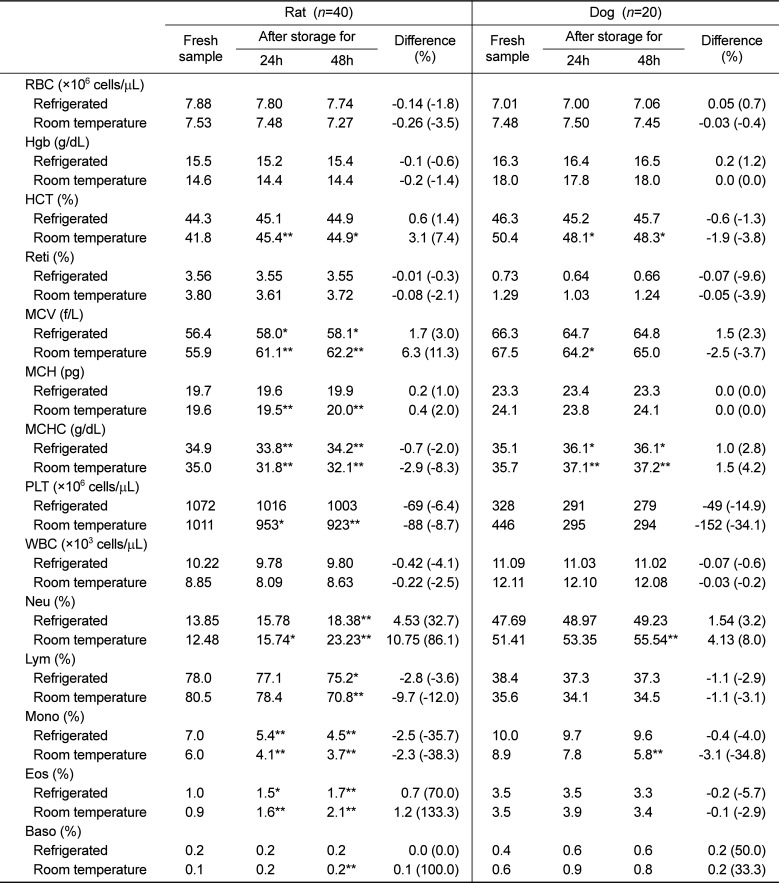
The effects of sample storage times and temperatures prior to analysis with the ADVIA 2120
i and XN-V were examined by evaluating changes in hematological parameters of rat and dog samples both fresh and after 24 and 48 h of storage at 4 ℃ and room temperature (
Tables 3 and
4). The hematological parameters analyzed with the ADVIA 2120
i and XN-V showed minimal changes in RBC, hemoglobin, reticulocytes, and WBC after 24 and 48 h of storage at 4 ℃ or room temperature.
Table 3
Changes in hematological parameters according to storage time and temperature (ADVIA 2120i)
|
Rat (n=40) |
Dog (n=20) |
|
Fresh sample |
After storage for |
Difference (%) |
Fresh sample |
After storage for |
Difference (%) |
|
24h |
48h |
24h |
48h |
|
RBC (×106 cells/µL) |
|
|
|
|
|
|
|
|
|
Refrigerated |
7.84 |
7.81 |
7.84 |
0.00 (0.0) |
6.96 |
6.98 |
7.09 |
0.13 (1.9) |
|
Room temperature |
7.45 |
7.50 |
7.48 |
0.03 (0.4) |
7.33 |
7.37 |
7.43 |
0.10 (1.4) |
|
Hgb (g/dL) |
|
|
|
|
|
|
|
|
|
Refrigerated |
16.5 |
16.3 |
16.8 |
0.3 (1.8) |
16.0 |
15.9 |
16.4 |
0.4 (2.5) |
|
Room temperature |
15.7 |
15.5 |
16.1 |
0.4 (2.5) |
17.1 |
17.2 |
17.8 |
0.7 (4.1) |
|
HCT (%) |
|
|
|
|
|
|
|
|
|
Refrigerated |
43.6 |
44.4 |
44.8 |
1.2 (2.8) |
45.4 |
43.8 |
44.7 |
−0.7 (−1.5) |
|
Room temperature |
40.9 |
44.9**
|
45.3**
|
4.4 (10.7) |
48.4 |
45.1 |
46.1 |
−2.3 (−4.8) |
|
Reti (%) |
|
|
|
|
|
|
|
|
|
Refrigerated |
2.28 |
2.06 |
2.40 |
0.12 (5.26) |
0.58 |
0.57 |
0.55 |
−0.03 (−5.2) |
|
Room temperature |
2.39 |
2.41 |
3.09 |
0.70 (29.3) |
1.00 |
0.90 |
0.98 |
−0.02 (−2.0) |
|
MCV (f/L) |
|
|
|
|
|
|
|
|
|
Refrigerated |
55.7 |
56.9 |
57.3**
|
1.6 (2.9) |
65.4 |
62.9 |
63.2 |
2.2 (3.4) |
|
Room temperature |
55.2 |
59.8**
|
60.9**
|
5.7 (10.3) |
66.1 |
61.2**
|
62.2**
|
3.9 (5.9) |
|
MCH (pg) |
|
|
|
|
|
|
|
|
|
Refrigerated |
21.2 |
20.8 |
21.4 |
0.2 (0.9) |
23.0 |
22.8 |
23.2 |
0.2 (0.9) |
|
Room temperature |
21.2 |
20.8 |
21.7 |
0.5 (2.4) |
23.4 |
23.4 |
24.1**
|
0.7 (3.0) |
|
MCHC (g/dL) |
|
|
|
|
|
|
|
|
|
Refrigerated |
38.0 |
36.6**
|
37.4**
|
−0.6 (−1.6) |
35.2 |
36.3 |
36.7**
|
1.5 (4.3) |
|
Room temperature |
38.4 |
34.8**
|
35.6**
|
−2.8 (−7.3) |
35.4 |
38.2 |
38.7 |
3.3 (9.3) |
|
PLT (×106 cells/µL) |
|
|
|
|
|
|
|
|
|
Refrigerated |
947 |
879 |
896 |
−51 (−5.4) |
295 |
297 |
301 |
6 (2.0) |
|
Room temperature |
906 |
738**
|
831 |
−75 (−8.3) |
297 |
295 |
297 |
0 (0.0) |
|
WBC (×103 cells/µL) |
|
|
|
|
|
|
|
|
|
Refrigerated |
9.83 |
8.97 |
9.05 |
−0.78 (−7.9) |
10.71 |
10.65 |
10.56 |
0.15 (1.4) |
|
Room temperature |
8.50 |
7.59 |
7.44 |
−1.06 (−12.5) |
11.77 |
11.32 |
11.34 |
0.43 (3.7) |
|
Neu (%) |
|
|
|
|
|
|
|
|
|
Refrigerated |
14.18 |
15.32 |
9.21 |
−4.97 (−35.0) |
50.22 |
49.98 |
1.40**
|
−48.82 (−97.2) |
|
Room temperature |
12.63 |
13.76 |
15.29 |
2.66 (21.1) |
53.17 |
53.03 |
12.22**
|
−40.95 (−77.0) |
|
Lym (%) |
|
|
|
|
|
|
|
|
|
Refrigerated |
81.5 |
81.3 |
87.1 |
5.6 (6.9) |
39.3 |
39.6 |
95.9**
|
56.6 (144.0) |
|
Room temperature |
83.5 |
83.1 |
81.0 |
−2.5 (−3.0) |
36.3 |
37.0 |
89.4**
|
53.1 (146.3) |
|
Mono (%) |
|
|
|
|
|
|
|
|
|
Refrigerated |
2.3 |
1.2**
|
0.7**
|
1.6 (69.6) |
5.1 |
5.0 |
0.7**
|
−4.4 (−86.3) |
|
Room temperature |
2.0 |
1.1**
|
1.4**
|
−0.6 (−30.0) |
4.4 |
4.1 |
1.2**
|
−3.2 (−72.7) |
|
Eos (%) |
|
|
|
|
|
|
|
|
|
Refrigerated |
1.2 |
1.4 |
2.3 |
1.1 (91.7) |
3.7 |
3.9 |
0.7**
|
−3.0 (−81.1) |
|
Room temperature |
1.0 |
1.4*
|
1.7**
|
0.7 (70.0) |
3.9 |
4.1 |
1.4*
|
−2.5 (−64.1) |
|
Baso (%) |
|
|
|
|
|
|
|
|
|
Refrigerated |
0.4 |
0.3 |
0.4 |
0.0 (0.0) |
1.3 |
1.0 |
1.1 |
−0.2 (−15.4) |
|
Room temperature |
0.3 |
0.3 |
0.4**
|
0.1 (33.3) |
1.8 |
1.3 |
1.4 |
−0.4 (-22.2) |

Table 4
Changes in hematological parameters according to storage time and temperature (XN-V)
|
Rat (n=40) |
Dog (n=20) |
|
Fresh sample |
After storage for |
Difference (%) |
Fresh sample |
After storage for |
Difference (%) |
|
24h |
48h |
24h |
48h |
|
RBC (×106 cells/µL) |
|
|
|
|
|
|
|
|
|
Refrigerated |
7.88 |
7.80 |
7.74 |
−0.14 (−1.8) |
7.01 |
7.00 |
7.06 |
0.05 (0.7) |
|
Room temperature |
7.53 |
7.48 |
7.27 |
−0.26 (−3.5) |
7.48 |
7.50 |
7.45 |
−0.03 (−0.4) |
|
Hgb (g/dL) |
|
|
|
|
|
|
|
|
|
Refrigerated |
15.5 |
15.2 |
15.4 |
−0.1 (−0.6) |
16.3 |
16.4 |
16.5 |
0.2 (1.2) |
|
Room temperature |
14.6 |
14.4 |
14.4 |
−0.2 (−1.4) |
18.0 |
17.8 |
18.0 |
0.0 (0.0) |
|
HCT (%) |
|
|
|
|
|
|
|
|
|
Refrigerated |
44.3 |
45.1 |
44.9 |
0.6 (1.4) |
46.3 |
45.2 |
45.7 |
−0.6 (−1.3) |
|
Room temperature |
41.8 |
45.4**
|
44.9*
|
3.1 (7.4) |
50.4 |
48.1*
|
48.3*
|
−1.9 (−3.8) |
|
Reti (%) |
|
|
|
|
|
|
|
|
|
Refrigerated |
3.56 |
3.55 |
3.55 |
−0.01 (−0.3) |
0.73 |
0.64 |
0.66 |
−0.07 (−9.6) |
|
Room temperature |
3.80 |
3.61 |
3.72 |
−0.08 (−2.1) |
1.29 |
1.03 |
1.24 |
−0.05 (−3.9) |
|
MCV (f/L) |
|
|
|
|
|
|
|
|
|
Refrigerated |
56.4 |
58.0*
|
58.1*
|
1.7 (3.0) |
66.3 |
64.7 |
64.8 |
1.5 (2.3) |
|
Room temperature |
55.9 |
61.1**
|
62.2**
|
6.3 (11.3) |
67.5 |
64.2*
|
65.0 |
−2.5 (−3.7) |
|
MCH (pg) |
|
|
|
|
|
|
|
|
|
Refrigerated |
19.7 |
19.6 |
19.9 |
0.2 (1.0) |
23.3 |
23.4 |
23.3 |
0.0 (0.0) |
|
Room temperature |
19.6 |
19.5**
|
20.0**
|
0.4 (2.0) |
24.1 |
23.8 |
24.1 |
0.0 (0.0) |
|
MCHC (g/dL) |
|
|
|
|
|
|
|
|
|
Refrigerated |
34.9 |
33.8**
|
34.2**
|
−0.7 (−2.0) |
35.1 |
36.1*
|
36.1*
|
1.0 (2.8) |
|
Room temperature |
35.0 |
31.8**
|
32.1**
|
−2.9 (−8.3) |
35.7 |
37.1**
|
37.2**
|
1.5 (4.2) |
|
PLT (×106 cells/µL) |
|
|
|
|
|
|
|
|
|
Refrigerated |
1072 |
1016 |
1003 |
−69 (−6.4) |
328 |
291 |
279 |
−49 (−14.9) |
|
Room temperature |
1011 |
953*
|
923**
|
−88 (−8.7) |
446 |
295 |
294 |
−152 (−34.1) |
|
WBC (×103 cells/µL) |
|
|
|
|
|
|
|
|
|
Refrigerated |
10.22 |
9.78 |
9.80 |
−0.42 (−4.1) |
11.09 |
11.03 |
11.02 |
−0.07 (−0.6) |
|
Room temperature |
8.85 |
8.09 |
8.63 |
−0.22 (−2.5) |
12.11 |
12.10 |
12.08 |
−0.03 (−0.2) |
|
Neu (%) |
|
|
|
|
|
|
|
|
|
Refrigerated |
13.85 |
15.78 |
18.38**
|
4.53 (32.7) |
47.69 |
48.97 |
49.23 |
1.54 (3.2) |
|
Room temperature |
12.48 |
15.74*
|
23.23**
|
10.75 (86.1) |
51.41 |
53.35 |
55.54**
|
4.13 (8.0) |
|
Lym (%) |
|
|
|
|
|
|
|
|
|
Refrigerated |
78.0 |
77.1 |
75.2*
|
−2.8 (−3.6) |
38.4 |
37.3 |
37.3 |
−1.1 (−2.9) |
|
Room temperature |
80.5 |
78.4 |
70.8**
|
−9.7 (−12.0) |
35.6 |
34.1 |
34.5 |
−1.1 (−3.1) |
|
Mono (%) |
|
|
|
|
|
|
|
|
|
Refrigerated |
7.0 |
5.4**
|
4.5**
|
−2.5 (−35.7) |
10.0 |
9.7 |
9.6 |
−0.4 (−4.0) |
|
Room temperature |
6.0 |
4.1**
|
3.7**
|
−2.3 (−38.3) |
8.9 |
7.8 |
5.8**
|
−3.1 (−34.8) |
|
Eos (%) |
|
|
|
|
|
|
|
|
|
Refrigerated |
1.0 |
1.5*
|
1.7**
|
0.7 (70.0) |
3.5 |
3.5 |
3.3 |
−0.2 (−5.7) |
|
Room temperature |
0.9 |
1.6**
|
2.1**
|
1.2 (133.3) |
3.5 |
3.9 |
3.4 |
−0.1 (−2.9) |
|
Baso (%) |
|
|
|
|
|
|
|
|
|
Refrigerated |
0.2 |
0.2 |
0.2 |
0.0 (0.0) |
0.4 |
0.6 |
0.6 |
0.2 (50.0) |
|
Room temperature |
0.1 |
0.2 |
0.2**
|
0.1 (100.0) |
0.6 |
0.9 |
0.8 |
0.2 (33.3) |

In rat samples, most CBC parameters, except hematocrit, MCV, MCHC, and PLT, showed changes <±5% between fresh and after 48 h at 4 ℃. In contrast, changes in most leukocyte subpopulations were >±5% between fresh samples and after 24 and 48 h of storage.
In dog samples, all CBC parameters except reticulocytes and PLT at 4℃ and PLT at room temperature showed changes <±5% between fresh and 48 h. Changes in most leukocyte subpopulations showed changes >10% after 48 h at 4 ℃ and room temperature compared with the results of fresh samples.
Compared with those of rats, leukocyte subpopulations in dogs showed smaller changes over 48 h at 4 ℃ and room temperature. Changes in hematological parameters of two species between fresh samples and after 24 and 48 h of storage using the ADVIA 2120i were similar to those with the XN-V, but some parameters showed changes >±5% between times versus results with the XN-V.
Comparison of rat and dog hematological parameters analyzed with ADVIA 2120i and XN-V
Hematological parameters analyzed by ADVIA 2120
i and XN-V were shown in
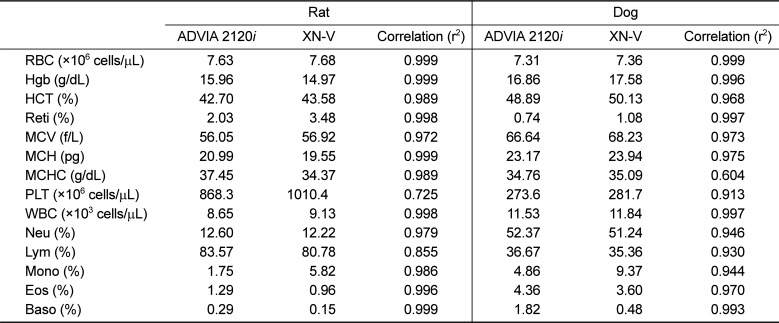
Table 5. There were good agreement and correlations between the data from the both analyzers for CBC parameters and leukocyte subpopulations. Correlation coefficients (r2) of most CBC parameters were >0.9; exceptions including PLT in rat and MCHC in dog.
Table 5
Comparison of rat and dog hematological parameters analyzed by the ADVIA 2120i and XN-V
|
Rat |
Dog |
|
ADVIA 2120i |
XN-V |
Correlation (r2) |
ADVIA 2120i |
XN-V |
Correlation (r2) |
|
RBC (×106 cells/µL) |
7.63 |
7.68 |
0.999 |
7.31 |
7.36 |
0.999 |
|
Hgb (g/dL) |
15.96 |
14.97 |
0.999 |
16.86 |
17.58 |
0.996 |
|
HCT (%) |
42.70 |
43.58 |
0.989 |
48.89 |
50.13 |
0.968 |
|
Reti (%) |
2.03 |
3.48 |
0.998 |
0.74 |
1.08 |
0.997 |
|
MCV (f/L) |
56.05 |
56.92 |
0.972 |
66.64 |
68.23 |
0.973 |
|
MCH (pg) |
20.99 |
19.55 |
0.999 |
23.17 |
23.94 |
0.975 |
|
MCHC (g/dL) |
37.45 |
34.37 |
0.989 |
34.76 |
35.09 |
0.604 |
|
PLT (×106 cells/µL) |
868.3 |
1010.4 |
0.725 |
273.6 |
281.7 |
0.913 |
|
WBC (×103 cells/µL) |
8.65 |
9.13 |
0.998 |
11.53 |
11.84 |
0.997 |
|
Neu (%) |
12.60 |
12.22 |
0.979 |
52.37 |
51.24 |
0.946 |
|
Lym (%) |
83.57 |
80.78 |
0.855 |
36.67 |
35.36 |
0.930 |
|
Mono (%) |
1.75 |
5.82 |
0.986 |
4.86 |
9.37 |
0.944 |
|
Eos (%) |
1.29 |
0.96 |
0.996 |
4.36 |
3.60 |
0.970 |
|
Baso (%) |
0.29 |
0.15 |
0.999 |
1.82 |
0.48 |
0.993 |

Comparison of leukocyte differential counts between manual counting and automatic counting
Data for leukocyte differential counts obtained using the ADVIA 2120
i, XN-V, and a manual differential counting procedure were showed in
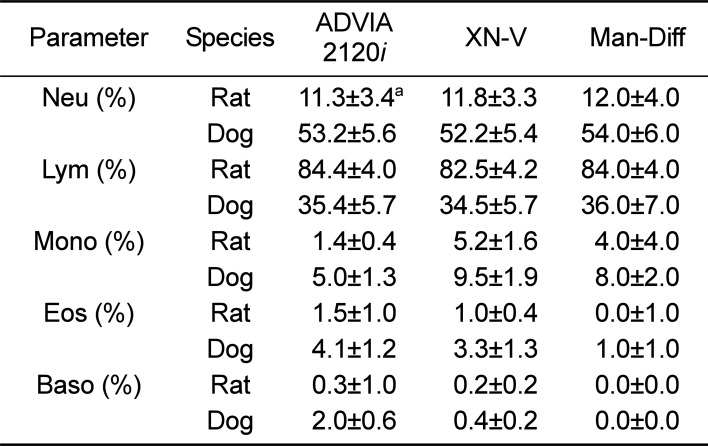
Table 6. There were good agreements for neutrophils and lymphocytes counts, but monocytes, eosinophils, and basophils showed difference among the three procedures.
Table 6
Comparison of leukocyte differential counts obtained with the ADVIA 2120i and XN-V and a manual differential counting procedure for rat and dog blood samples
|
Parameter |
Species |
ADVIA 2120i |
XN-V |
Man-Diff |
|
Neu (%) |
Rat |
11.3±3.4a
|
11.8±3.3 |
12.0±4.0 |
|
Dog |
53.2±5.6 |
52.2±5.4 |
54.0±6.0 |
|
Lym (%) |
Rat |
84.4±4.0 |
82.5±4.2 |
84.0±4.0 |
|
Dog |
35.4±5.7 |
34.5±5.7 |
36.0±7.0 |
|
Mono (%) |
Rat |
1.4±0.4 |
5.2±1.6 |
4.0±4.0 |
|
Dog |
5.0±1.3 |
9.5±1.9 |
8.0±2.0 |
|
Eos (%) |
Rat |
1.5±1.0 |
1.0±0.4 |
0.0±1.0 |
|
Dog |
4.1±1.2 |
3.3±1.3 |
1.0±1.0 |
|
Baso (%) |
Rat |
0.3±1.0 |
0.2±0.2 |
0.0±0.0 |
|
Dog |
2.0±0.6 |
0.4±0.2 |
0.0±0.0 |

Go to :

Discussion
This study was performed to examine changes in rat and dog blood parameters according to storage period and temperature. Because it was assumed that blood storage at room temperature might cause moderate variations in some hematological parameters, we first examined changes in blood parameters upon room temperature storage. In rat samples, hematocrit increased at room temperature. MCV increased and MCHC decreased upon room temperature storage, and at 4 ℃. Generally, it has been reported that refrigerated storage is important for the stability of CBC in human samples [
6]. As MCV had potential to increase after 24 h if EDTA-treated samples were stored at room temperature [
7], it seemed that EDTA as anticoagulant did not allow the accurate determination of the CBC at 24 h with storage at room temperature. However, our study showed that there were increases in MCV even with storage at 4 ℃. We suggest that strict protocols should be established for the storage of rat blood samples to minimize variations in hematological parameters.
In this study, the storage of dog samples at room temperature caused a decrease in MCV and an increase in MCHC, when analyzed with both blood analyzers. It has been reported that, using dog blood samples, hematocrit, MCV, and MCHC were influenced by erythrocyte swelling during measurement [
8]. It has also been reported that the storage of dog samples at room temperature caused little or no change in RBC, hemoglobin, or MCH, while there were moderate increases in hematocrit, MCV, and reticulocytes count and a moderate decrease in MCHC [
1].
In the rat samples, monocytes were decreased with storage at room temperature, and at 4 ℃. However, eosinophils were increased with storage at room temperature, although there was no change in WBC counts. It seems that, because the populations of monocytes and eosinophils were low, the change in total WBC was minimal. In the dog samples, neutrophils decreased markedly and monocytes and eosinophils decreased with storage for 48 h at room temperature, and at 4 ℃. However, lymphocytes increased markedly with storage for 48 h at room temperature, and at 4 ℃. However, there was no change in WBC counts. These results indicated dog samples should not be stored for more than 24 h, because there were many variations in differential counts. It was reported that spuriously low WBC counts may be observed because of agglutination in the presence of EDTA [
7]. Disodium, dipotassium, and tripotassium EDTA have been used for hematological testing [
9]. In this study, dipotassium EDTA did not cause a change in WBC counts.
In this study, two representative hematology analyzers were shown to be reliable, good agreement and correlations between the data from the analyzers. However, the r2 value of PLT was 0.725 in rat samples and the r2 value of MCHC was 0.604 in dog samples. These values may have been due to the detection method. For PLT, a PLT-fluorescent method demonstrated good results for reproducibility in samples with platelet counts less than 50×10
9/L and could distinguish platelets from fragmented erythrocytes [
1011]. As there is little information for the detection of MCHC, further studies are needed to investigate the difference between the two analyzers.
We showed good agreement for neutrophils and lymphocytes counts. However, monocytes, eosinophils, and basophils showed difference among the three procedures. Notably, the manual monocytes count was similar to that with the XN-V, but higher than the value with the ADVIA 2120
i in rat and dog blood samples. Manual eosinophils and basophils counts were lower than those with the XN-V. In addition, monocytes counts may be underestimated and eosinophils and basophils numbers may be overestimated with the ADVIA 2120i, but not the XN-V. It has been reported that the Siemens ADVIA 120 showed notably lower measurements of lymphocytes and monocytes with human blood samples [
12]. In contrast, this study suggested that monocytes numbers may be overestimated with the ADVIA 2120
i in rat and dog blood samples. Using human specimens, a higher percentage of lymphocytes and a lower percentage of monocytes originated from an erroneous classification of immature and small monocytes as lymphocytes [
13]. In many situations, the WBC differential scatter gram is of great help in flagging. Flags generated depend on the software version in the hematology analyzer, and the performance in detecting the same anomalies may differ according to which analyzer is used, even those from the same manufacturer [
14]. As no animal data about leukocyte subpopulations have been reported yet, this study provides fundamental animal data.
Taken together, most hematological parameters in rat and dog showed minimal changes, according to storage time and temperature; however, some parameters showed high variation, especially for PLT and leukocyte subpopulation. In conclusion, when performing hematological analysis in dogs and rats, it will be exactitude to analyze blood samples in fresh condition and at least within 24 h in the cold storage.
Go to :


 PDF
PDF ePub
ePub Citation
 Print
Print


 XML Download