

 PDF
PDF ePub
ePub Citation
 Print
Print


Transplanted animal tumors have been used widely in the elucidation of the fundamental pathophysiology of malignant diseases, and in assessing the effectiveness of various cancer therapy regimens. For example, animal tumor models have been used for identifying new therapeutic targets and developing drugs against specific targets, as well as for preclinical determination of the therapeutic potentials of drugs used alone or in combination with other modalities such as radiotherapy, immunotherapy, or hyperthermia. Various types of tumor models, including subcutaneous or orthotopic xenograft models, genetically engineered tumor models, primary human tumor grafts, and various multi-stage carcinogen-induced tumor models, have been used [1]. The use of human cancer xenografts grown in nude mice has been demonstrated to be particularly valuable for assessing anti-tumor efficacy in the early screening of new drugs because of their reproducibility, and cost- and time-effectiveness [2345].
For effective and reliable antitumor experiments using xenograft models, establishment of a stable model is essential. Various factors need to be considered while establishing human tumor xenografts, such as the site of the xenografts, the number of transplanted cells, and the growth properties of the xenografts. Furthermore, the outcome of treatments may depend on the size of xenografts at the time of initiation of treatment (drug or irradiation), scheduling of treatments, and the endpoint used for assessing the results.
In the present study, we retrospectively analyzed various aspects of human tumor xenografts grown in athymic nude mice used in our institute in 2009-2015 with the view of revealing valuable information for the effective use of a human tumor xenograft mouse model for future cancer research.
Materials and Methods
Study design
We retrospectively analyzed data obtained from human cancer xenografts used for various anticancer researches in our institution from 2009 through 2015. Of the 390 xenografts analyzed, 237 were control xenografts and 157 were irradiated xenografts.
Data collection
Cell lines
The following human cancer cell lines were used: colorectal cancer cell lines HT-29, HCT116, and HCT-8; non-small cell lung cancer cell lines H460, A549, and PC-9; hepatic cancer cell line HepG2; chronic myelogenous leukemia cancer cell line K562; and bile duct cancer cell line HuCCT-1.
Cell culture
Cells were grown in a humidified atmosphere of 5% CO2 in air at 37℃. Stock cells were maintained in Roswell Park Memorial Institute 1640 medium supplemented with 1% penicillin-streptomycin and 10% fetal bovine serum (HT-29, HCT116, H460, PC-9, HepG2, K562, and HuCCT-1) or 10% horse serum (HCT-8). A549 cells were maintained in Dulbecco's Modified Eagle's Medium supplemented with 1% penicillin-streptomycin and 10% fetal bovine serum.
Proliferation assays
To assess the proliferation rate of cancer cells in vitro, 1×10⁵ cells were plated per well in a 6-well plate and cultured. Viable cell counts were estimated using a hemocytometer at 24, 48, and 72 h. All assays were performed in triplicates, and the population doubling times were obtained.
Colony forming assay
Cells were seeded in 60-mm plates in triplicates at a density of 300 cells/plate along with 4 ml of culture medium. After 24 h of incubation, cells were irradiated with 2 Gy in a single exposure and grown for 2-3 weeks. The resultant colonies were fixed for 30 min with 100% methanol and stained with 0.4% crystal violet in 20% ethanol, followed by rinsing with tap water. Colonies containing >50 cells were counted, averaged, and the surviving cell fractions were obtained.
Xenograft models
Male athymic nude mice (4-5 weeks of age) were purchased from OrientBio (Seongnam, Korea) or Nara biotech (Seoul, Korea). Animals were maintained under specific pathogen-free conditions and provided with sterile food and water ad libitum. The mice were adapted to the new laboratory environment for 6-9 days before use. Into the right hind leg of each mouse, 1-5×10⁶ human cancer cells belonging to various cell lines were injected subcutaneously. Tumor diameters were measured with a caliper 2-3 times a week. When tumor volumes reached 100-200 mm3, the mice were randomly divided into control and treatment groups.
Data analysis
The tumor volume (V) was calculated using the following formula:
Tumor growth rate (TGR; % increase/day) was obtained by fitting of the exponential growth equation with the calculated tumor volume using a statistical program (GraphPad Software. San Diego, CA).
where V(t) is the tumor volume at time t, Vo is the initial volume, and g is a parameter characterizing the rate of tumor growth. Tumor volume doubling time was quantified using TGR (% increase/day), equal to
The response of the tumors to irradiation was quantitated from the ratio of the volume of tumor irradiated over that of control tumors (T/C%).
We also assessed the correlations between the T/C% (in vivo) and the surviving fraction of cells after irradiation with 2 Gy in vitro (SF2).
Statistical analysis
Data were arranged in Excel (Microsoft) and analyzed with GraphPad Prizm 3.0 (GraphPad Software). Unpaired t-test or one-way analysis of variance test was used to evaluate the effects of the injected cell number on tumor growth pattern, with the P-value set at 0.05 for significance. The relationship between the TGR in vivo and the cell proliferation rate in vitro was examined using Pearson's correlation (rP). We also compared the correlations between SF2 (in vitro) and T/C% (in vivo) using the same analysis.
Ethics statement
All animal study protocols and studies were approved by the Institutional Animal Care and Use Committee (IACUC) of the Korean Institute of Radiological and Medical Sciences (KIRAMS 2011-25, KIRAMS 2011-31, KIRAMS 2012-15, KIRAMS 2012-34, KIRAMS 2012-36, KIRAMS 2012-53, KIRAMS 2013-03, KIRAMS 2013-17, KIRAMS 2014-23, KIRAMS 2015-58).
Results
Factors affecting the growth of xenografts
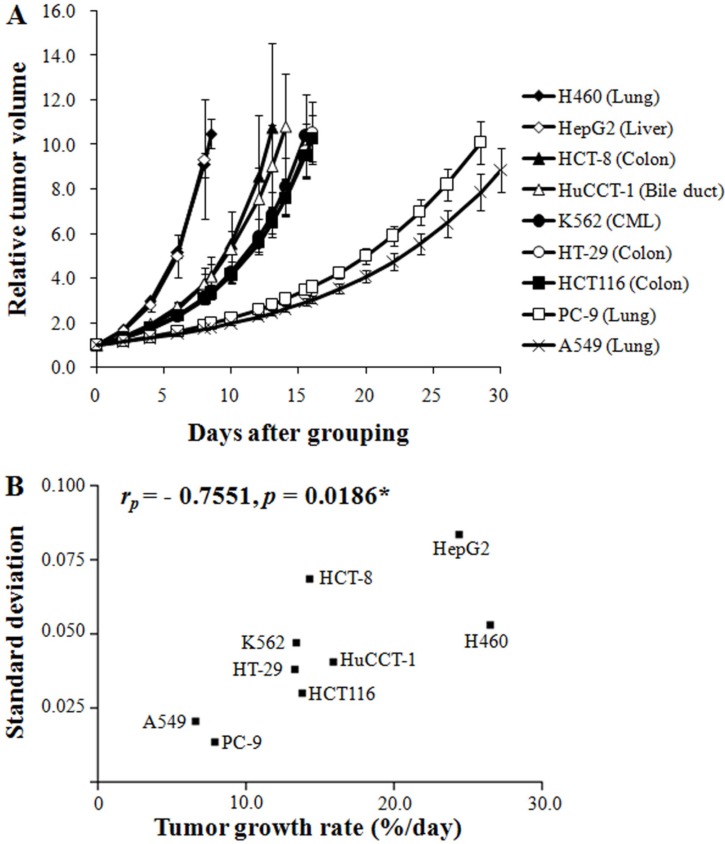
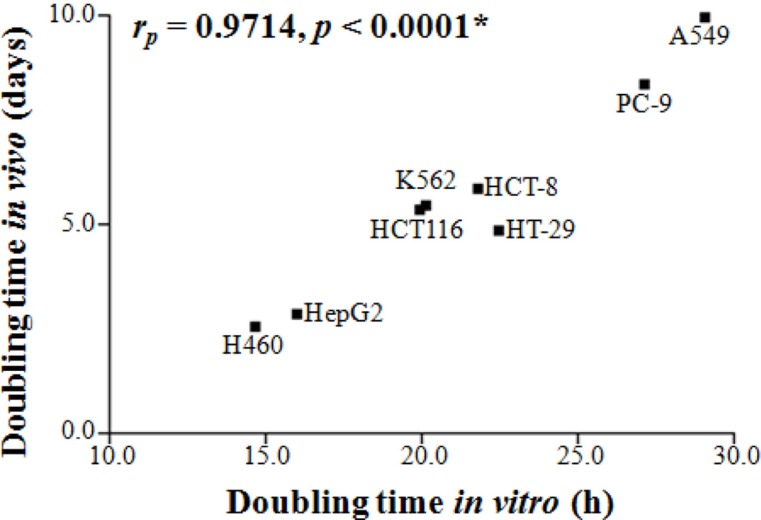
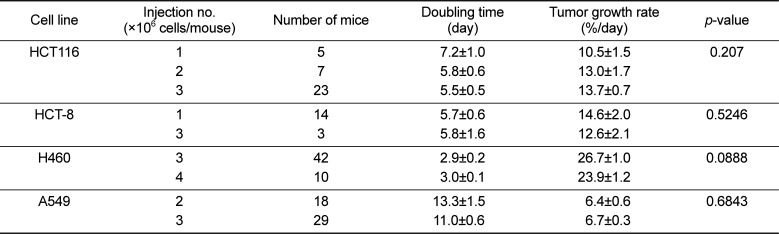
Figure 1A shows the growth pattern of the nine xenograft models. The volumes of the xenografts at various times of growth were normalized to that at day 0. The volumes of the xenografts were fitted to the exponential growth equation, and the growth rate of the xenografts was calculated. The growth rate of different xenografts varied markedly. Notably, the growth rate of the H460 lung cancer xenografts was much faster than those of the A549 and PC-9 lung cancer xenografts, indicating that the growth rate of xenografts is independent of the histological type of the xenograft. The magnitudes of standard deviation of the TGR were larger for fast-growing xenografts than for slow-growing xenografts (rP=0.7551, P=0.0186; Figure 1B). The xenograft volume doubling time (days) or TGR (% increase/day) was not affected by the number of tumor cells injected (Table 1). On the other hand, as shown in Figure 2, the volume doubling time of the xenografts was positively correlated with the cell population doubling time in vitro, that is, a slow proliferation rate in vitro translated to a slow xenograft growth rate in vivo (rP=0.9714, P<0.0001).
Relationship between radiosensitivity and characteristics of the cell lines
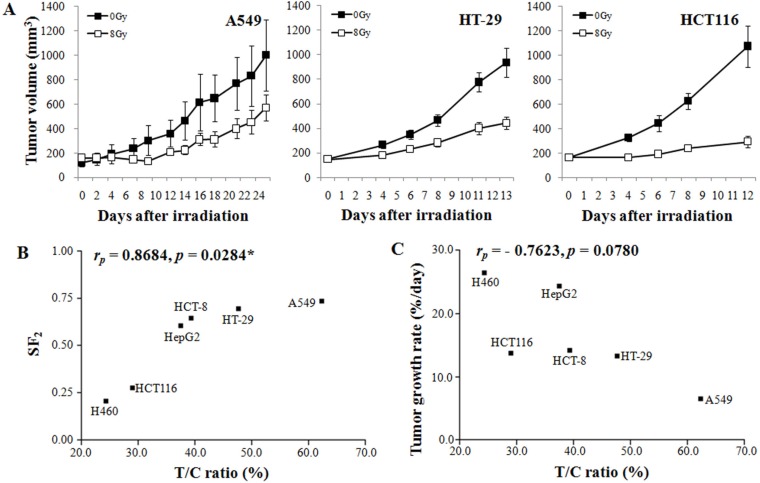
Figure 3A shows three representative examples of radiation-induced growth suppression of xenografts. The growth suppression of HCT116 colon cancer xenografts by 8 Gy irradiation was much greater than that of HT-29 colon cancer xenografts or A549 lung cancer xenografts. As shown in Figure 3B, the T/C ratio (radiosensitivity in vivo) was positively related to the radiosensitivity of the cancer cells in vitro, as judged from the surviving fraction after irradiation with 2 Gy (SF2; rP=0.8684, P=0.0284). Figure 3C shows the relationship between the growth rate and radiosensitivity of the xenografts. Although the T/C ratio showed a tendency to decrease as the TGR increased, the correlation between these factors was not statistically significant (P=0.0780).
Discussion
Human cancer xenografts have been shown to be rather valuable and useful for the screening of anticancer drugs, identification of therapeutic targets, identification of biomarkers, and preclinical testing of various treatments, including radiotherapy [2345]. However, essential information for the effective use of xenografts has not been fully delineated. In the present retrospective study, we attempted to identify the factors that affect the growth pattern of human cancer xenografts in nude mice. Moreover, we evaluated the effect of these factors on the response of xenografts to ionizing radiation.
As shown in Figure 1A, the growth rate of the nine different xenograft models varied significantly. Interestingly, the growth rates of xenografts with the same histological origin were profoundly different. For example, the growth rates of the PC-9 and A549 lung cancer xenografts were much slower than that of the H460 lung cancer xenografts. This result indicated that the growth rate of xenografts is not related to the histology of the xenograft. On the other hand, the growth rate of xenografts was found to be positively related to the proliferation rate of cancer cells in vitro (Figure 2). It may be noted here that the growth rate of tumors is controlled by various cellular and pathophysiological processes such as cell cycle time, growth fraction, and cell loss factors [6789]. Accordingly, xenografts derived from cells with a short cell cycle time or fast proliferation rate in vitro grew faster than xenografts derived from cells with a long cell cycle time or slow proliferation rate in vitro (Figure 2).
The large variations in the growth kinetics and radio-response among the nine xenografts may be attributed to various causes. The survival and proliferation of tumor cells in vivo are directly dependent on sufficient nutritional supply through tumor vascular networks. The vascularity and blood circulation in tumors vary greatly depending on the tumor type, and they gradually deteriorate as the tumor volume increases [101112]. Decline in the supply of nutrients and oxygen essential for the survival of tumor cells due to deterioration of tumor vascularity inevitably leads to a decrease or complete cessation of tumor cell proliferation, thereby reducing the “growth fraction.” Further decline in nutritional supply may lead to tumor cell death or “cell loss,” thereby slowing down tumor growth. Although it is clear that the proliferation rate or cell cycle time significantly influenced the growth rate of xenografts in the present study, it is unclear whether differences in “growth fraction” and “cell loss” were responsible for the marked variance in the growth rate among the different xenograft lines. Cell loss may also occur because of other causes such as immune surveillance against the tumor cells. However, the effect of immune reactions against xenografts grown in athymic nude mice may be insignificant.
A potentially important observation relevant to radiotherapy in the present study was that the intrinsic radiosensitivity of cancer cells, as determined with the SF2 method in vitro, was positively related to the radio-response of the xenografts of the cancer cells (Figure 3B). Generally, mutation of p53 or overexpression of Rad51 occurs in high grade radioresistant tumors. Mutation or deletion of p53 correlates with high levels of Rad51 through p53-induced transcriptional repression of Rad51 gene and abrogation of Rad51 polymerization on DNA. Accordingly, radioresistance correlates with p53 mutation or overexpression of Rad51 [1314]. Additionally, activation of the PI3K/Akt pathway is associated with radiation resistance since this pathway related to increase cell proliferation, invasion and upregulation of hypoxia [151617]. Especially, varying fractions of cancer cells in tumors or xenografts are hypoxic because of insufficient oxygen supply through poorly developed tumor vascular networks, and it is well known that the tumor hypoxia greatly diminishes the response of tumors or xenografts to ionizing radiation [1819202122]. The volumes of all the xenografts used in the present study were relatively uniform. Therefore, it is probable that the degrees of hypoxia in and the magnitude of the influence of hypoxia on the response of xenografts to radiation were relatively similar among the xenografts. We may then conclude that the intrinsic radiosensitivity of cancer cells (SF2) played a major role in the differential response of the different xenografts to radiation.
Tissues with high mitotic activity are more radiosensitive than tissues with low mitotic activity. Therefore, fast-growing tumors are more radiosensitive than slow-growing tumors [2324]. As shown in Figure 3B, the xenografts with faster growth rate were generally more radiosensitive, although the correlation was not statistically significant.
In conclusion, the growth rate of human xenografts grown in athymic nude mice was independent of histological type and origin of the cancer cells, and was positively related to the proliferation rate of the cancer cells in vitro. The intrinsic radiosensitivity of cancer cells, as determined using in-vitro culture, was the major factor that determined the radiosensitivity of the xenografts, as assessed by monitoring radiation-induced growth delay. Xenografts exhibiting high growth rates were more radiosensitve than those with low growth rates, although this correlation was not statistically significant.
 XML Download