

 PDF
PDF ePub
ePub Citation
 Print
Print


Rheumatoid arthritis (RA) is a chronic inflammatory disease characterized by persistent synovitis, systemic inflammation and autoantibody production, resulting in joint destruction and chronic pain [1].
Collagen antibody-induced arthritis (CAIA) is a mouse RA model that can be used to investigate pathogenic mechanisms and to screen candidate therapeutic agents [2]. In this model, the transfer of a collagen type II-specific monoclonal antibody cocktail induces an acute form of arthritis [3]. Due to its enhanced arthritogenicity, the cocktail is capable of inducing a more consistent and severe arthritis and is an effective reagent for inducing arthritis in various strains of CAIA low-responder mice [4].
For qualification and/or quantification of arthritis progression, pathological lesions must be visualized in vivo. Bioimaging may be able to detect biological alterations during disease progression and provide quantitative results and is thought to reduce the number of animals required per experiment [5]. Furthermore, due to the coupling of fiber-optic and micro-optic components, some imaging techniques are now integrated with a wide range of imaging devices [6]. One such bioimaging technique involves optical imaging using near infrared (NIR) agents, and has advantages over other techniques for the detection of biomolecules in living animals [7].
Sulfasalazine has been reported to block the release of glycosaminoglycans and collagen fragments from cartilage and to reduce the total collagen activity in osteoarthritis [8]. In addition, prednisolone has been shown to have therapeutic potential of RA by reduction of cartilage destruction [9].
Because there are no reports on the therapeutic potential of sulfasalazine or prednisolone in a CAIA model, this study aimed to examine the therapeutic potential of sulfasalazine and prednisolone in a mouse CAIA model using fluorescent bioimaging and micro-computed tomography (micro-CT). Moreover, the accuracy and effectiveness of fluorescent bioimaging and micro-CT were compared with those of conventional histopathological examination.
Materials and Methods
Induction of arthritis
Male BALB/c mice (6 weeks old) were obtained from Nara Biotech Co. Ltd. (Seoul, Korea) and acclimated for 7 days before study initiation. The mice were kept in a temperature-controlled environment (22±3℃), in 55±5% relative humidity, and with a 12-h light/dark cycle. The mice were fed unrefined chlorophyll-containing ingredients, an alfalfa-free diet (Harlan Laboratories, Inc., Madison, WI), and filtered water ad libitum.
Twenty-five mice were randomly divided into five groups: group 1 (G1): control, group 2 (G2): probe control, group 3 (G3): CAIA, group 4 (G4): CAIA+sulfasalazine, and group 5 (G5): arthritis induced+prednisolone. An anti-type II collagen 5-clone antibody cocktail (Chondrex, Redmond, WA) (2 mg/mouse) was injected intravenously on day 0, and lipopolysaccharide (Chondrex) (50 µg/mouse) was injected intraperitoneally on day 3 to G3, G4, and G5 mice. Mice in G4 and G5 were given oral with prednisolone (10 mg/kg, twice daily; Sigma, Saint Louis, MO) and sulfasalazine (100 mg/kg, once daily; Sigma), respectively, from day 4 to 7. The mice in G1 and G2 received equal volumes of 0.9% saline for an equivalent time to serve as controls. Body weight and paw thickness were recorded in all animals for during the experiment. This study (NSU-14-10) was approved by the animal experiment committee of Namseoul University based on the Animal Protection Act.
Fluorescent bioimaging
Mouse hair was removed by treatment with Veet cream before undergoing fluorescent bioimaging. On day 5, mice in G2, G3, G4, and G5 were injected intravenously with OsteoSense® 680 EX (PerkinElmer, Waltham, MA) at a dose of 2 nmol/100 µL per mouse. The mice in G1 received equal volumes of 0.9% saline. Fluorescent bioimages were taken 24 and 48 h after fluorescent probe treatment by an IVIS Lumina Series III (PerkinElmer) under anesthesia with avertin (2.2.2-tribromoethanol; Sigma).
All mice were killed 7 days after collagen cocktail treatment, and the hind knee joints were fixed in 10% neutral phosphate-buffered formalin before histopathological analyses were performed.
Micro-CT analyses
The quantitative analysis of the hind knee joints was performed using a micro-CT system (Skyscan1173; Bruker, Kontich, Belgium). The specimens were scanned using a micro-CT with an X-ray source of 75 kV/106 µV, and pixel size of 9.94 µm using an aluminum 1.0-mm filter. After micro-CT scanning, cross-sectional slices were reconstructed and each scan result was reconstructed using the 0 to 0.03 threshold values to distinguish bone and air with NRecon software Ver.1.6.9.16 (Bruker). Three-dimensional analysis was performed using CT Analyser Ver. 1.14.4.1 (Bruker).
The fraction of bone volume, percent bone volume, trabecular number, trabecular thickness, bone surface/bone volume ratio, trabecular separation and bone mineral density were calculated using the built-in software of micro-CT.
Histopathological observation
The hind knee joints were fixed in 10% phosphate-buffered formalin for 24 h and decalcified in 14% EDTA-glycerol for 14 days at room temperature. Samples were routinely processed and embedded in paraffin, and 4-µm sections were stained with hematoxylin and eosin (H&E) for histopathological examination. Safranin O-fast green staining was used to stain cartilage.
Histopathological analysis of joints was performed for cartilage degradation, bone damage, infiltration of inflammatory cells, synovial proliferation, and degeneration/necrosis.
Statistical analysis
Statistical analyses were performed using GraphPad Prism 6 (GraphPad Software, La Jolla, CA). All data were analyzed using Dunnett's multiple comparison test following one-way analysis of variance and Student's t-test. P-values of <0.05 were considered statistically significant.
Go to : 
Results
Induction of arthritis
Body weight showed no statistical significance among the groups during the experiment (data not shown). Normal paw appearance was seen in G1 and G2. However, paw edema was observed in G3 in a time-dependent manner after the treatment with anti-type II collagen 5-clone antibody cocktail. Edema was less severe in G4 and G5 than in G3 (Figure 1A). There were no changes in paw thickness in G1 or G2. However, G3 paw thickness increased in a time-dependent manner. The paw thickness of G4 and G5 trended toward a decrease compared with G3, but was not statistically significant (Figure 1B).
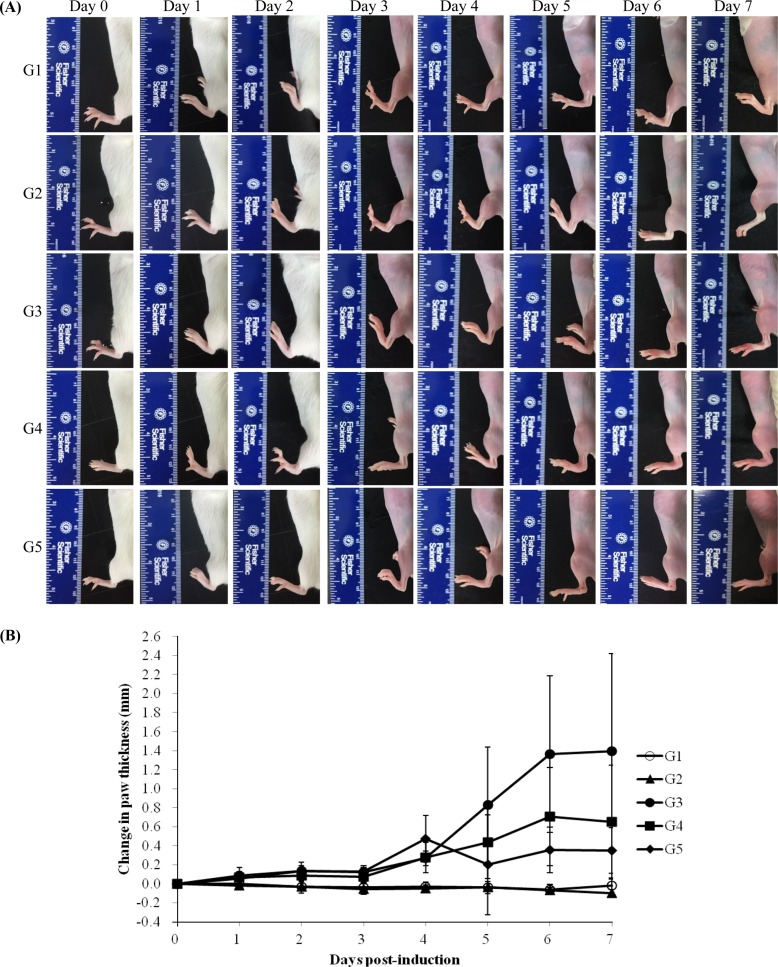 | Figure 1Measurable morphological changes were determined by paw thickness measurement. (A) Macroscopic view of joint in mice. G1 as control, G2 as probe control, G3 as CAIA induced, G4 as CAIA+Sulfasalazine and G5 as CAIA+ Prednisolone. Note the normal macroscopic structure of the joint of mice in G1 and G2. However, in G3, the paw thickness was increased in mice treated with anti-type II collagen 5-clone antibody cocktail and it was decreased in G4 and G5 compared to G3.
|
Fluorescent bioimaging
In vivo near-infrared fluorescence bioimaging of knee joint of normal or CAIA mice after intravenous injection of fluorescence probe was shown in Figure 2A. Analyses of fluorescence bioimaging showed no fluorescence in G1. Fluorescence intensity was observed in G2; however, it was higher in G3 at 24 and 48 h after fluorescence probe treatment. G4 and G5 both showed a decreased tendency for positive fluorescence (Figure 2B, 2C).
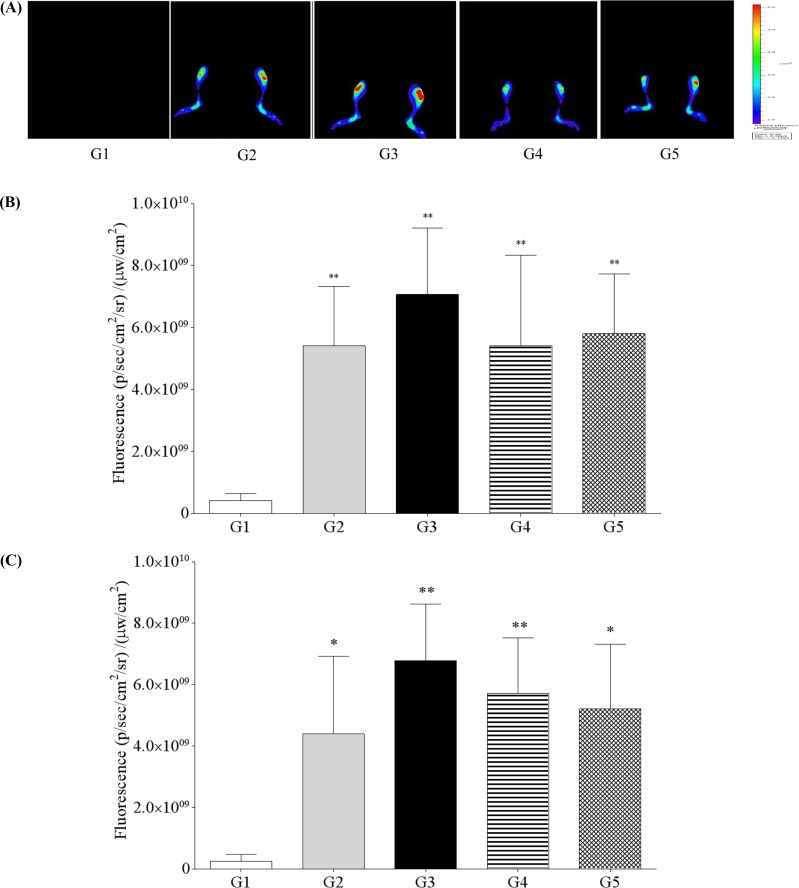 | Figure 2In vivo near-infrared fluorescence (NIRF) bioimaging of knee joint of normal or collagen antibody-induced arthritis (CAIA) mice after intravenous injection of fluorescence probe. (A) G1 as control, G2 as probe control, G3 as CAIA induced, G4 as CAIA+Sulfasalazine, G5 as CAIA+Prednisolone; Fluorescence intensity in knee joint at 24 h (B) and 48 h (C) after fluorescence probe treatment. *,**Significant different from G1 (P<0.05 , P<0.01, respectively).
|
Micro-CT analyses
Micro-CT analyses showed that G1 and G2 joint surfaces had a normal articular appearance, while the joint surfaces from G3 animals had a rough and irregular articular appearance, with a diffuse lesion pattern on the articular surface. However, the number of lesions was lower in both G4 and G5 than in G3 (Figure 3). Quantitative analyses of micro-CT images showed that bone volume, percent bone volume, and bone mineral density were lower in G3 and G4 than in G2 (P<0.05). However, other parameters such as trabecular number, trabecular thickness, bone surface/bone volume ratio, and trabecular separation were not significantly altered (Figure 4).
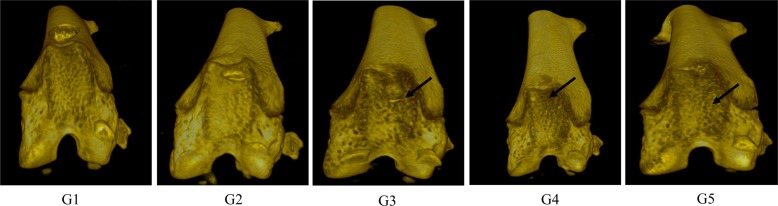 | Figure 3Micro-CT image of hind knee joint in mice. (A) G1 as control, (B) G2 as probe control, (C) G3 as CAIA induced, (D) G4 as CAIA + Sulfasalazine, (E) G5 as CAIA + Prednisolone. Note the joint surfaces of G1 or G2 as normal articular appearance. However, those of G3 showed rough and irregular articular appearance and it was decreased in G4 and G5 compared to G3 (arrow).
|
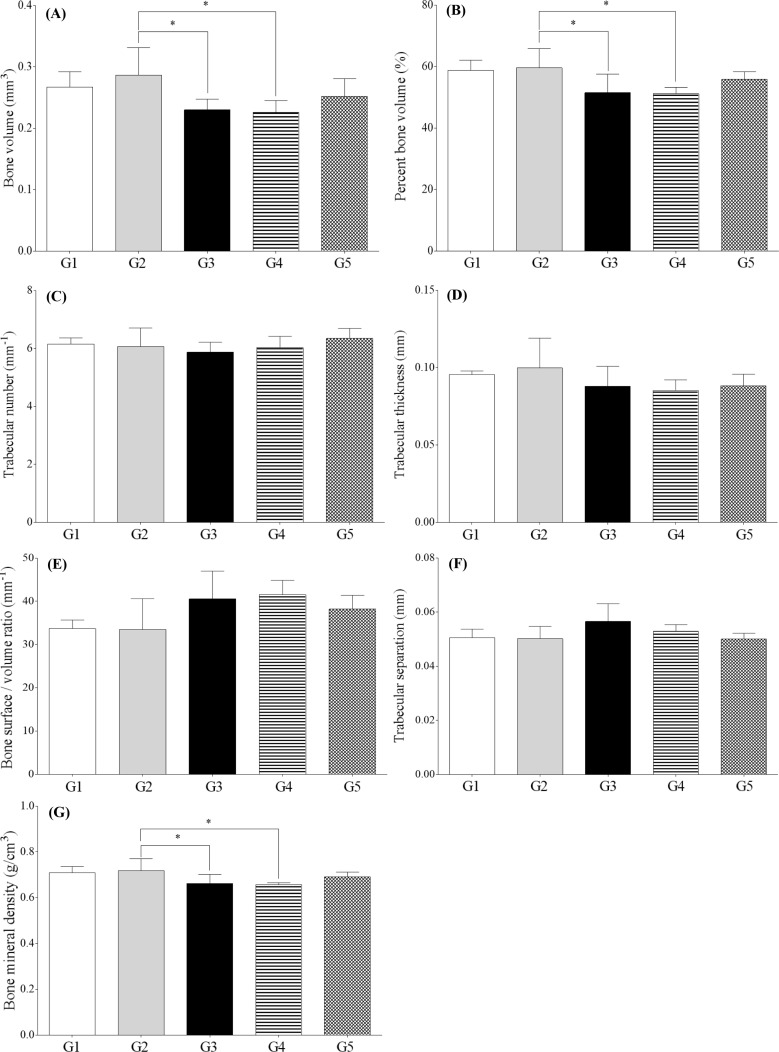 | Figure 4Micro-CT analysis parameters of the hind knee joint of collagen antibody-induced arthritis mice. (A) Bone volume; (B) Percent bone volume; (C) Bone surface/bone volume ratio; (D) Trabecular thickness; (E) Trabecular number; (F) Trabecular separation; (G) Bone mineral density; G1 as control, G2 as probe control, G3 as CAIA induced, G4 as CAIA+ Sulfasalazine and G5 as CAIA+Prednisolone. *Significantly different from G2 (P<0.05).
|
Histopathological observation
Histopathological examination of the hind joints showed that no cartilage destruction or inflammation in G1 or G2 mice. In G3 mice, the destruction of cartilage and bony structures was observed on the joint articular surfaces. In addition, synovial hyperplasia and inflammatory cell infiltration, mainly neutrophils, was observed on the articular surface of the joints from G3 mice. The number and severity of these lesions was lower in G4 and G5 mice than in G3 mice (Figure 5).
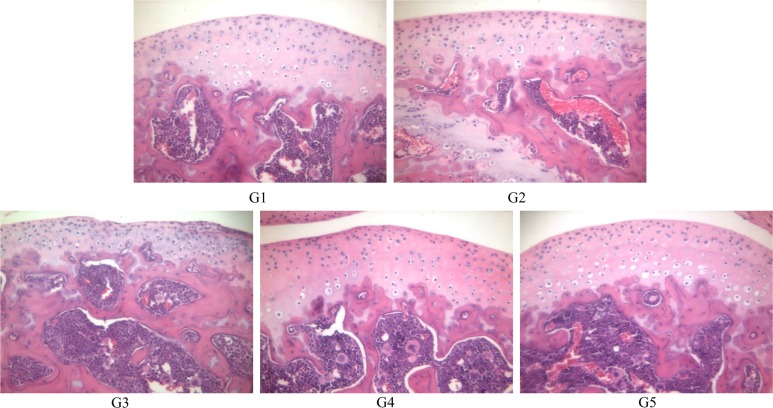 | Figure 5Histopathological examination of hind knee joint of mice. (A) G1 as control, (B) G2 as probe control, (C) G3 as CAIA induced, (D) G4 as CAIA+Sulfasalazine, (E) G5 as CAIA +Prednisolone. Note the normal microscopic structure of the joint of untreated control mice (A) and probe control mice (B). However, joint destruction is remarkable in the joint of mice treated with collagen antibody in G3. Note the destruction of cartilage and bony structure (arrow) and infiltration of inflammatory cells (arrow head) and these lesions were decreased in G4 and G5 compared to G3. Hematoxylin & eosin staining of paraffin embedded sections from the hind joint from mice, Magnification, ×200.
|
Safranin O-fast green staining revealed normal (red color) joint structures in G1 and G2 animals. However, some chondrocytes showed slight degeneration with very low cartilage staining in G3. The staining intensity was greater in G4 and G5 than in G3 (Figure 6).
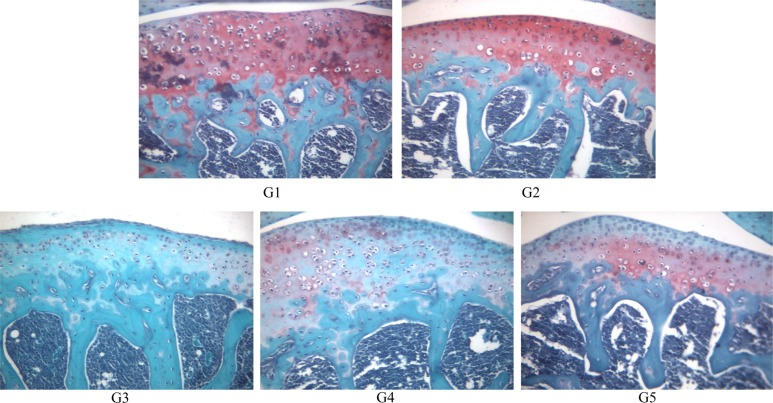 | Figure 6Safranin O-fast green staining of joint of mice. (A) G1 as control, (B) G2 as probe control, (C) G3 as CAIA induced, (D) G4 as CAIA+Sulfasalazine, (E) G5 as CAIA+ Prednisolone. Note the normal cartilage staining of the joint of mice in G1 and G2. In G3 cartilage staining is remarkably reduced in the joint of mice, however it shows moderate staining in G4 and G5. Safranin O-fast green staining of paraffin embedded sections from the hind joint from mice, Magnification, ×200.
|
Go to :
Discussion
In this study, sulfasalazine and prednisolone treatment reduced acute RA in mice. In addition, fluorescent bioimaging and micro-CT images provided adequate information for assessing arthritis lesions, and the results generally agreed with the conventional histopathology assessment.
Animal models of arthritis are used to study the pathogenesis of disease and evaluate potential antiarthritic drugs for clinical use [10]. In this study, arthritis lesions occurred from 5 to 7 days after collagen antibody injection, and an acute RA model was used for the rapid screening of therapeutics. The CAIA model is a model of an acute arthritis, represents the rapid onset of disease, and usually has a short experimental time period [2]. In contrast, CIA model represents the gradual onset of disease, and it usually requires an the experimental period of 4 weeks to show hypertrophy of the synovial lining and longer periods to show fibrovascular pannus formation [11]. The choice of the most proper model should be based on adequate research, and the biology of the animal model should be compared with the intended therapeutic target molecule.
Bioimaging enables the detection and visualization of biological processes at various levels of the molecule, organelle, cell, tissue, organ, and whole body and allows for in vivo examination of arthritic lesions [12]. In this study, fluorescence intensity was observed in G2 mice; however, the G3 mice showed a greater increase in intensity than in G2 at 24 and 48 h after OsteoSense® 680 EX treatment. Furthermore, G4 and G5 mice had lower fluorescent intensity than that of G3 mice. Fluorescent bioimaging works by emitting light through hydroxyapatite, which is specific to cell damage, and reflects molecular and cellular responses. As hydroxyapatite (HA) is a mineral form of calcium apatite and is the major mineral product of osteoblasts, the OsteoSense® 680 EX imaging agents was designed to bind with high affinity to HA. This fluorescence-based imaging has some limitations regarding the characterization of lesions due to the high background probe levels. Although a near-infrared fluorescence imaging can provide tissue detection and potential quantitative readouts up to absolute picomoles of agent fluorescence [13], in this study, a high background level of fluorescence was observed in the probe control, suggesting that the technique does have some limitations for evaluating therapeutics. To achieve higher fluorescence signals from arthritic joints, it should be remembered that a preferential increase in fluorescence intensity can be attributed to selective accumulation of the fluorescence probe in arthritic joints. Further studies are needed to develop specific probes to detect disease progression and cartilage damage in arthritis.
In this study, quantitative analyses of micro-CT images showed that trabecular bone volume, percent bone volume, and bone mineral density were decreased in G3 mice. Furthermore, the joint surfaces of G3 mice revealed articular surface degeneration and bony structure alteration. These results agree with the concurrent with histopathological examination results. H&E and Safranin O staining revealed cartilage and bony destruction in the articular surface of G3 mice; however, the severity and number of lesions was lower in G4 and G5 mice.
Because of quantification limitation, particularly with the three-dimensional visualization of lesions using conventional histopathological examination, new techniques are needed. One such new technique, optical coherence tomography (OCT), was introduced to obtain stereoscopic images [14]. This technique has many advantages for three-dimensional imaging and can provide quantitative data of pathological lesions. However, OCT is not able to provide cellular or molecular detail for most tissues. More studies are needed to determine the potential use of OCT for examining arthritis lesions.
Overall, these results suggest that sulfasalazine and prednisolone treatment can reduce acute RA in mice. Furthermore, fluorescent bioimaging and micro-CT image analyses allowed for the quantification and qualification of arthritic lesions in mice.
Go to :
 XML Download