

 PDF
PDF ePub
ePub Citation
 Print
Print


Genetic background is considered to be an intrinsic research variable in biomedical research [7]. A proper experimental design takes into consideration the species, strain, and sub-strain, whose genetic background likely has an influence on the experimental outcome. Based on the genetic background, the animals used in the research are broadly categorized into inbreds, outbreds, hybrids, recombinant hybrids, mixed breeds and animals of unknown genetic origin. Among these, inbreds are used extensively to provide a uniform genetic background which ensures reproducibility with small numbers of animals. Outbred animals offer a varied genetic background which is likely due to less rigorous genetic characterization and genetic quality control. Outbreds often lack complete genetic information at the individual level that may lead to undetected significant genetic variation within the sample as well as genetic drift within the population over time [26]. Therefore, use of outbreds increases phenotypic variability, reduces statistical power of the experiment and makes interpretation of experimental results more challenging [1021].
The Sprague-Dawley (SD) is an outbred rat, first generated by Robert S. Dawley during the 1920s by breeding Wistar rats to hybrids of laboratory derived and wild stocks. In 1950, Charles River Laboratories (CRL) acquired a breeding stock and developed a new line with better microbial status by caesarian derivation [22]. The Harlan (HAR) laboratory purchased the Sprague Dawley Company in the 1980s and has maintained its own Sprague-Dawley stock. Although both the CRL and HAR Sprague-Dawley rats were developed from the original SD company stock, the genetic quality of the populations may have drifted over time due to difference in the breeding practices.
Sprague-Dawley outbreds are used extensively to develop animal models of human conditions such as diabetes, obesity, cancer and cardiovascular diseases [151112192023]. However, the use of such genetically heterogeneous outbred rodents in the development of animal models of human disease may introduce variation in disease manifestation as well as response to therapeutic intervention. Previous studies demonstrated a superiority of the inbred Lewis rats over the outbred SD rats in a surgical model of heart failure, with higher predictable mortality and larger infarct size in the Lewis rats. The difference was attributed to branching and positioning of the left ascending artery which showed more variation in SD (outbred) compared to the Lewis (inbred) rats [13]. The higher predictability and lesser variability may be attributed to the uniform genetic background of inbreds. Additionally, a difference in responses to acute myocardial infarction was demonstrated between the outbred Wistar rats obtained from different sources [15]. Another study demonstrated lack of susceptibility of CRL female Sprague Dawley CD (CDR IGS) rats to DMBA (7,12-Dimethylbenz(a)antharcene)-Induced Mammary tumor development, an anomaly from the general susceptibility of most rats [8].
The differential susceptibility of outbred lines obtained from various vendors has been observed in the field of neurophysiology and behavior. Rodents obtained from different vendors showed varied susceptibility to learned helplessness behavior with CRL rats demonstrating 55% and Sasco Inc rats with 9% susceptibility [19]. A marked difference in susceptibility were observed in Swiss-Webstar outbred mice, purchased from various vendors, in the development of an animal model for Parkinson's disease [9]. Similarly, variation in gene splicing was observed in the peptidylglycine alpha-amidating monooxygenase transcript in the rat pituitary of CRL SD rats and HAR SD rats [3].
In this study, we characterize the growth patterns of Sprague-Dawley rats obtained from two different vendors, CRL and HAR.
Materials and Methods
Study design
The study data was obtained in two cohorts (Table 1). Cohort 1 was designed to determine if there was a difference in the weight gain between the two vendor groups. Cohort 2 verified the weight gain difference and investigated potential causes for the difference in the weight gain.
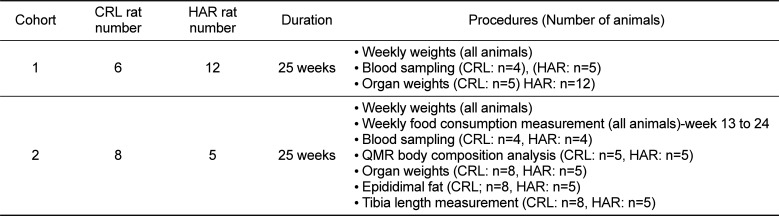
Table 1
Study design
![]()
Cohort 1: Cohort 1 compared weekly weight gain between 6 Charles River (CRL) rats and 12 Harlan (HAR) rats from 6 weeks to 24 weeks of age. The animals were euthanized at approximately 25 weeks of age. At the end of the study period, blood was collected for hematology and clinical chemistry and organ weights were measured during necropsy.
Cohort 2: The second cohort compared weight gains between 8 CRL rats and 5 HAR rats from 6 weeks of age to 24 weeks of age. Body composition was determined prior to euthanasia. Animals were euthanized at approximately 25 weeks of age. At termination, blood was collected for hematology and clinical chemistry; and organ weights and tibial lengths were measured.
Animals source
The animal studies were performed according to an IACUC approved protocol.
Male 5 week old Sprague Dawley rats from Charles River (CRL:CD(SD) originating from Portage, MI and Harlan Hsd:Sprague Dawley (SD) SD rats originating from Haslett, MI, Barrier 206, were housed in an AAALAC accredited, Specific Pathogen-Free laboratory animal facility. The rats' sentinels were negative for the most common rodent diseases. The Sprague Dawley rats from Charles River and Harlan were chosen because it is a commonly used rat and purchased frequently the above two vendors. Males are the most preferred ones over the females for studies.
Husbandry
A dedicated rodent room was maintained at temperatures between 68 and 79°F with photoperiod of 14 hours light/10 hours dark and humidity controlled between 30-70%. The rats were housed in individually ventilated cages (Lab Product) receiving approximately 45 air exchanges per hour. They were bedded with irradiated corncob bedding (Harlan), and provided Teklad Global 2918C irradiated rat diet (18.6% protein, 3.5% crude fiber, 6.2% Fat) ad libitum and Hydropak pouches. The cages were enriched with Nyla bones, hiding tubes (Bioserve) and lofts (Lab Product). Singly housed rats were housed in "shoebox" cages (128 square inches) and moved to larger (256 square inches) when they reached about 500 gm. Cage change-out for the rats was performed once weekly primarily by one animal care attendant for each cohort.
Body weights
Body weights for both cohorts were obtained once a week from 6 to 24 weeks of age. A gram scale was calibrated before the weight measurements according to facility standard operating procedures.
Feed consumption
Weekly food consumption was measured for Cohort 2 rats between 13 and 24 weeks of age. Feed remaining in the dirty cage at change-out was collected and weighed by the animal care technician. The feed intake was calculated by deducting the amount of feed left in the feeder from the initial known amount under the assumption that all the animals "wasted" approximately equal quantity of feed each week.
Measurement of Body composition
Direct measurement of body composition (n=5 for each group) was performed using a quantitative magnetic resonance (QMR) body composition analyzer (EchoMRI, Houston, Tx, USA) as previously described [16]. The analyzer and scale were calibrated prior to each use. The QMR measurements were performed on individual conscious animals by placing each animal into a thin-walled plastic cylinder which was then placed into the machine. The rats were briefly subjected to a low-intensity (0.05 Tesla) electromagnetic field to measure fat, lean mass, free water, and total body water.
Blood collection
Under isoflurane sedation, blood was collected for hematology and clinical chemistry prior to euthanasia. Approximately 4-5 cc of blood was obtained by direct cardiac puncture using a 22 gauge needle and divided into 3 cc EDTA and 2 cc red top serum tubes. The blood and serum were shipped to a commercial diagnostic lab for analysis (Marshfield Laboratories, Wisconsin).
Necropsy
Following blood collection, the animals were deeply sedated with Isoflurane and then placed in a pre-filled carbon dioxide box for euthanasia. Gross necropsy was performed and organ weights including heart, lungs, liver, kidneys, spleen, adrenal glands, and testicles, were obtained for both cohorts. Weights for left and right epidydimal fat and tibial lengths were obtained for Cohort 2 rats. Tibial measurements were obtained using digital calipers.
Statistical analysis
Data was analyzed for trends using unpaired, two tailed T tests and calculated standard deviations. Error bars within graphs represent the standard deviation of the sample mean. P value<0.05 was considered significant throughout the study.
Go to : 
Results
Weekly weight gain between the groups
In order to determine if the SD rats from two different vendors showed a difference in weight gain, weekly weights were recorded from CRL and HAR SD rats (Cohort 1) from 6 to 24 weeks of age. There was no difference between the groups at 6 weeks. Both the groups gained weight steadily at the same rate until 9 weeks age. At 10 weeks of age, weight gain divergence became significant with CRL rats gaining more weight compared to that of HAR rats. This trend continued until the end of study period with an average weight of 588.7±45.5 grams for CRL and 466.91±22.5 grams for HAR at 24 weeks (Figure 1A). At the end of 24 weeks, the CRL rats were 21% heavier than the HAR rats.
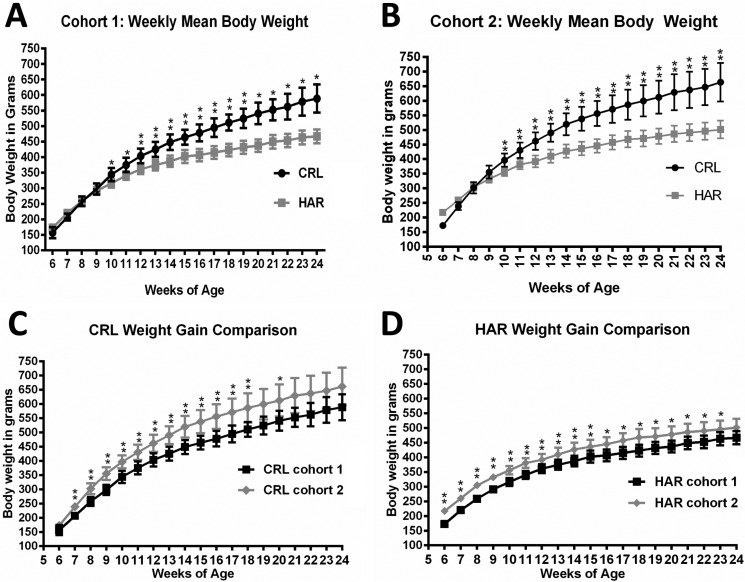 | Figure 1(A) Weekly mean body weight comparing CRLSD rats and HAR SD rats in Cohort 1 at 6 to 24 weeks of age: (N=6-12). *P≤0.05 **P≤0.01 (B) Weekly mean body weight comparing CRL SD rats and HAR SD rats in Cohort 2 at 6 to 24 weeks of age: (N=5-8). *P≤0.05 **P≤0.01 (C) Weekly mean body weight comparing CRL SD rats in Cohort 1 and Cohort 2 at 6 to 24 weeks of age: (N=6-8). *P≤0.05 **P≤0.01 (D) Weekly mean body weight comparing HAR SD rats in Cohort 1 and Cohort 2 at 6 to 24 weeks of age: (N=5-12). *P≤0.05 **P≤0.01
|
In order to confirm the findings observed in Cohort 1 and determine the contributing factors for the difference in weight gain, a second cohort was established with CRL and HAR rats. The weight gain findings in Cohort 2 were similar to the trends observed in Cohort 1.There was no significant difference in weights between the groups at 6 weeks, and the rats gained weight at the same rate until 9 weeks age. At 10 weeks of age, weight divergence became significant with CRL rats gaining more weight compared to the HAR rats, a trend which continued until the end of study period with an average weight of 663.4±66.0 grams for CRL and 501.4±30.2 grams for HAR at 24 weeks (Figure 1B). At the end of 24 weeks, the CRL rats were 24.2% heavier than the HAR rats.
The mean body weights of CRL Cohort 2 rats were 12% heavier at 24 weeks compared to the CRL Cohort 1 rats (Figure 1C). The mean body weights of HAR Cohort 2 rats were 7% heavier at 24 weeks compared to HAR Cohort 1 rats (Figure 1D). The difference in the weights at 24 weeks between Cohort 1 and Cohort 2 rats was likely due to sample variation. Also, the variation in the weights (standard deviation; SD) among the animals within the cohort at each time-point was less in the HAR group (SD of 22.5 and 30.2 for Cohort 1 and 2 respectively) compared to the CRL group (SD of 44.5 and 66.0 for Cohort 1 and 2 respectively).
Feed Consumption
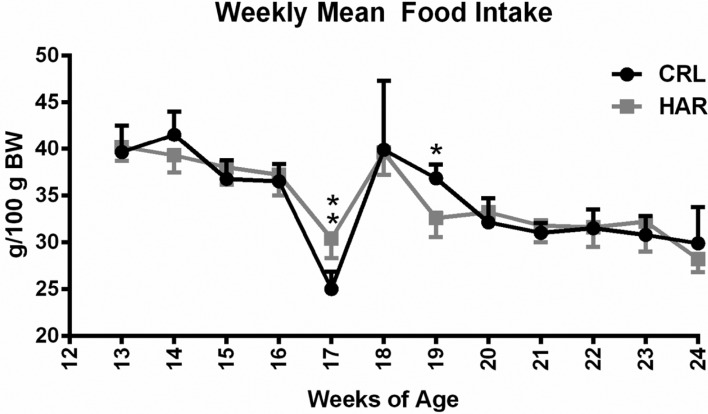
In order to determine if the difference in the weight gain observed between the CRL and HAR groups rats in Cohort 1 was due to difference in the feed intake, the rats in Cohort 2 were monitored for feed intake once a week from 13 to 24 weeks of age (Cohort 2). There was no statistically significant difference in the amount of food consumed/100 grams of body weight (Figure 2) at most of the time points. Considering the trends of the time points, it was concluded that the difference in the weight gain between the two groups was not due to difference in the feed intake.
Body mass composition
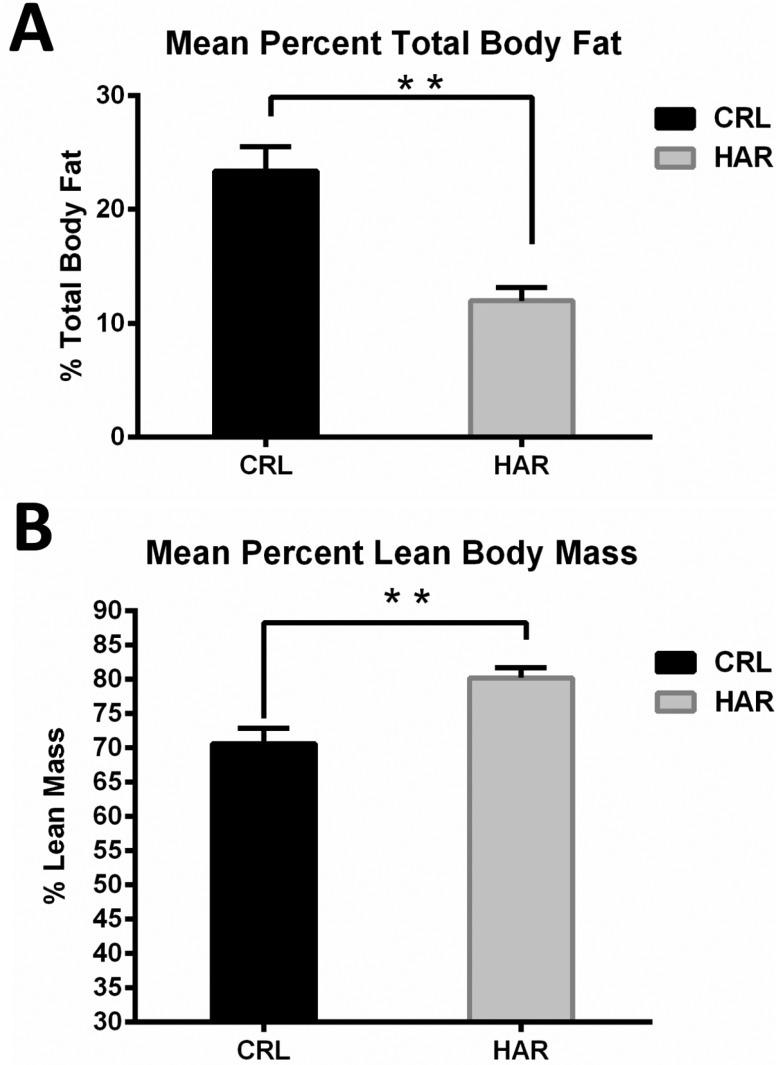
In order to determine, if the difference in the weight gain was due to difference in the amount of the adipose tissue in the body, body mass composition was determined using quantitative magnetic resonance. At termination, the percentage of body fat in the CRL rats was 49.6% higher compared to the HRL rats (Figure 3A). The lean body percentage for HAR rats was 12% more than the CRL rats (Figure 3B). Therefore, it was concluded that the heavier weight of the CRL rat was due to significantly higher percentage of body fat.
Organ weights and Tibial length
In order to determine, if the difference in body fat mass between the two groups was due to differences in organ weights, the organ weights were measured during necropsy. Organ weights were obtained for all rats of each cohort at necropsy and examined as a percent of total body weight.
Differences that were consistently noted in both cohorts were gross liver weights and testicular weights. Gross liver weights of CRL rats were larger than HAR rats by 16.5% greater in Cohort 1 and 26.5% greater in Cohort 2 (Figure 4A). However, when the liver weights per 100 gram body weight were calculated (Figure 4B), there was no statistically significant difference between the CRL and the HAR rats.
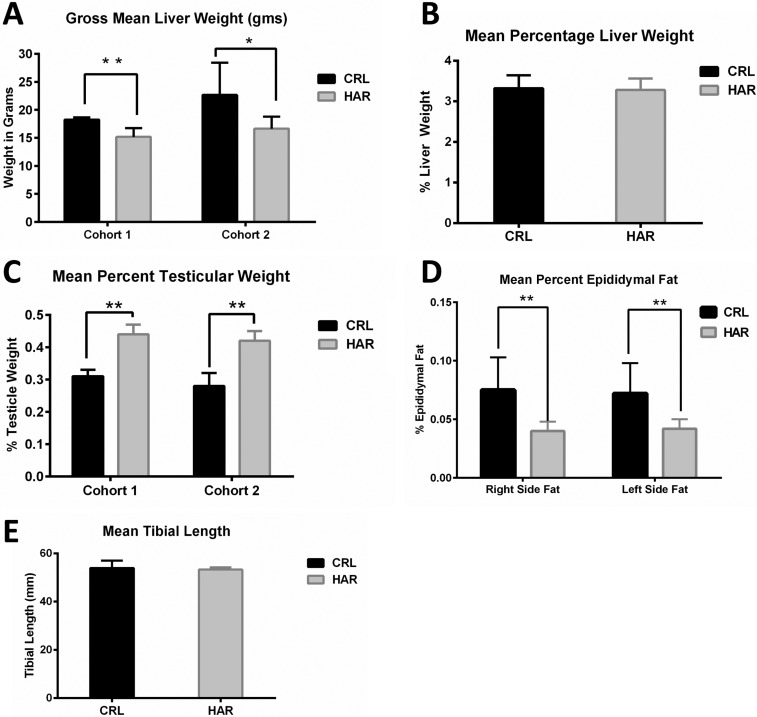 | Figure 4(A) Gross mean liver weights in grams in CRL and HAR rats, Cohort 1 and Cohort 2: (N=13-17). *P≤0.05 **P≤0.01 (B) Mean liver weight per 100 gram body weight for CRL and HAR rats, Cohort 1 and Cohort 2: (N=13-17). (C) Mean testicular weight per 100 gram body weight of CRL and HAR rats: (N=13-17) **P≤0.01 (D) Mean epididymal fat per 100 gram body weight for CRL and HAR rats: (N=5-8) **P≤0.01 (E) Average tibial length (mm) for CRL and Harlan rats. There was no significant difference in tibial lengths between the groups: (N=5-8).
|
The gross weights of testicles of HRL rats were heavier than CRL for both cohorts. When calculated per 100 gram body weight, the difference remained significant. HAR rat testicles were 29.6% (Cohort 1) and 32.1% (Cohort 2) heavier than the CRL rats (Figure 4C).
The left and right epididymal fat (which represents a sample of fat accumulation in the body cavities) was measured in Cohort 2 animals. CRL rats showed a significantly higher (44.6%) fat weight than HRL groups as a percentage of the body weight (Figure 4D). No consistent differences in gross weights were observed in other organs (Heart, lungs, spleen, kidneys, and adrenal glands) across the two groups.
In order to determine if the difference in the weight gain between the groups was due to difference in skeletal growth, tibial lengths were measured in Cohort 2. CRL rats averaged 53.93 mm and HAR rats averaged 53.26 mm. There was no significant difference in the length of the tibias between the two groups (Figure 4E).
Blood parameters
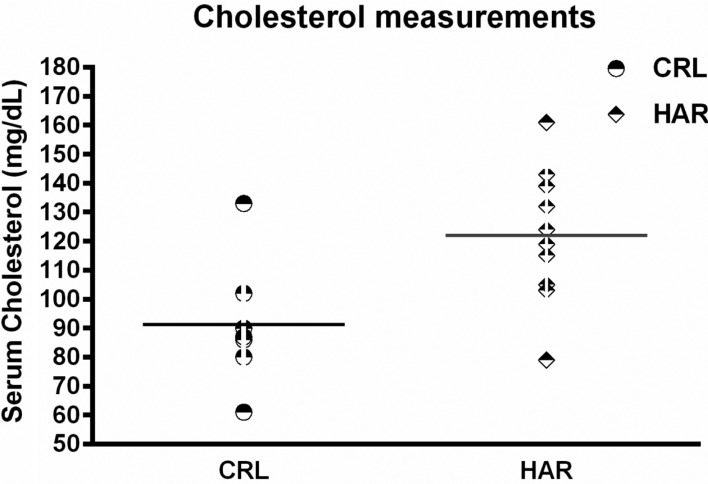
In order to determine if the difference in the body composition resulted in changes in the metabolic parameters, blood was collected from the rats prior to termination, to evaluate hematology and clinical chemistry. There were no significant differences in the hematology between the groups in both cohorts. However, clinical chemistry showed that cholesterol was significantly higher (25.4%) in HAR rats compared to the CRL rats (Figure 5).
Go to :
Discussion
The body weights of the cohorts were measured beginning at age 6 weeks and both cohorts showed diversion in the weight gain between 9-10 weeks of age. Both cohorts of CRL rats consistently gained weight at a higher rate than the HAR rats. The rats in Cohort 2 gained more weight than the rats in Cohort 1. The difference in the weight gain between the groups (CRL and HAR) could be due to genetic variation between rats obtained from different vendors. Similarly, the difference in the weight gain between cohorts (Cohort 1 and 2) within the same vendor group may be attributed to sample variation or may be related to unknown environmental affect. Based the daily clinical observations, blood work and sentinel results, the role of any infection in the differences in the weight gain was ruled out.
Three reasons were hypothesized for the divergence of weight gain between the CRL rats and the HAR rats. The first hypothesis was that the difference in the weight gain may be due to differences in the feed intake between the two groups. However, the average feed intake/100 gm body over time, between the groups showed no significant difference at most time points and therefore, a difference in the feed intake was ruled out as a cause for the difference in the weight gain. A sharp drop in the food intake at 17th week was attributed to scale calibration error after ruling out all possible scenarios. A second hypothesis was a structural difference such as increased bone growth contributed to the difference in the weight gain. To determine the structural differences, the length of tibial bone was measured at the time of necropsy and no significant difference was observed. The third hypothesis was that the weight gain difference was attributed to differences in proportion of fat accumulation. This hypothesis was tested by examining the animal's total body fat and lean mass. The CRL rats had significantly higher (49.6%) fat than the HAR rats and the HAR rats were significantly leaner (12%) than the CRL rats. This hypothesis is corroborated by the finding that the CRL rats had higher (44.6%) amounts of epididymal fat compared to HAR rats. The percentage of fat does appear to contribute to the difference in the weight between these two groups.
Organ weights were measured for both cohorts at necropsy. It is interesting to note that that the gross liver weights were significantly higher (22.2%) in the CRL rats than the HAR rats but consistent differences were not found in the spleen, adrenals, heart, kidneys or lungs. The difference in the gross liver weights versus no difference in organs, may reflect higher intracellular fat accumulation within the hepatocytes. However, there was no significant difference in the liver weights between the two groups when calculated per 100 gram body weight.
An interesting observation consistently noted between the two groups in both cohorts was the testicular weight. The HAR rats (the smaller rats) had larger gross testicular weights at necropsy than the CRL rats consistently across the two cohorts. This difference could have existed at birth or developed gradually with age. There were no significant differences found in the hematology; however the chemistry panel showed a significant difference in the cholesterol levels with HAR rats having higher levels compared to the CRL rats. This is an unexpected finding given that the HAR rats were leaner with less fat accumulation.
The differences in the fat mass between the two groups with no difference in the food intake may be attributed to variation in gene expression related to fat metabolism such as POE, LIPC, LPL, CYP1A2, ACSL5, PPARG, and PTGS2 [4]. It is important that these two SD outbred lines are not considered equivalent at least in the area of fat metabolism and disease associated with body metabolism. Many studies have shown that adipose tissue has strong downstream effects on diverse physiological processes including insulin sensitivity, glucose tolerance, respiratory quotient, oxygen consumption and insulin signaling pathway [14]. The association between adipose tissue inflammation and incidence of cancer is well characterized. Adipose tissue has been demonstrated to increase macrophage infiltration and cytokine release within the cardiovascular system leading to atherosclerosis [17]. A significantly higher proportion of adipose tissue in animal models may induce a low-grade systemic inflammation, which in turn releases adipokines that can potentially enhance the progression of atherosclerosis and tumor growth [2018]. Therefore, in order to determine the efficacy of therapeutic interventions in animal models of human disease, the effect of genetic background on fat metabolism must be taken into account.
In summary, this study demonstrated that the outbred SD rats obtained from two different sources showed significant differences in growth rates due to difference in body composition which may be linked to differences in genetic makeup. The difference in body composition among various sources will be a potential confounding factor in model creation and its effects on therapeutic intervention, thus making the model and therapy less reliable. Therefore, to minimize the effects of genetic background for those studies where genetic diversity is not a basis for experimental design, use of inbred lines is highly recommended over the outbred animal. Additionally, interpretation of results from various labs that used outbred rats (particularly SD) should be considered and compared with the knowledge of the source of the outbred strain.
Go to :
 XML Download