

 PDF
PDF ePub
ePub Citation
 Print
Print


Diabetes is one of the most common metabolic disorders in the world and the prevalence of diabetes in adults has been increasing in the last few decades [1,2]. Diabetes is characterized by a relative or absolute lack of insulin, leading to hyperglycemia. According to the International Diabetes Federations' recent report, 382 million people had diabetes in 2013, and this number is expected to rise to 592 million by 2035 [2].
There are 2 types of diabetes: type 1 and type 2. Type 1 diabetes results from the autoimmune destruction of the insulin-producing pancreatic beta cells, while type 2 diabetes is caused by insulin resistance combined with a failure of the beta cells to compensate.
Animal models for type 1 diabetes range from animals with spontaneously developing autoimmune diabetes, to animals with chemical ablation of the pancreatic beta cells. Type 2 diabetes is modeled in both, obese and nonobese animal models, with varying degrees of insulin resistance and beta cell failure [3]. Another characteristic of type 2 diabetes is that metabolic disturbance in major organs occurs at the same time [4]. For example, impaired hepatic fatty acid metabolism including fatty acid oxidation, synthesis, and storage is involved in the development of type 2 diabetes [5]. The representative animal model for type 2 diabetes is the db/db mouse, which was first reported in 1966 [6]. Leptin sensing in the hypothalamic nuclei is essential for normal regulation of satiety, as well as multiple metabolic and neuroendocrine/reproduction pathways. The db/db mouse has a spontaneously mutated leptin receptor. Hence, the extreme leptin resistance produced by the absence of an intracellular signaling domain in the leptin receptor of the db/db mouse, produces hyperphagia and morbid obesity, reproductive failure, and severe insulin resistance. Therefore the db/db mouse has been widely used in the evaluation of antiobesity and antidiabetic compounds and therapies. On the other hand, ob/ob mice with leptin gene mutation show abnormal secretion of leptin and increased rates of obesity, but leptin administration can cure obesity [7]. The obesity and normal secretory function of leptin on the other hand, are not cured even by leptin administration and high serum leptin concentrations in db/db mice with leptin receptor abnormalities [8]. ob/ob and db/db mouse models have been used for studies of leptin signaling. Leptin signaling deficiency induces a disturbance in energy balance, resulting in obesity from hyperphagia and decreased energy expenditure, leading to possible spontaneous development of insulin resistance [9,10]. A similar phenotype has been observed in humans with very rare mutations in the leptin or leptin receptor genes [5,11].
The balance between energy intake and consumption is very important for the maintenance of homeostasis in the body. Disturbance in the balance can cause a number of metabolic diseases, such as obesity, diabetes and high blood pressure.
There are 3 energy resources utilized in the body, i.e., carbohydrates, proteins and lipids. The energy source utilized in the body can be determined by indirect calorie measurement, in which oxygen consumed (VO2) and carbon dioxide produced (VCO2) are measured [12,13]. Respiratory exchange ratio (RER) which is calculated by the ratio of VO2/VCO2, reflects the usage of 3 major nutrients during constant breathing [14,15].
Diabetes is progressively accompanied by an abnormal metabolism. Accordingly, the usage of energy resources may be similarly altered in the db/db mouse. Several studies have determined RER values in a short experimental period [16]. However, there is insufficient data on changes in energy metabolism with age, in the db/db mouse. We aimed to elucidate the age-dependent energy metabolism from the early phase to the late phase of diabetes in db/db mice.
Materials and Methods
Experimental animals
Fifteen female mice aged 4 weeks were used for each group of db/db, db/+, and +/+ mice. All the animals were obtained from the Laboratory Animal Resource Center, Korea Research Institute of Bioscience and Biotechnology (KRIBB) (Cheongju, Korea). Mice were bred and maintained in the SPF facility under a 12 h light-dark cycle (lights on 6:00; lights off 18:00), 22±0.5℃ and 40-60% humidity, and they were allowed free access to chow (2018S, Harlan Laboratories Inc., Wisconsin USA) and water. All experiments were performed after approval by the Institutional Animal Care and Use Committee (IACUC) of KRIBB (approval No: KRIBB-AEC-14086).
Experimental design
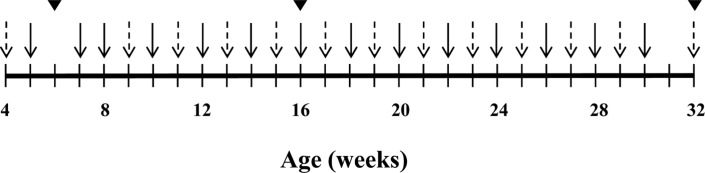
Indirect calorimetry, measurement of blood glucose level, intraperitoneal glucose tolerance test (IPGTT), urine analysis and body fat mass measurements were performed at the points depicted in Figure 1.
Indirect calorimetry
Indirect calorimetry was performed using a computer-controlled, open-circuit system (Oxymax; Comprehensive Lab Animal Monitoring System; Columbus Instruments, Columbus, OH). Mice were tested in individual clear chambers (20×10×12.5 cm) with a stainless steel elevated wire floor. Each chamber contained a sipper tube delivering water, a food tray connected to a balance, and 16 photobeams at 1.3-cm intervals situated in rows 3.3 and 7.3 cm above the floor to detect motor activity along the x-, y-, and z-axes, respectively. Flow rate of room air through the chambers was 0.4 L/min. The chamber exhaust was sampled for 1 min (at 8-min intervals) and passed through O2 and CO2 sensors for the estimation of oxygen consumption and carbon dioxide production. Outdoor air reference values were sampled every 8 measurements. Gas sensors were calibrated before experiments with gas standards containing known concentrations of O2, CO2, and N2 (Sinyoung, Seoul, Republic of Korea). The RER was calculated as the ratio of VCO2 to VO2. Energy expenditure (heat formation [(3.815+1.232×RER)×VO2 (in liters)]) was corrected for estimated metabolic mass per Kleiber's power function (Kleiber, 1975). Indirect calorimetry module had standard measurements that began to work at 5 h before lights off (lights off=T0) and finished at T16 (i.e., 4 h after lights on the next morning). Mice were acclimated for 1 day before the trial.
IPGTT
IPGTT was performed after an 18 h fast. Briefly, after fasting for 18 h, blood was collected from the tail vein of mice (0 min). Immediately after blood collection, the mice received an intraperitoneal injection of glucose (2 g/kg body weight). Blood samples were successively collected at appropriate time intervals (15, 30, 60, and 120 min), and blood glucose concentrations from the tail vein blood were measured using a One touch Basic glucose measurement system (Life Scan, Milpitas, CA).
Urinalysis
Urine analysis was performed with urine test strips (UriScan 10 SGL strips) and UriScan Optima II (YD Diagnostics, Seoul, Korea). Parameters in urine such as occult blood, bilirubin, urobilirubin, ketones, proteins, nitrites, glucose, pH, specific gravity and leukocytes were determined.
Results
Body weight changes
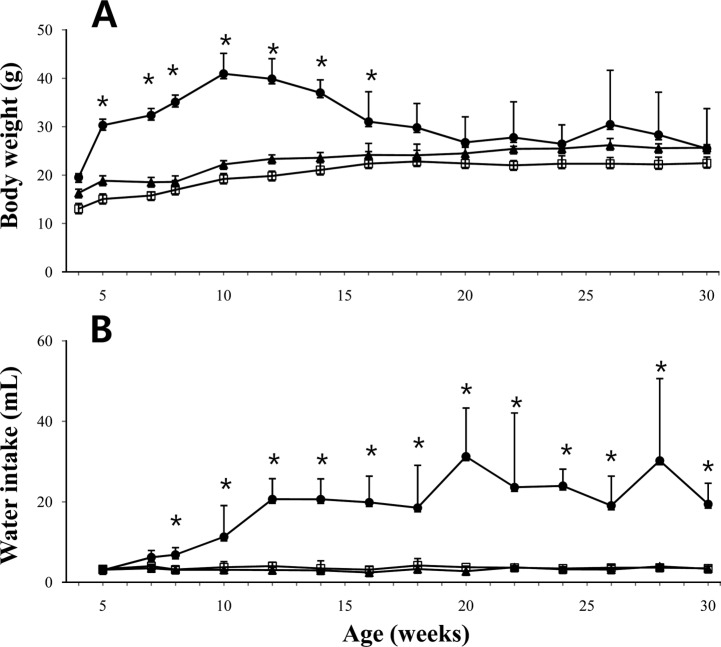
The body weight changes with age of the 3 experimental groups of mice were monitored from 5 to 30 weeks (Figure 2).The db/db mouse group had a significantly greater body weight than those in +/+ or db/+ mice, even at 5 weeks of age, the starting point of experiment (Figure 2A). The body weights of db/db mice increased continuously until the peak body weight at 10 weeks of age. Subsequently, the body weight reduced to the same level as +/+ or db/+ mice by 18 weeks of age and no significant difference in body weight between the 3 groups was observed during the entire experimental period.
Food and water consumptions
Although there was no difference in food consumption between the 3 groups, the db/db mice consumed a significantly higher volume of water, as compared with those in the db/+ or +/+ group mice from 8 weeks of age (Figure 2B). The water consumption in the db/db mice increased until 12 weeks of age, and the increased level of water consumption was maintained throughout the experimental period. However, there was no significant difference in food consumption between the 3 groups (data not shown).
RER, heat production and moving activity
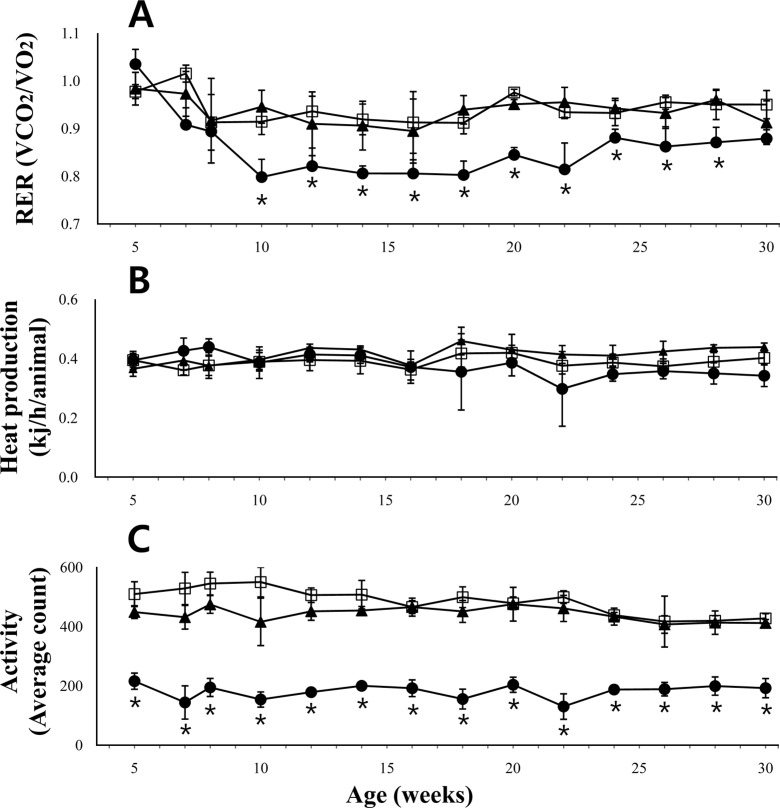
Indirect calorimetry measures of VO2 and VCO2 resulted in an RER between 0.98 and 1.03, at 5 weeks of age in all the 3 groups (db/db 1.03±0.02; db/+ 0.98±0.09; and +/+ 0.98±0.09, respectively). However, the level in db/db mice began to decline and reached the lowest level by 10 weeks of age (RER=0.80±0.03) (Figure 3A). The decreased levels of RER in db/db mice maintained a steady state level until around 20 weeks of age. Subsequently, the level in db/db mice increased slightly by 24 weeks of age, and then stabilized until the end of the observation period.
Heat production was also calculated from parameters obtained by indirect calorimetry. There was no significant difference between the 3 animal groups (Figure 3B).
The moving activity detected during the measurement of indirect calorimetry was significantly different between db/db mice and db/+ or +/+ mice (Figure 3C). The differences were detected throughout the observational period.
Blood glucose levels
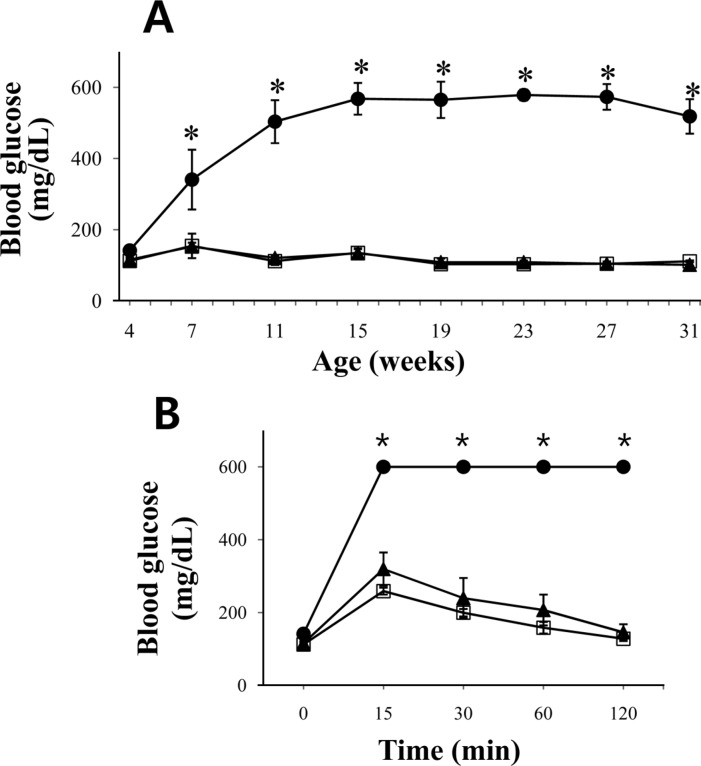
Fasting blood glucose levels were measured using blood collected from the tail vein. The fasting blood glucose level at 4 weeks of age was similar in the db/db, db/+ or +/+ groups (Figure 4). However, the level in the db/db mice showed an abrupt increase and became significant when compared to those in db/+ or +/+ mice by 7 weeks of age. The increased blood glucose level peaked at 15 weeks age. The levels were then maintained throughout the experimental period.
However, db/db mice showed clear glucose intolerance even at the age of 4 weeks, as demonstrated by IPGTT (Figure 4B). Glucose tolerance did not return in db/db mice throughout the observation period (data not shown).
The high urine glucose levels in db/db mice were observed from 7 weeks age, in accordance with the results described above (data not shown). The increased urine glucose level was not lowered during the entire experimental period.
Discussion
We determined the long term changes in the RER ranging from 5 weeks to 30 weeks of age, in female db/db mice. The abrupt decline in RER of db/db mice between 5 and 8 weeks of age indicated that there was an abrupt change in the energy source from carbohydrates to proteins and lipids in the mice. This result was consistent with the previous report that RER values indicated that db/db mice aged 10 weeks used proteins as energy substrates, in contrast to carbohydrates in +/+ mice [17]. The RER values of around 0.8 suggested that protein and lipid are used as the main energy source in db/db mice [18]. The RER in db/db mice slightly increased around 22 weeks of age, which coincided with their body weight reduction. Our study further corroborated earlier reports that db/db mice show dramatically reduced activity levels, as compared with +/+ mice [19,20].
The db/db mice became obese as early as 5 weeks of age in this study. The body weight reached a peak at 12 weeks of age and gradually decreased, which was consistent with the results of previous studies [21,22]. However, no correlation between body weight reduction and blood glucose levels was observed in db/db mice.
The usage of glucose as an energy source increased after 22 weeks of age, as indicated by slightly increased RER, although there were no changes in the blood and urine glucose levels. The drink intake in db/db mice aged over 10 weeks was more than double those in the db/+ and +/+ mice, although the food consumptions were not different between the experimental groups. The loss of glucose by urine was clear in db/db mice at 7 weeks of age. This was suggestive of glucose not utilized for energy but instead excreted in the urine, which was consistent with the decrease in RER in db/db mice as described above.
The histological observation also indicated clear pancreatic islet degenerative changes in db/db mice (data not shown). These degenerative changes included nuclear fragmentation and cytoplasmic vacuolation in db/db mice aged over 9 weeks, indicating the selective destruction of insulin-producing beta cells [23].
In conclusion, the energy source used in db/db mice changed with the age-related progression of diabetes and the changes of RER in db/db mice were closely related with the advance of diabetes. These data would be very helpful for proper interpretation of further data obtained from db/db mice.
 XML Download