

 PDF
PDF ePub
ePub Citation
 Print
Print


L. platyphylla, an herb plant that is widely-distributed in temperate climate regions of the Northern Hemisphere, is a valuable anti-diabetic candidate material [1]. L. platyphylla has long been used in traditional oriental herbal medicine for the treatment of asthma, bronchial and lung inflammation, obesity, diabetes, neuro degenerative diseases, and atopic dermatitis [2-7]. Of these therapeutic effects, the potential of L. platyphylla for treating obesity and diabetes has been intensively researched. Gyeongshingangjeehwan (mainly containing L. platyphylla) has been shown to effectively prevent obesity and hyper triglyceridemia through inhibition of feeding and activation of hepatic peroxisome proliferator-activated receptor-alpha in OLETF male rats [5]. The homoisoflavone-enriched fraction of methanol extracts was found to stimulate increased insulin-stimulated glucose uptake in 3T3-L1 adipocytes through the elevation of glucose transporter (Glut)-4 contents in the plasma membrane [3]. Furthermore, our group has isolated novel compounds from L. platyphylla using methanol extraction. Of these compounds, LP9M80-H dramatically induces insulin secretion and differentially regulates Glut-1 and Glut-3 expression through the mitogen-activated protein kinase (MAPK) and phosphoinisitide-3-kinase (PI3-K) signaling pathways [8]. Moreover, aqueous extracts of L. platyphylla were shown to induce insulin secretion from pancreatic islets as well as increase expression of glucose transporter in hepatocytes [9].
Steaming is often applied to medicinal plants in order to increase the levels or efficacy of their functional components as well as to induce chemical transformations of specific components [10]. Recently, steaming process was applied to L. platyphylla for this purpose. Specifically, manufactured RLP was prepared as five extracts (200 g of dry roots each) subjected to different steaming times (0, 3, 9, 15, and 24 h; 0-SLP, 3-SLP, 9-SLP, 15-SLP, and 24-SLP, respectively) at 99℃, followed by air-drying for 24 h at 70℃. RLP was also prepared as six extracts in two repeated steps (200 g of dry roots steamed at 99℃ for 3 h and air-dried at 70℃ for 24 h) performed for various repetitions (0, 1, 3, 5, 7, and 9 times; 0-SALP, 1-SALP, 3-SALP, 5-SALP, 7-SALP, and 9-SALP, respectively) [11]. Of these RLP extracts, maximum insulin secretion was observed in INS-1 cells treated with RLP extract steamed for 3 h (3-SLP) in two repeated steps carried out nine times (9-SALP). However, the function of RLP in glucose and calcium regulation has not yet reported.
In this study, we investigated the function of RLP with a particular focus on the regulation of calcium and insulin secretion. RLP had a major impact on insulin secretion via regulation of glucose and calcium concentrations in INS-1 cells and animal models.
Materials and Methods
Preparation of RLP and ginseng sample
Roots of LP were collected from plantations in the Miryang area of Korea and dried with a hot-air drying machine (JSR, Korea) at 60℃. These roots were reduced to powder using an electric blender, and the water extracts were purified for 2 h at 100℃ using circulating extraction equipment (IKA Labortechnik, Staufen, Germany) after addition of 200 mL of distilled water. Additionally, the extract solution was concentrated into dry pellets with a rotary evaporator (EYELA, Tokyo, Japan) and stored at -80℃ until use. To manufacture RLP, a specific process comprising two steps (200 g of dry roots steamed at 99℃ for 3 h and air-dried at 70℃ for 24 h) was carried out for a total of nine repetitions. RLP obtained via these processes was treated by following the same procedures used in the above protocol for preparation of dry pellets [11]. Furthermore, two kinds of Korean ginseng were purchased from Cheng-Kwan-Jang at Korea Ginseng Corp. (Daejon, Korea). These roots were treated by following the same procedures used in the above protocol for preparation of dry pellets.
Cell culture
INS-1 cells, which have the ability to secrete insulin, were obtained from the Korean Food and Drug Administration (Osong, Korea). This cell line was maintained for 24 to 36 h in RPMI-1640 medium (Invitrogen, Carlsbad, CA, USA) containing 10% fetal bovine serum (FBS, Hyclone Laboratories Inc., USA) 100 IU/mL of penicillin, and 100 µg/mL of streptomycin. All cells were maintained in a humidified incubator at 37℃ and 5% CO2.
MTT assay
INS-1 cells were seeded at a density of 4×10⁴ cells/200 µL in 96-well plates and then grown for 24 h in a 37℃ incubator. Upon reaching 70-80% confluence, cells were exposed to media containing distilled water (vehicle) or RLP extracts (50 µg/mL) dissolved in dH2O along with different concentrations of glucose for another 24 h. Cell proliferation was determined using the tetrazolium compound MTT (3-[4,5-dimethylthiazol-2-yl]-2, 5-diphenyltetrazolium bromide, Sigma-Aldrich). After supernatants from vehicle or RLP-treated cells were discarded, 200 µL of fresh RPMI-1640 medium and 50 µL of MTT solution (2 mg/mL in phosphate-buffered saline; PBS) were added to each well, followed by incubation in a 37℃ incubator. Reduction of MTT to insoluble purple formazan dye crystals by viable cells was evaluated in 220 µL recovered after 4 h. The formazan precipitate was then dissolved in DMSO and the absorbance read directly at 570 nm in wells using a Soft Max Pro 5 spectrophotometer (Molecular Devices, Sunnyvale, CA, USA). Additionally, the data were analyzed in terms of cell number versus absorbance, thereby allowing changes in cell proliferation to be quantified.
ELISA for insulin detection
The levels of insulin in the culture supernatant were detected by following the ultra-sensitive assay procedure using reagents in the insulin ELISA kit (Mercodia; Cat. 10-1137-01, Sweden). Briefly, the supernatant and standards were incubated in a plate shaker at 100-150 rpm at room temperature for 2 h on antibody-coated plates. The wells were then washed six times using an automatic plate washer (Hoefer, PV100, USA), after which HRP conjugate was added to each of the wells. The plates were then incubated in a shaker for 30 min at room temperature. The reaction was terminated by the addition of 50 mL of stop solution (0.5 M H2SO4), after which the plates were analyzed by evaluating the absorbance at 450 nm using a Molecular Devices Vmax Plate reader (Sunnyvale, CA, USA).
Detection of intracellular calcium concentration using fura-2
The concentration of intracellular calcium was determined by Grynkiewicz's method using fura-2/AM [12]. Briefly, prepared INS-1 cells were incubated with 5 µM fura-2/AM (Invitrogen, F1221, USA) at 37℃ for 40 min in fresh serum-free RPMI 1640 medium under continuous stirring. A total of 2×10⁶ cells were aliquoted for each assay in Ca11-free Locke's solution (154 mM NaCl, 5.6 mM KCl, 1.2 mM MgCl2, 5 mM HEPES [pH 7.3], 10 mM glucose, and 0.2 mM EGTA). Changes influorescence at dual excitation wavelengths of 340 nm and 380 nm and an emission wavelength of 500 nm were measured, and the calibrated fluorescence ratio was translated into calcium concentration.
Care and use of animals
All animal experimental procedures employed herein were approved by the Institutional Animal Care and Use Committee (IACUC) of Pusan National University (PNU-2011-000220). The animals were handled in the Pusan National University-Laboratory Animal Resources Center accredited by Korea FDA in accordance with USA NIH guidelines (Accredited Unit Number-000996). All mice were housed under specific pathogen-free (SPF) conditions with a strict light cycle (lights on at 06:00 h and lights off at 18:00 h) and were provided a standard irradiated chow diet (Purina Mills Inc., St. Louis, MO, USA) ad libitum. Adult ICR mice were purchased from SamTako Co., Korea. LETO and OLETF rats (20-weeks-old) used in this study were supplied by Central Laboratory Animals Inc. (Seoul, Korea).
RLP treatment and detection of glucose level
For the streptozotocin (STZ)-induced model, ICR mice were divided randomly into two groups. The first group of ICR mice was not treated with any compound and was used as a control group. The second group received 70 mg/kg body weight of via intraperitoneal injection for 7 days in order to induce diabetic conditions. After 7 days, the second group was further divided into two subgroups (vehicle-treated group and RLP-treated group). The first subgroup of mice received a comparable volume of daily water via intraperitoneal injection (vehicle-treated group), whereas the second group received 50 mg/kg body weight/day of RLP via gavage for 7 days (RLP-treated group). After 7 days, the glucose concentrations of both subgroups were measured after 24 h of fasting using the sensitive strip of the Blood Glucose Monitoring System (I-sens Co., Seoul, Korea).
For the OLETF model, OLETF rats were divided randomly into two groups. The first group received a comparable volume of daily water via oral administration (vehicle-treated group), whereas the second group received 50 mg/kg body weight/day of RLP via oral administration for 3 weeks (RLP-treated group). After 3 weeks, the glucose concentrations of both groups were detected after 24 h of fasting using the sensitive strip of the Blood Glucose Monitoring System (I-sens Co., Seoul, Korea).
ELISA for extracellular calcium concentration
The serum concentration of calcium was measured by using the chromogenic complex formed between calcium ions and O-cresol phthalein in the Colorimetric Calcium Assay kit (BioVision; Cat. K380-250, CA, USA). Briefly, the supernatant a long with different concentrations of standards were placed in each well of a 96-well plate, followed by the addition of chromogenic reagent and calcium assay buffer to each well. After incubation in the dark for 10 min at room temperature, the plates were analyzed by evaluating the absorbance at 575 nm using a Molecular Devices Vmax Plate reader (Sunnyvale, CA, USA) within 30 min. A standard curve for calcium amount (µg/well) versus OD 575 nM was plotted in order to measure the amount of calcium in each well. Finally, the calcium concentration of the test sample was calculated directly using the following equation: C (calcium concentration)=Sa/Sv (µg/µL), where Sa is the amount of calcium in the sample obtained from the standard curve and Sv is the volume of sample added to the each well.
Statistical analysis
Tests for significance between the vehicle- and RLP-treated groups were carried out using a One-Way ANOVA test of variance (SPSS for Windows, Release 10.10, Standard Version, Chicago, IL, USA). Tests for significance between subgroups of the RLP-treated group were performed using Post-Hoc test (SPSS for Windows, Release 10.10, Standard Version, Chicago, IL, USA) of variance, and significance levels are given in the text. All values are reported as the mean±standard deviation (SD). A P value of <0.05 was considered as significantly different.
Results
Effects of RLP on insulin release from INS-1 cells
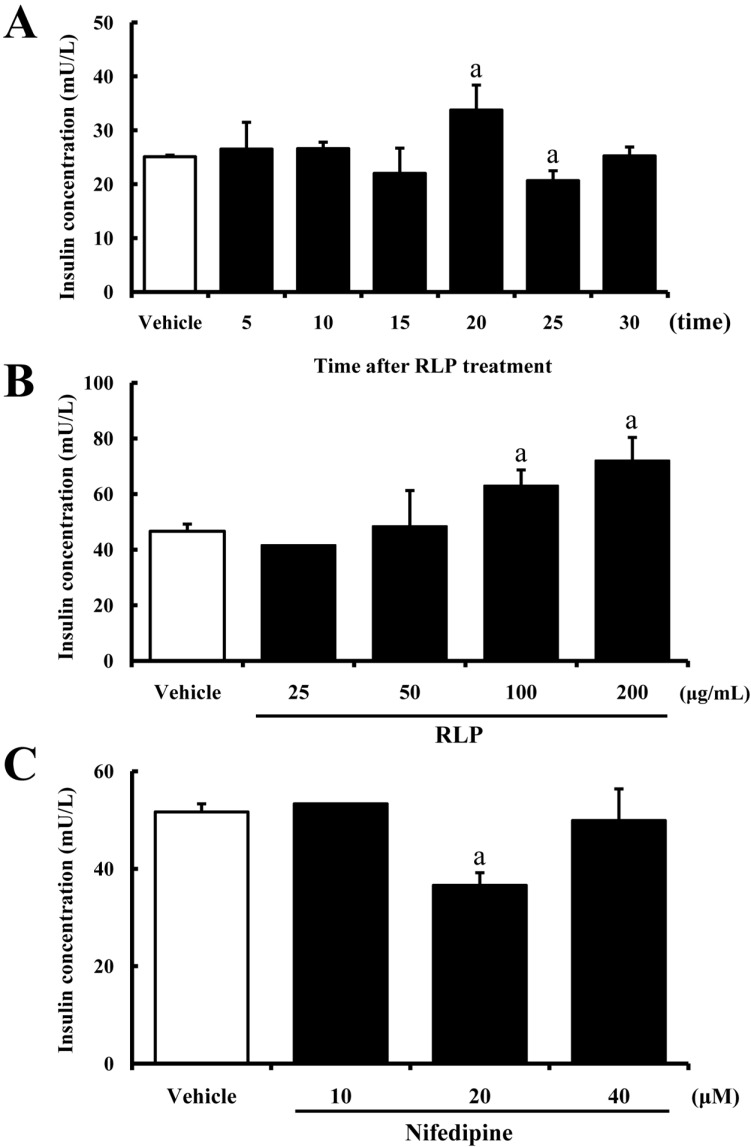
Insulin is produced in the pancreas and released when amino acids and glucose from digested food are detected in the blood [13]. In order to investigate the effects of RLP on insulin secretion from INS-1 cells, the insulin concentration in the cell supernatant was measured after RLP treatment for different times and at different concentrations. In the time-dependent analysis, maximum insulin secretion was detected at 20 min after RLP treatment, whereas only a slight increase or decrease in insulin concentration was observed at other time points (Figure 1A). However, in the dose-dependent analysis, elevation of insulin secretion was dependent on the RLP concentration. The insulin concentration was elevated by 63% in INS-1 cells treated with 200 µg/mL of RLP (Figure 1B). These results suggest that the optimum conditions for insulin secretion were treatment with 200 µg/mL of RLP for 20 min.
Nifedipine belongs to the chemical group of drugs known as dihydropyridines, which are calcium channel blockers that bind to the N-binding site of L-type calcium channel [14]. To determine whether or not the increase in insulin secretion induced by RLP is mediated through a calcium channel, alteration of insulin concentration was measured in INS-1 cells after nifedipine pretreatment. The concentration of insulin significantly increased in 20 µM nifedipine-treated cells compared to vehicle-treated cells (Figure 1C). These results indicate that the increase in insulin secretion induced by RLP was partially mediated by L-type calcium channel.
Dose-dependent response of RLP on regulation of intracellular calcium
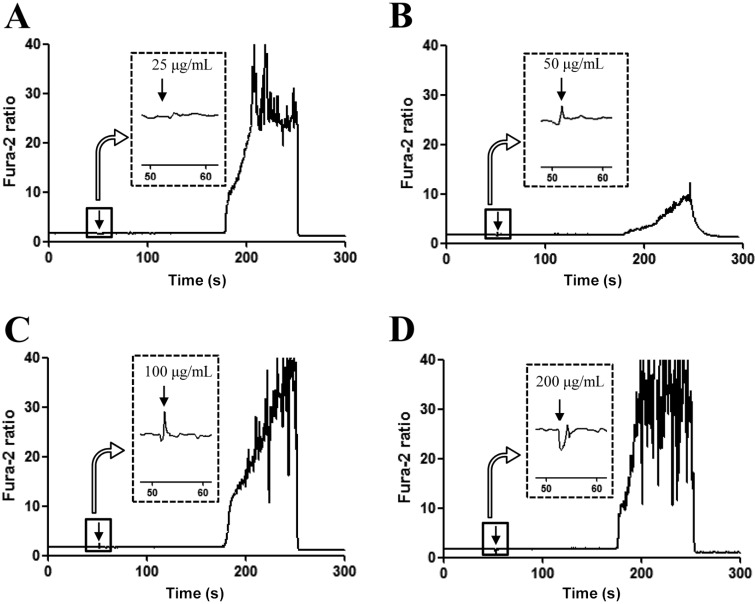
Calcium ion plays an important role as a mediator in the regulation of insulin secretion in pancreatic β-cells [15]. Therefore, we investigated the effects of RLP on the regulation of calcium secretion. For this, the intracellular calcium concentration was measured in INS-1 cells after treatment with RLP extracts. Maximum concentration of intracellular calcium was detected in INS-1 cells treated with 100 µg/mL of RLP (Figure 2C). Although the intracellular calcium level increased with RLP concentration from 25 µg/mL to 50 µg/mL (Figure 2A, 2B), this level rapidly decreased in INS-1 cells treated with 200 µg/mL of RLP (Figure 2D). These results show that RLP induced an increase in intracellular calcium concentration in INS-1 cells at an optimum RLP concentration of 100 µg/mL.
Comparison of intracellular calcium regulation abilities of RLP extracts
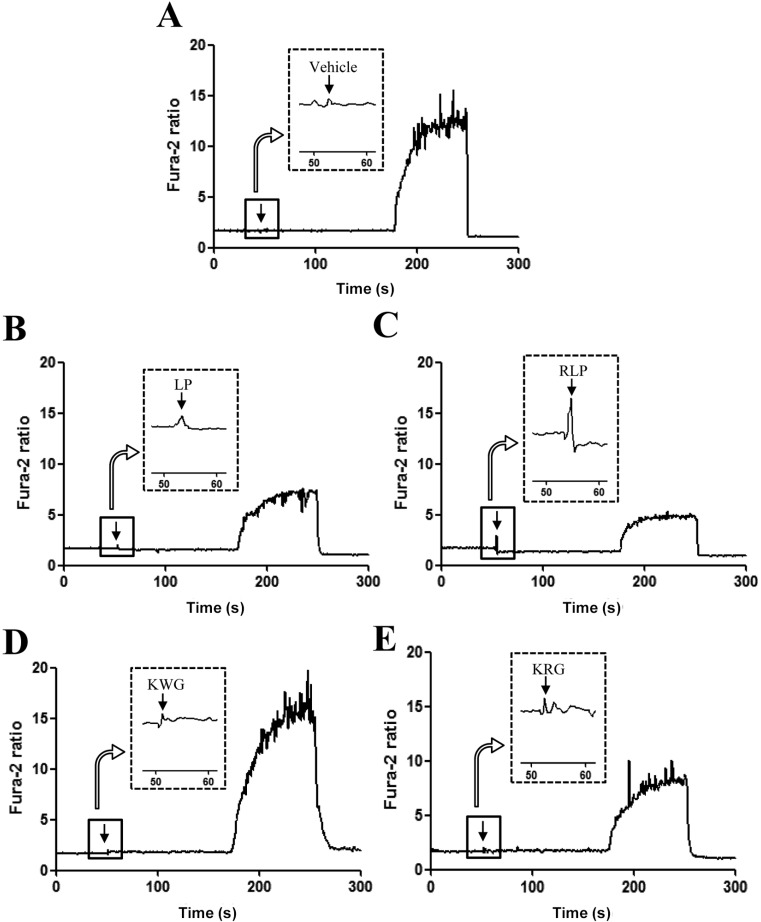
To compare the abilities of RLP extracts to regulate intracellular calcium, the intracellular calcium concentration in INS-1 cells was measured following treatment with four different RLP extracts, including two natural forms and two steamed processed forms. Korea red ginseng (KRG) (Ginseng Radix Rubra) was successfully manufactured from Korea white ginseng (KWG) (Panax ginseng C.A. Meyer) to induce chemical transformations of specific components [10]. As shown in Figure 3, intracellular concentrations of calcium in INS-1 cells treated with steamed processed forms (RLP and KRG) were higher than those in INS-1 cells treated with natural forms (LP and KWG). Furthermore, RLP-treated INS-1 cells showed markedly increased calcium concentrations compared with KRG-treated INS-1 cells. These results suggest that the steaming process elevated the intracellular calcium concentration, although the rate of increase varied among the extracts. Further, RLP dramatically stimulated an increase in intracellular calcium concentration in INS-1 cells.
Inhibitory effects of nifedipine on RLP-induced increase in intracellular calcium concentration
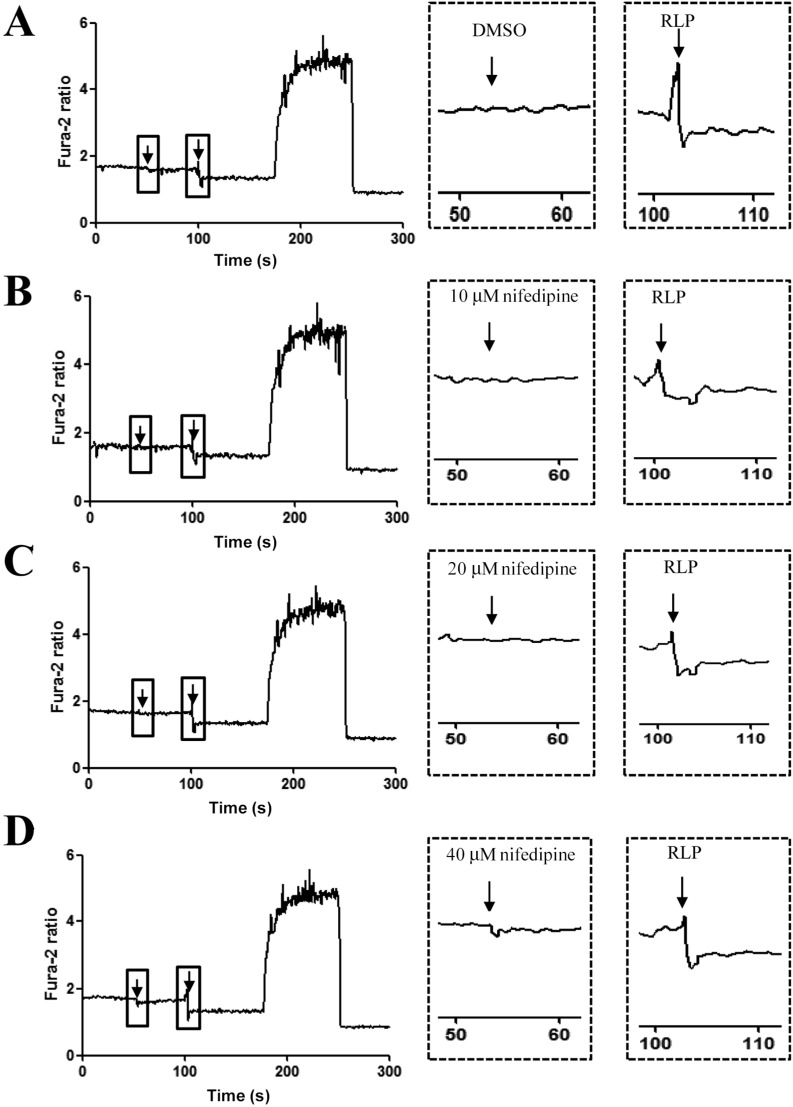
To determine whether or not the increase in insulin secretion induced by RLP is mediated through a calcium channel, alteration of insulin concentration was measured in INS-1 cells after nifedipine pretreatment. The intra cellular calcium concentration in INS-1 cells significantly increased upon DMSO pretreatment. However, concentrations of intracellular calcium in nifedipine-treated cells were slightly reduced compared to DMSO treatment in a dose-dependent manner (Figure 4). Specifically, the RLP-induced increase in intracellular calcium was abrogated but not completely abolished upon treatment with 40 mM nifedipine. These results indicate that elevation of insulin secretion stimulated by RLP was partially associated with L-type calcium channel.
Effects of RLP on insulin secretion under different concentrations of glucose
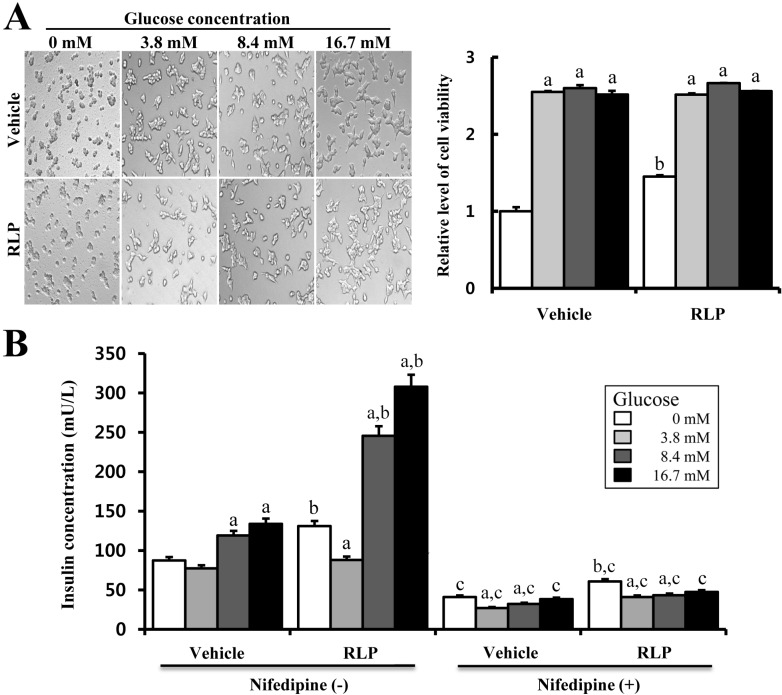
Firstly, to investigate the effects of RLP on cell viability under different concentrations of glucose, the viability of INS-1 cells was measured following treatment with RLP (50 µg/mL) and four different glucose concentrations for 24 h. There were no differences in cell viability between vehicle- and RLP-treated cells under the four different glucose concentrations. The viability of vehicle-treated cells was significantly higher with glucose treatment than without, although there was no dose-dependent effect. These patterns were also maintained in RLP-treated cells. However, without glucose treatment, cell viability was higher in RLP-treated cells compared to vehicle-treated cells (Figure 1A). These results suggest that RLP had almost no effect on INS-1 cell viability at all glucose concentrations except for 0 mM glucose.
Furthermore, to evaluate the effects of RLP on insulin secretion from INS-1 cells treated with different concentrations of glucose, the insulin concentration was measured in the culture supernatant of INS-1 cells treated with RLP for 24 h. Insulin secretion was elevated in both vehicle- and RLP-treated cells, although the rate of increase differed between the two conditions. The insulin concentration was higher following RLP treatment compared to vehicle treatment. In vehicle-treated cells, the insulin concentration slightly increased depending upon the concentration of glucose, although there were no difference between 0 and 3.8 mM. In RLP-treated cells, the insulin concentration dramatically increased under 8.4 and 16.7 mM glucose treatment, whereas this level was slightly lower under 3.8 mM glucose (Figure 5B). Furthermore, to determine whether or not calcium regulation by RLP treatment is associated with a calcium channel, alteration of insulin secretion was measured in the culture supernatant of INS-1 cells treated with nifedipine. Nifedipine-treated cells showed a significantly low level of insulin secretion compared with vehicle-treated cells. Further, there was no difference in insulin secretion between vehicle- and RLP-treated cells after nifedipine treatment (Figure 5B). This result shows that elevation of insulin secretion stimulated by RLP was strongly dependent upon the concentration of calcium through specific regulation of L-type calcium channel.
Effects of RLP on calcium regulation in STZ-induced diabetic mice
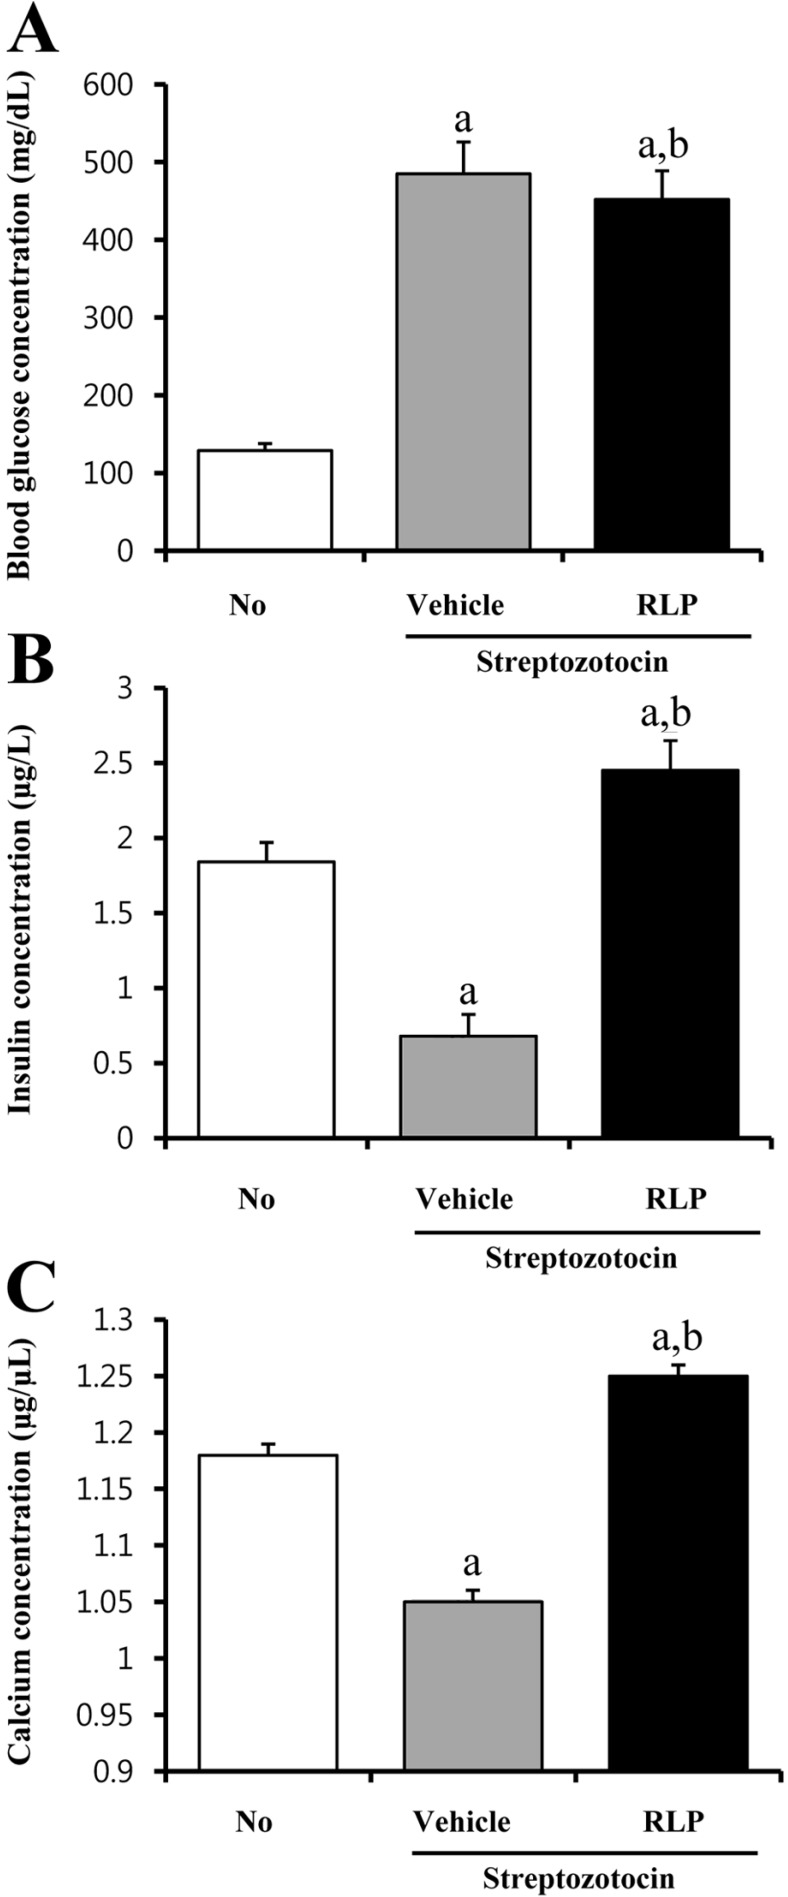
To determine whether or not RLP treatment affects calcium regulation in a diabetic animal model, serum concentrations of glucose, insulin, and calcium were measured in STZ-induced diabetic mice after RLP treatment for 7 days. As shown in Figure 6, STZ treatment for 7 days successfully induced diabetic conditions in ICR mice as evidenced by high glucose and low insulin concentrations. ICR mice showed a significantly reduced concentration of glucose upon RLP treatment compared to vehicle-treated mice (Figure 6A). On the other hand, insulin secretion was dramatically increased in diabetic mice treated with RLP compared to vehicle treatment (Figure 6B). A similar pattern was detected in the calcium concentration analysis. Specifically, RLP-treated ICR mice showed a significantly elevated calcium concentration, whereas vehicle-treated mice showed reduction of calcium (Figure 6C). These results indicate that RLP treatment elevated insulin and calcium concentrations in STZ-induced diabetic mice.
Effects of RLP on calcium regulation in OLETF rats
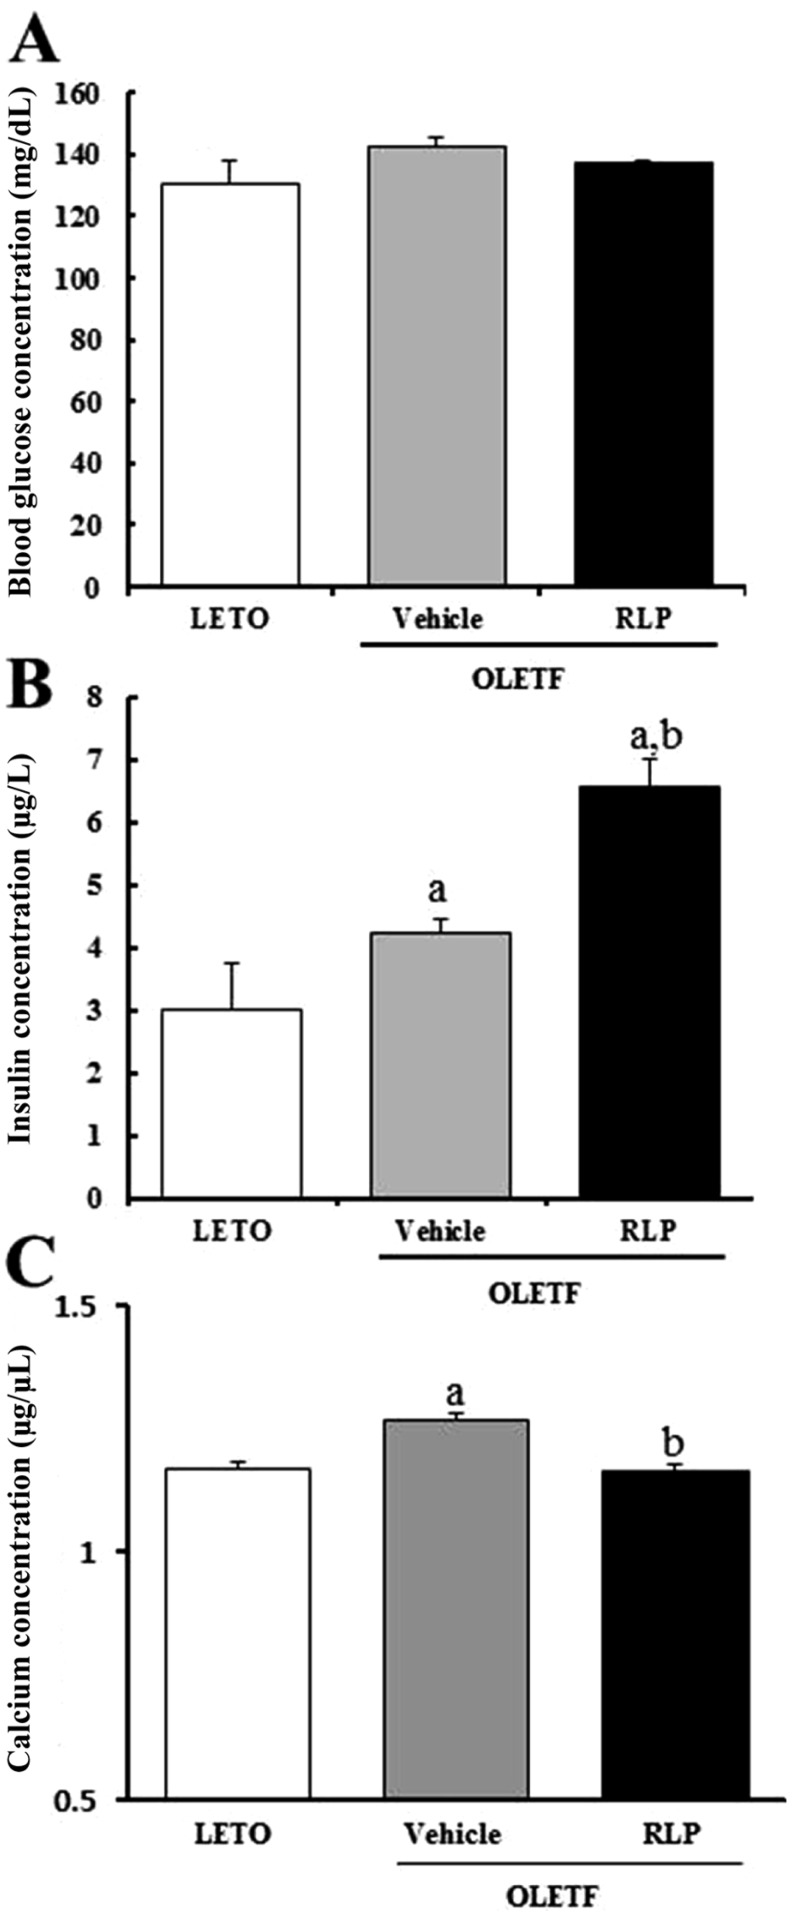
Finally, the effects of RLP treatment on calcium regulation were determined by measuring the serum level of calcium in 20-week-old OLETF rats showing an early stage of diabetic phenotype. The insulin concentration was significantly higher in OLETF rats than in LETO rats (approximately 1.43-fold). After RLP treatment, the insulin concentration significantly increased up to 6.4 mg/L (Figure 7B), whereas the glucose concentration was maintained (Figure 7A). Furthermore, RLP treatment reduced the calcium concentration in OLETF rats back to that of LETO rats. These results suggest that RLP treatment effectively enhanced insulin secretion in OLETF rats through down regulation of the calcium concentration.
Discussion
Appropriate regulation of insulin secretion from pancreatic β-cell siscritically important to maintaining energy homeostasis in the human body. These cells must rapidly recognize and suitably respond to alterations in blood glucose levels, and perturbations of glucose-sensing mechanisms can induce hypoglycemia or hyperglycemia [16]. The glucose-sensing mechanism of pancreatic β-cells is composed with two stages: (i) a proximal event of glucose uptake and oxidative phosphorylation and (ii) a distal event of insulin secretion [16]. In the distal event, alteration of the cytoplasmic calcium concentration acts as a trigger for the regulation of insulin secretion. Cytoplasmic calcium moves from the extracellular environment through voltage-dependent calcium channels, which are opened by depolarization of the β-cell membrane [17]. Further, calcium stored in the ER lumen may be released into the cytoplasm via the IP3-receptor mediated signaling pathway [18]. Therefore, to develop a novel therapeutic drug for diabetes, one must understand the function of calcium. In this study, we report the regulation of calcium by RLP.
Generally, steaming process is applied to induce the chemical transformation or novel formation of compounds. Red ginseng was firstly manufactured using this process [10]. Our group previously synthesized RLP under different steaming times and frequencies. Of the 11 different types of manufactured RLP, 9-SALP (steamed for 3 h and air-dried for 24 h with nine repetitions) induced maximum insulin secretion from INS-1 cells [11]. In this study, we investigated the insulinotropic activity of 9-SALP under different glucose conditions. As shown in Figure 5, elevation of insulin secretion was dependent upon the glucose concentration in vehicle- and RLP-treated cells. However, the rate of increase was greater in RLP-compared to vehicle-treated cells. Similar results have been detected in BRIN-BD cells using Terminalia bellirica. Specifically, aqueous extract of T. Bellirica was shown to elevate the insulin concentration in a glucose dose-dependent manner [19]. However, in another study, insulin secretion induced by extract of Costus pictus did not directly correlate with the glucose concentration, whereas C. pictus had a direct stimulatory effect on basal insulin secretion [20]. In addition, aqueous ethanolic extracts of KRG were shown to not potentiate insulin secretion induced by glucose [10].
Many plant-derived extracts have been reported to stimulate insulin secretion by facilitating entry of extracellular calcium into β-cells via voltage-gated calcium channels in the plasma membrane [20]. Treatment with C. pictus extract has been shown to elevate the intracellular calcium concentration in MIN6 PI cells, mouse islets, and human islets [20]. Further, aqueous extract of Gymnema sylvestre has been shown to induce dose-dependent stimulation of insulin secretion from MIN6 cells at 2 mM glucose [21]. In a previous study, aqueous ethanolic extract of KRG significantly induced insulin secretion at 3.3 mM glucose compared to vehicle treatment. The removing of extracellular calcium, the treatment of L-type calcium channel blocker and ATP-sensitive potassium channel opener prevented insulin secretion activated by KRG treatment. However, they did not investigate the intracellular calcium concentration under these conditions [10]. Our similarly results showed elevation of intracellular calcium, although the rate of increase was different. As shown in Figure 3, RLP dramatically stimulated elevation of intracellular calcium concentration compared to KRG. Therefore, these results demonstrate RLP as a potential candidate for the elevation of intracellular calcium and induction of insulin secretion. On the other hand, some differences in calcium regulation were observed between STZ-induced diabetic mice and OLETF rats. We believe that these differences can be attributed to the diabetic phenotype of laboratory animals. As shown in Figure 6 and 7, the glucose concentration in STZ-induced diabetic ICR mice was higher than 400 mg/dL, whereas that in OLETF rats was greater than 100 mg/dL. These results indicate that the serum level of glucose significantly affected insulin regulation and the calcium concentration in response to RLP treatment.
Taken together, we found that RLP affected insulin secretion in pancreatic islets as well as an animal model through calcium regulation. These findings show the possibility that RLP manufactured by steaming process can be utilized as a therapeutic drug to exert beneficial effects on diabetes.
 XML Download