

 PDF
PDF ePub
ePub Citation
 Print
Print


Prostate cancer (PCa) is the most common and the second leading cause of death due to the cancer in American men [1]. Generally in Asia, including China, Japan, and Korea, the incidence and mortality of PCa has been lower than those of the United States or Europe during the past decades [2]. These differences may due to the result of genetic factors and life style such as dietary factors. However, according to epidemiological data, the incidence and mortality of PCa has recently been gradually increasing among Asian men [3]. On the basis of several studies, aging, race, family history, genetics, hormones, and specific dietary components are the best known risk factors of PCa. Among them, increased fat intake has been regarded as a major cause of the increasing incidence and mortality of PCa in Asian men [4-7].
Numerous mechanisms could contribute to PCa progression. Several experiments have been performed to investigate the effect of a high fat diet (HFD) on PCa development. Some researchers have reported the facilitative effect of a HFD on PCa progression in rats or human PCa cell transplanted rodent models [8-11]. However, some studies have not revealed successful correlation between HFD and PCa development in rodent models [12-14]. When these results are taken together, the relationship between HFD and PCa development is not clear.
Transgenic adenocarcinoma mouse prostate (TRAMP) animal is the best characterized model for PCa and closely resembles the progression of PCa in human [15]. The TRAMP model was generated using the minimal probasin (PB) -426/+28 regulatory sequence to restrict SV40 early gene (T and t antigens; Tag) expression in the prostatic epithelium [16-17]. TRAMP mice develop prostatic intraepithelial neoplasia (PIN) and rarely PCa as early as 10 to 12 weeks of age. By 18 to 20 weeks of age, invasive prostate adenocarcinoma can be shown and by 30 to 36 weeks of age, almost all TRAMP mice develop both PCa and metastasis to other organs such as lymph nodes, lungs, and bone [18].
In this study, we show that dietary high fat was related to the PCa progression in the early stage of TRAMP mice and increased serum leptin levels, probably reflecting a change in body fat composition.
Materials and Methods
Animals and diets
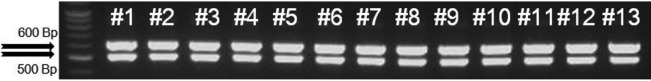
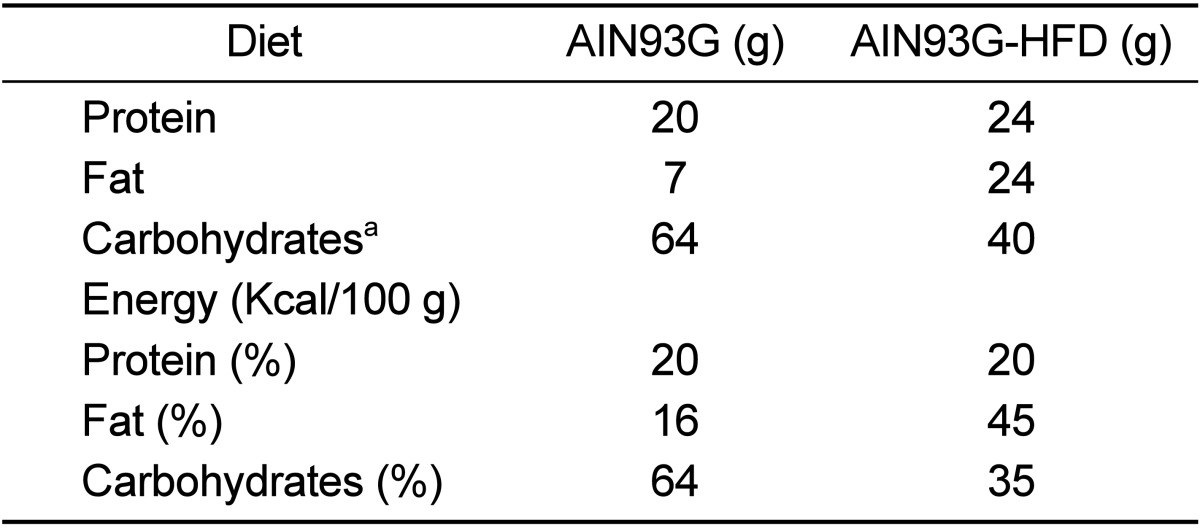
All animal studies were approved by the Institutional Animal Care and Use Committee from the Seoul National University. Mice were kept on a 12-hour light/dark cycle with ad libitum access to food and water. TRAMP mice were obtained from Jackson Laboratory (Bar Harbor, Maine, USA). Generation of transgenic mice, isolation of mouse-tail DNA, and PCR-based screening assay were performed as previously reported [17] (Figure 1). From 4 weeks of age, all mice started to feed with AIN93G diet and separated into two groups randomly at 6 weeks of age. One group (control group, N=6) continued to feed with same AIN93G diet and the other group (experimental group, N=7) started to feed with AIN93G-HFD. All diets were purchased from Hanlive R&D (Seoul, Korea). As shown in Table 1, AIN93G consisted of 16% calories from fats, 64% from carbohydrates, and 20% from proteins. AIN93G-HFD comprised 45% calories obtained from fats, 35% from carbohydrates, and 20% from proteins. Body weight was determined weekly at the same time until they were euthanized at 16 weeks of age.
Tissue weight and preparation
At the end of the experimental period, mice were sacrificed by heart puncture under diethyl ether anesthesia. Epididymal white adipose tissue and urogenital tract (UGT: prostate, bladder, seminal vesicle, testicle) were quickly excised and weighed. Each lobe of prostate (anterior, lateral, dorsal and ventral) was microdissected and prepared for histological grading. All organs were inspected for evidence of tumor.
Morphometric analysis and histopathologic scoring
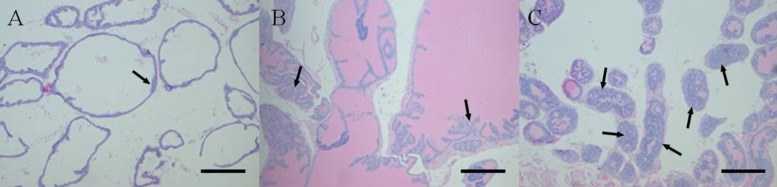
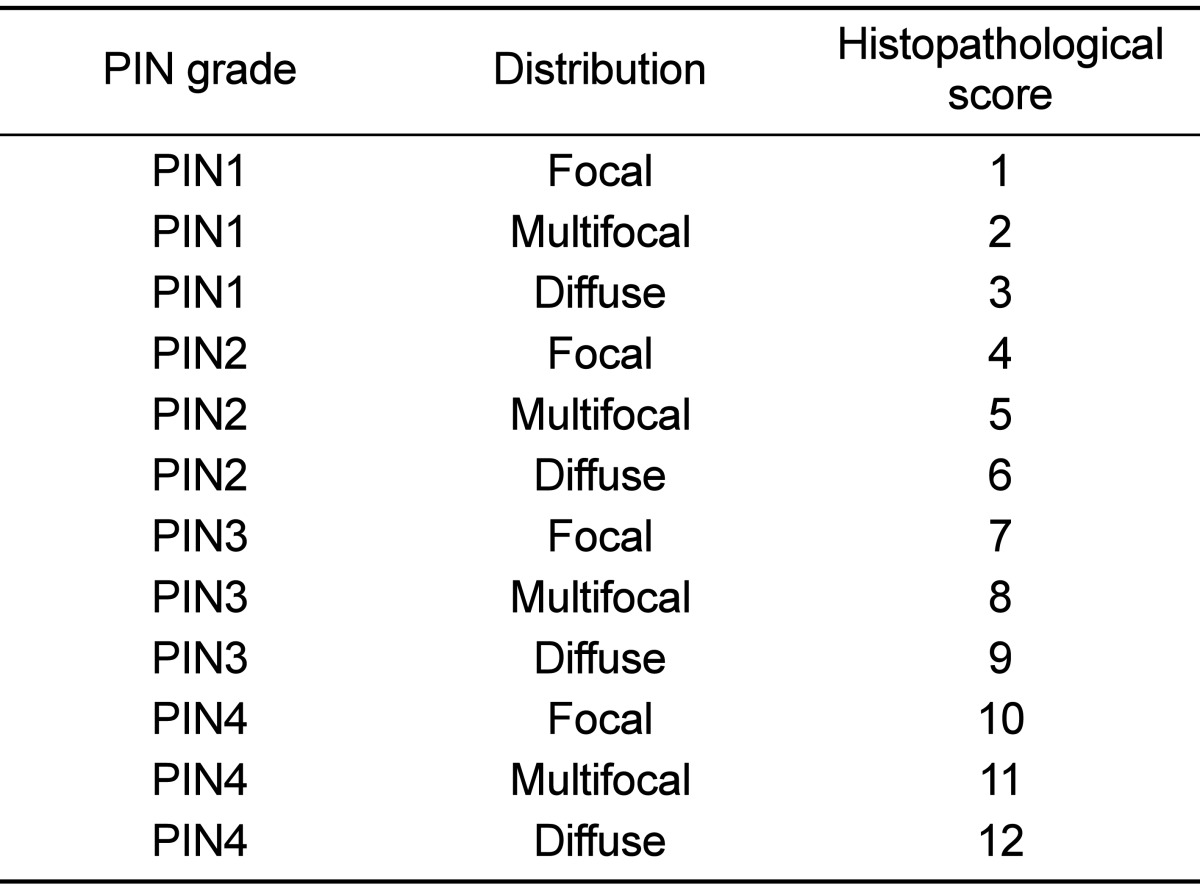
Each lobe of prostate tissues was fixed in 10% buffered formalin, processed in an alcohol-xylene series, and embedded in paraffin. Sections were cut at 2 µm, stained with hematoxylin and eosin (H&E). The histopathologic analysis was performed according to a previously reported method with slight modification [19]. Prostatic intraepithelial neoplasia (PIN) grade was based on the highest score existing in each prostate lobe. PIN was classified into focal, multifocal and diffuse corresponding to one or two foci of the gland containing the lesion, multiple foci or diffuse glandular involvement by PIN, respectively. These criteria for histopathological examination are described in Figure 2. Within same grade, a diffuse lesion was regarded as the most severe and next was a multifocal lesion. With morphometric analysis, prostate sections were scored for the degree of PIN. PIN was scored from 1 (focal type of PIN 1) to 12 (diffuse type of PIN 4) serially in each lobe of prostate (Table 2). Other organs were also evaluated for metastasis.
Ag-NOR staining and counting
The argyrophilic proteins of the nucleolar organizer region (Ag-NOR) staining by silver method was performed as previously reported [20]. After NOR staining, random 100 cells of each prostate lobe were counted in ×400 optic magnification field. Single black dot including dot clump which could not be identified as single was counted for one, and mean number of dots was calculated for each lobe of prostate. To compare with the non-transgenic animals for measurement of cell proliferation, wild type of male C57BL/6 mice (n=5) were sacrificed, and each prostate lobe was stained following same process.
Results
Effects of the AIN93G-HFD on body weight, UGT weight and epididymal white adipose tissue
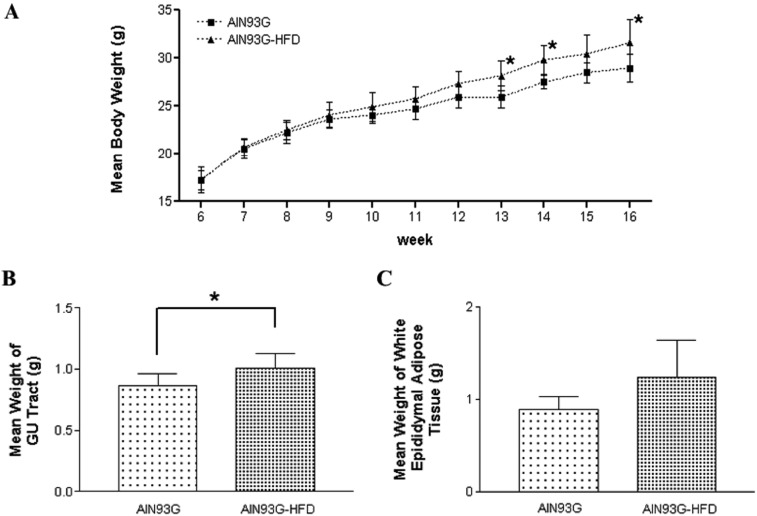
AIN93G-HFD induced more increased body weight in AIN93G-fed group than AIN93G type even after one week of feeding. The mean body weight was significantly different between AIN93G and AIN93G HFD fed group at 13, 14 and 16 weeks age of animals (P<0.05, Figure 3A). The change of mean body weight was from 17.17±1.35 g to 28.91±1.45 g in AIN93G fed group and from 17.14±0.96 g to 31.52±2.39 g in AIN93G-HFD fed group (mean±SD). Mean UGT weight at necropsy was also significantly different between two groups (0.87±0.09 g in AIN93G fed group and 1.00±0.12 g in AIN93G-HFD fed group, mean±SD, P<0.05, Figure 3B). Epididymal white adipose tissue was weighted more in AIN93G-HFD group. However, that was not significantly different between two groups (0.89±0.14 g in AIN93G fed group and 1.24±0.4 g in AIN93G-HFD fed group, mean±SD, P<0.05, Figure 3C). Taken together, AIN93G-HFD positively induced overweight of body and UGT except mean epididymal white adipose tissue weight which was not significantly different.
Histopathological examinations
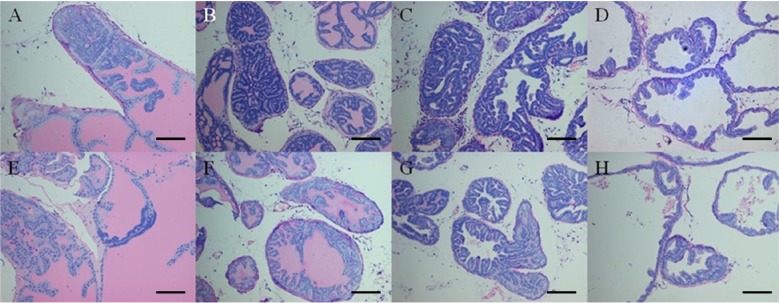
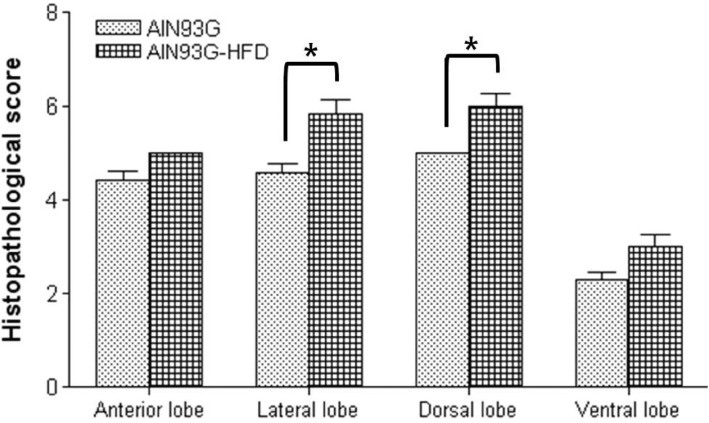
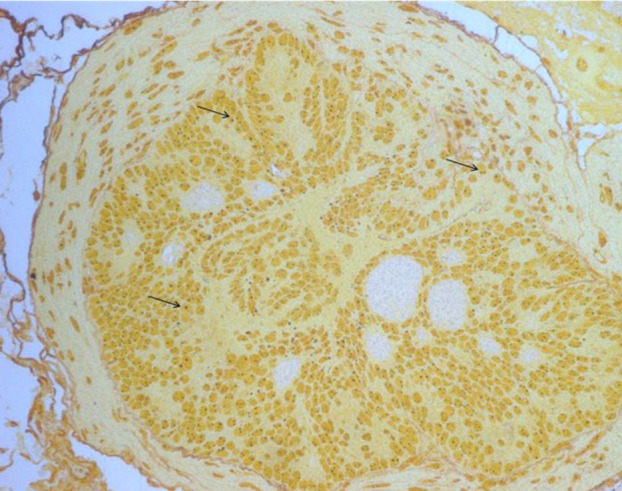
Histopathology of the prostate tissue evaluated in two groups was described in Figure 4 and the mean histopathological scores of each lobe of prostate in both groups were shown in Figure 5. Under light microscopic observation, though the tumor progression was remained at PIN stage in all mice of both groups, the histopathological scores in AIN93G-HFD fed group were significantly higher than AIN93G fed group in lateral and dorsal lobe (P<0.05). In anterior and ventral lobe, mean histopathological scores were higher in the prostate sections of AIN93G-HFD than that of AIN93G fed group. However, there was no significant difference between two groups.
We also assayed other organs including spleen, kidney, liver, and brain with optical and light microscopic observation but we could not find the evidence of metastasis in both groups.
Numerical difference in number of Ag-NOR counts
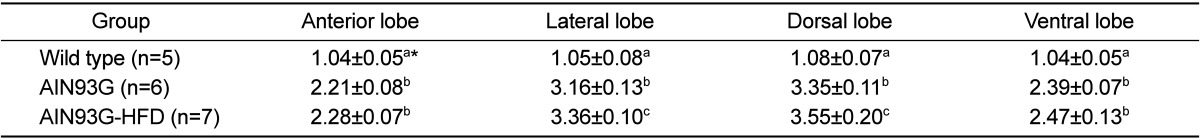
The shape and mean counts of black dots were listed in Figure 6 and Table 3. In the Ag-NOR stained sections, the mean number of black dots in the nuclei of the every prostate lobe in AIN93G and AIN93G-HFD fed group significantly increased compared to that of wild type mice (P<0.05). Between two experimental groups, the number of NORs in every lobe of AIN93G-HFD fed group was larger than that of AIN93G fed group. In dorsal and lateral lobe, mean number of the Ag-NORs showed a significantly increasing in AIN93G-HFD fed group compared to AIN93G fed group (Table 3, P<0.05).
AIN93G-HFD induced increase of serum leptin levels
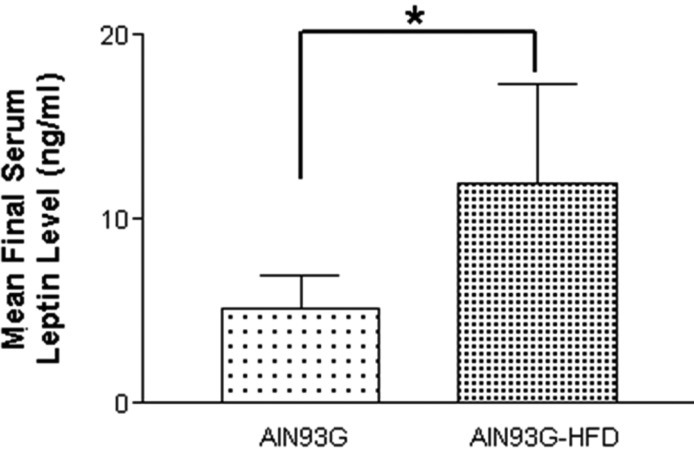
Final serum leptin levels in the two groups of mice were shown in Figure 7. AIN93G-HFD fed group showed approximately 2-fold increased serum leptin levels compared to AIN93G fed group and this difference was significant (5.15±1.80 ng/mL in AIN93G fed group and 11.94±5.39 ng/mL in AIN93G-HFD fed group. Mean±SD, P<0.05).
Correlation coefficients between each result
The correlations between the final body weight, histopathological scores, number of Ag-NORs, and serum leptin levels were analyzed using Pearson's correlation coefficient and listed in Table 4. The mean body weight had strong correlations with serum leptin levels (r=0.780, P<0.05) and Ag-NORs of lateral (r=0.729, P<0.05) and dorsal lobe (r=0.578, P<0.05). The serum leptin levels also had strong correlations with the histopathological scores of lateral (r=0.597, P<0.05) and ventral lobe (r=0.585, P<0.05) and number of Ag-NORs in lateral (r=0.617, P<0.05) and dorsal lobe (r=0.625, P<0.05). In lateral and dorsal lobe, there were also correlations between histopathological scores and number of Ag-NORs (in lateral lobe, r=0.597, P<0.05; in dorsal lobe, r=0.644, P<0.05).
Discussion
In this study, it was demonstrated that a high fat diet influenced prostate tumorigenesis in TRAMP mice. This result correlates with earlier studies for hormonally, chemically induced, or xenogenic cell transplanted rodent models of PCa, suggesting that the consumption of a HFD could promote PCa development [8-11]. The interactions between cancer progression and diet have been described both in experimental and epidemiological data. Especially, among dietary components, increased fat intake has been generally regarded as one factor that may promote cancer progression [4-7]. As fat accumulates in the body, cytokines are secreted by adipose tissue, also referred to as 'adipokines', such as leptin, IL-6, TNF-alpha, heparin-binding growth factor, and vascular endothelial growth factor also increase [21,22]. We measured serum leptin levels as a marker of adiposity and there was a strong correlation (r=0.780, P<0.05) between body weight and leptin levels. Leptin, an adipokine and 16 kDa protein hormone, plays a key role in the regulation of energy intake and energy expenditure, including appetite and metabolism [23].
Several studies have tried to reveal the relationship between leptin and various malignancies. In many types of cancer cells, such as breast [24,25], colorectum [26,27], pancreas [28,29], ovary [30], and lung [31], leptin has been considered to have some correlation with the activation of proliferation-associating cytokines or the proliferation of cancer cells. Also a positive correlation between serum leptin levels and cancers such as breast [32,33], colorectum [34], and endometrum [35,36] has been reported in several studies. Recently, interest has focused on leptin as a possible growth factor in prostate tumorigenesis. Leptin increases cell proliferation via blocking apoptosis [37] and activates mitogen-activated protein kinase (MAPK) signaling in vitro [38].
In this study, AIN93G-HFD fed group weighted more than AIN93G fed group, and showed significantly higher final leptin levels in serum (P<0.05). Moreover, severe histopathological grade (P<0.05) and an increased number of Ag-NOR positive black dots in prostate tissue sections (P<0.05) were also observed in AIN93G-HFD fed group. Consequently, considering the correlations with histopathological scores of lateral (r=0.597, P<0.05) and ventral lobe (r=0.585, P<0.05) or the number of Ag-NORs on lateral (r=0.617, P<0.05) and dorsal (r=0.625, P<0.05) lobes, these results may support the role of leptin in cancer progression in respect to cell proliferation [24-31] and its effect on several cancers [32-36].
The staining of Ag-NOR proteins with silver is an easy and effective method used to determine cell proliferation and prognosis of various tumors [39]. During the cell cycle, ribosomal DNA (rDNA) is located mainly in the nucleolus of interphase cells and NOR is the location of an rDNA gene. After silver staining, structures corresponding to Ag-NORs appear as small black dots. The silver binds to the proteins that regulate the transcription of rDNA which are essential for not only cell growth regulation but also for cell duplication. Therefore, this could directly correlate with Ki67 scores [40] or PCNA scores [41] which are well-established cell proliferation kinetic markers.
In this study, the numbers of Ag-NOR increased significantly in the lateral and dorsal lobes of AIN93G-HFD fed group (P<0.05). The correlation between the number of Ag-NOR and histopathological score was observed clearly in the dorsal lobes (r=0.644, P<0.05) of both groups, which displayed the highest histopathological scores. This tendency was also observed in the lateral lobes (r=0.598, P<0.05), which displayed higher histopathological scores and increased numbers of Ag-NORs when compared to anterior or ventral lobes in the same manner. Compared to the dorsal and lateral lobes, the number of Ag-NORs in the anterior and ventral lobes was small, in agreement with histopathological grade. Considering that PIN is originated from dorsal and lateral lobes and those lobes are the major lesions in the primary stage [42], these differences in histology and number of Ag-NORs correlate with the pathobiology of the TRAMP model.
To demonstrate the biology and progression of PCa, several transgenic mice models have been used in many studies and these models also can be used in therapeutic strategies [43]. TRAMP mice, one of the best established PCa transgenic models, display extensive neoplasia around 18-20 weeks of age [16] and our experiment is designed to prove the effect of a high fat diet on the early stages of PCa. Therefore, it was hypothesized that the earlier stages before the display the extensive neoplasia is the most optimal period to clarify the differences between the two groups in early PCa progression, considering the entire progression of TRAMP mice. This is because within a 30-35 week-time, TRAMP mice can display the entire process of PCa from PIN to poor differentiated adenocarcinoma [16], so to clear the relationship between high fat in diet and effect of that on a specific stage, that is the 'promotion' stage, we finished the procedure at 16 weeks age of animals and remarkable differences between the two groups were observed without the presence of adenoma or adenocarcinoma as expected.
In summary, these data showed that increased adiposity in AIN93G-HFD fed group, which due to the difference in diet components between the two groups, can promote the PCa progression in an early stage. We also demonstrated that TRAMP mice overexpressing the SV40 oncogene and fed with moderate HFD exhibit a more severe histopathological grade and increased Ag-NORs in the lateral and dorsal lobes (P<0.05) that is positively related to serum leptin levels (P<0.05).
In other words, pathophysiologically, the TRAMP model gradually displays lesions from PIN to poorly differentiated adenocarcinoma, within 40 weeks of age without any dietary or hormonal modulations [16]. Nevertheless, dietary high fat accelerates cancer progression in the early stages and affects the entire progression of PCa in TRAMP mice when compared to mice fed a normal diet in this study.
Taken together, the results of this study strongly suggest that the intake of a HFD could increase risk in the promotion stage of PCa, act as a promoter of PCa progression in the early stages, and increase serum leptin levels, probably reflecting a change in body fat composition. Among the risk factors for PCa development, dietary components are the only factor which can be regulated easily, in comparison to other factors, as other factors including aging, race, family history, genetics, and hormones cannot be regulated or selected. Our data therefore provide evidence that the regulation of dietary components can delay the progression of PCa.

 XML Download