

 PDF
PDF ePub
ePub Citation
 Print
Print


Diabetes is an epidemic metabolic disorder characterized by high blood glucose concentration in response to insufficient production of insulin or an inappropriate insulin response in target cells [1]. Traditionally, many therapeutic strategies such as islet transplantation, insulin administration, and the development of novel drugs have been attempted for the treatment of such metabolic defects. Of these strategies, most studies have focused on the identification of molecules that have the ability to enhance insulin secretion as well as improve insulin sensitivity [2]. Specifically, molecules such as insulin analogues, oral hypoglycemic agents, various complements, and alternative medicines have been developed using chemical synthesis or extraction from natural materials [3]. Indeed, many compounds, natural products, and herbal medicines have been recommended for the treatment of diabetes. There are about 410 medicinal plants, including L. platyphylla Wang et Tang, Momordica charantia L., Pterocarpus marsupium Roxb., and Trigonella foenum graecum L., that are commonly used as anti-diabetics, but only 109 of them have been confirmed in terms of their mechanisms of action [4,5].
L. platyphylla is a valuable anti-diabetes candidate as it is widely distributed in temperate climate regions of the northern hemisphere [6]. In traditional Oriental herbal medicine, L. platyphylla is used for the treatment of asthma, bronchial and lung inflammation, obesity, diabetes, neurodegenerative disease, and atopic dermatitis [7-12]. Of these therapeutic effects, the potential of L. platyphylla as a therapy for obesity and diabetes has been intensively researched. Gyeongshingangjeehwan containing a large amount of L. platyphylla was previously shown to effectively prevent obesity as well as hypertriglyceridemia through inhibition of feeding and activation of hepatic peroxisome proliferator-activated receptor-alpha in OLETF male rats [10]. The homoisoflavone-enriched fraction of methanol extract of L. platyphylla has been shown to stimulate insulin-stimulated glucose uptake in 3T3-L1 adipocytes through an increase in Glut-4 levels in the plasma membrane [8]. Furthermore, our group has isolated several novel compounds from L. platyphylla using methanol extraction. Of these, LP9M80-H has been shown to dramatically induce insulin secretion as well as differentially regulate the expression of Glut-1 and Glut-3 through the mitogen-activated protein kinase (MAPK) and phosphoinisitide-3-kinase (PI3-K) signaling pathways [13]. Moreover, aqueous extracts of L. platyphylla were shown to induce insulin secretion from pancreatic islets as well as increase the expression of Glut in hepatocytes [14]. However, the effects of aqueous extract of L. platyphylla on diabetes, as well as its mechanism of action in a type II diabetes model displaying pre-diabetes and obesity, have not been studied.
Therefore, in this study, we determined whether AEtLP could improve diabetes and obesity-related defects in both pre-diabetes and obesity stage of OLETF rats. These results provide strong evidence that AEtLP promotes the stimulation of insulin secretion and inhibition of fat accumulation.
Materials and Methods
Care and use of OLETF rats
All animal experimental procedures were approved by the Institutional Animal Care and Use Committee (IACUC) of Pusan National University (Approval Number PNU-2010-00098). Animals were handled in a Pusan National University-Laboratory Animal Resources Center accredited by the Korea FDA in accordance with USA NIH guidelines (Accredited Unit Number-000996). All mice were housed under specific pathogen-free (SPF) conditions and a strict light cycle (light on at 06:00 h and off at 18:00 h), and they were given a standard irradiated chow diet (Purina Mills Inc., St. Louis) ad libitum. The 10-week-old LETO (Long-Evans-Tokushima-Ostuka) and OLETF rats used in this study were supplied by Tokushima Research Institute (Otsuka Pharmaceutical, Tokushima, Japan).
Preparation of AEtLP
AEtLP was prepared according to the preparation process described previously [14]. Firstly, L. platyphylla roots were collected from plantations in the Miryang area of Korea and dried with a hot-air drier (JSR Instruments, Uttaranchal, India) at 60℃. Voucher specimens (WPC-11-010) were deposited at the Functional Materials Bank of PNU-Wellbeing RIS Center at Pusan National University. Six hundred grams of dry roots were reduced to powder using an electric blender. Following water extraction, the extract was purified at 100℃ for 2 h using circulated extraction equipment (IKA Labortechnik, Staufen, Germany) after adding 2 L of distilled water. Composition of AEtLP has been measured in our previous study [14]. Extract solutions were concentrated into dry pellets using a rotary evaporator (EYELA, Tokyo, Japan) and stored at -80℃ until use.
Treatment of AEtLP and detection of glucose level
OLETF rats were randomly divided into three groups (n=5 per group): a vehicle-treated group, 5% AEtLP (AEtLP5)-treated group, and 10% AEtLP (AEtLP10)-treated group. The vehicle-treated group received a consistent volume of water daily via gavage, whereas the treatment groups received 15 mL/g body weight/day of AEtLP diluted in distilled water via gavage in order to obtain the two different final concentrations. At 2 weeks after commencement of AEtLP and vehicle treatment, all animals were immediately sacrificed using CO2 gas to acquire blood and tissue samples, which were stored in Eppendorf tubes at -70℃ until assayed. In addition, the blood glucose concentration was detected prior to sacrifice as well as after 24 h of fasting using the sensitive strip of the Blood Glucose Monitoring System (I-sens, Seoul, Korea).
Serum biochemical analysis
After final administration of AEtLP, all rats were fasted for 24 h, after which blood was collected from abdominal veins of mice. Serum was obtained by centrifugation of blood incubated for 30 min at room temperature. Serum biochemical components were assayed using an Automatic Serum Analyzer (HITACHI 747, Japan). All assays were measured using fresh serum in duplicate.
Quantification of insulin and adiponectin by ELISA
The concentrations of insulin and adiponectin in sera of LETO and OLETF rats were measured by following the ultra-sensitive assay procedure of the Mercodia Rat Insulin ELISA kit (Mercodia; Cat. 10-1137-01, Sweden) and Adiponectin ELISA kit (Adipogen Inc., Korea). Serums and standards were incubated in a plate shaker at 100-150 rpm at room temperature for 2 h on antibody-coated plates. Wells were then washed six times using an automatic plate washer (Hoefer; PV100, USA). HRP conjugate was added to all plates, followed by incubation in a shaker for 30 min at room temperature. The reaction was then terminated by addition of 50 mL of stop solution (0.5 M H2SO4). The plates were read at 450 nm using a Molecular Devices Vmax Plate reader (Sunnyvale, CA, USA).
Immunohistochemistry
Immunohistochemical analysis was performed as previously described [13]. Briefly, the distribution of insulin protein was observed using optical microscopy after fixing the pancreas tissue samples in 5% formalin for 12 h, embedding the tissues in paraffin, and acquiring sections of 4 µm thickness. Each section was deparaffinized with xylene, rehydrated, and pretreated for 30 min at room temperature with a phosphate-buffered saline (PBS)-based blocking buffer containing 10% goat serum. The samples were then incubated with mouse anti-insulin antibody (Cell Signaling Technology, Boston, MA, USA) diluted 1:100-1:200 in PBS-blocking buffer. Antigen-antibody complexes were visualized with goat anti-rabbit HRP-conjugated streptavidin secondary antibody (Histostain-Plus Kit, Zymed Laboratories) diluted 1:1,500 in PBS-blocking buffer. 3,3'-Diaminod-benzidine (DAB) substrate (Invitrogen, Carlsbad, CA, USA) and a model GS-690 imaging densitometer (Bio-Rad Laboratories, Hercules, CA, USA) were used to detect insulin proteins.
Western blot
Proteins from liver tissues of AEtLP- and vehicle-treated OLETF rats were separated by 4-20% sodium dodecyl sulfate-polyacrylamide gel electrophoresis (SDS-PAGE) for 3 h, after which the resolved proteins were transferred to nitrocellulose membranes for 2 h at 40 V. Each membrane was incubated separately with primary antibody: anti-Glut-1 (ab40084; Abcam, Cambridge, UK), anti-Glut-3 (ab15311; Abcam), anti-extracellular signal-regulated kinase (anti-ERK; sc-94; Santa Cruz Biotechnology, Santa Cruz, CA, USA), anti-phosphorylated (p)-ERK (sc-7383; Santa Cruz Biotechnology), anti-c-Jun N-terminal kinase (anti-JNK; #9252; Cell Signaling Technology, Boston, MA, USA), anti-p-JNK (#9251, Cell Signaling Technology), anti-p38 (#9212, Cell Signaling Technology), anti-p-p38 (#9211, Cell Signaling Technology), anti-Akt (#9272, Cell Signaling Technology), anti-p-Akt (#4058, Cell Signaling Technology), and anti-actin (A5316, Sigma-Aldrich, Saint Louis, MO, USA) overnight at 4℃. The membranes were then washed with washing buffer (137 mM NaCl, 2.7 mM KCl, 10 mM Na2HPO4, 2 mM KH2PO4, and 0.05% Tween 20) and incubated with horseradish peroxidase-conjugated goat anti-rabbit IgG (Zymed Laboratories, South San Francisco, CA, USA) at diluted 1:1,000 at room temperature for 2 h. The membrane blots were developed using Chemiluminescence Reagent Plus kits (Pfizer, New York, NY, USA and Pharmacia, New York, NY, USA).
Statistical analysis
Tests for significance between AEtLP and vehicle-treated groups in OLETF rats were performed using a One-Way ANOVA test of variance (SPSS for Windows, Release 10.10, Standard Version, Chicago, IL). Tests for significance between the LETO and OLETF groups were performed using a Post-Hoc test (SPSS for Windows, Release 10.10, Standard Version, Chicago, IL) of variance, and significance levels are given in the text. All values are reported as the mean±standard deviation (SD). The level of probability for statistical difference was established at P<0.05.
Go to : 
Results
Effects of AEtLP on body weight
To investigate whether AEtLP treatment affects the progress of obesity, we first measured body weights of 10-week-old LETO and OLETF rats after AEtLP treatment for 2 weeks. In accordance with our previous study, vehicle-treated OLETF rats showed a higher body weight than LETO rats. Following AEtLP treatment, body weights slightly decreased in AEtLP5- and AEtLP10-treated OLETF rats (Figure 1A). Therefore, these results indicate that AEtLP treatment did not affect body weight of 10-week-old OLETF rats, although there is a slight decrease in body weight.
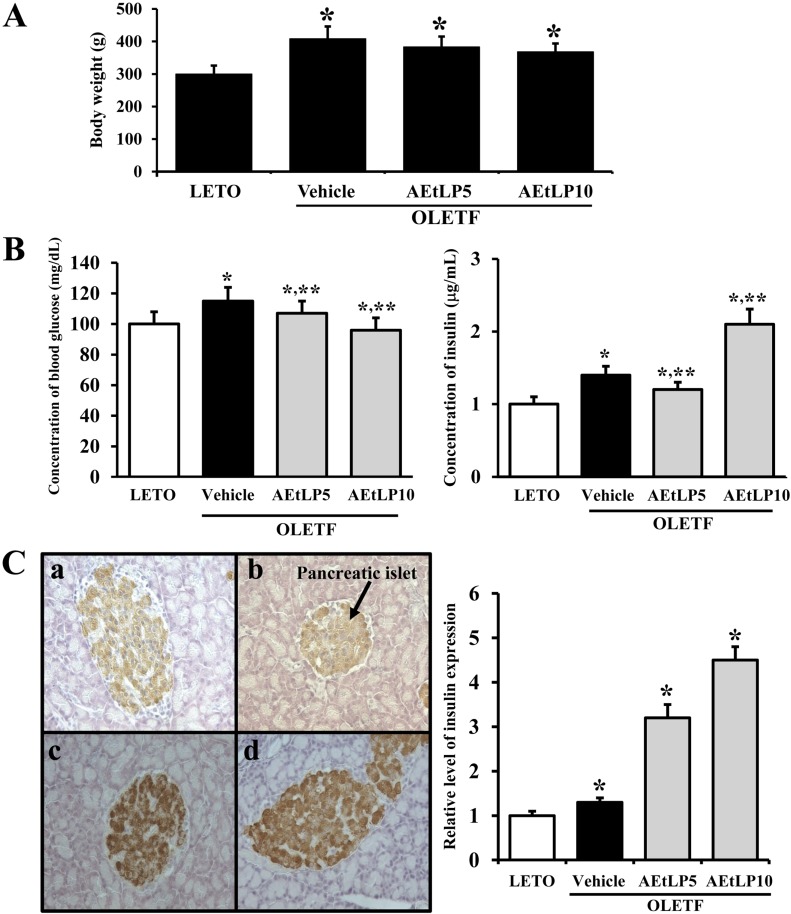 | Figure 1Effects of AEtLP on body weight and blood glucose and insulin levels. (A) Body weight analysis. At 24 h after final AEtLP treatment, body weight of rats was measured with an electronic balance electronic scale. (B) Glucose and insulin concentration analysis. Blood was collected from abdominal veins of vehicle- and AEtLP-treated OLETF rats. Glucose level was measured using a CareSence Kit, and insulin level was determined using an insulin ELISA kit. (C) Immunohistochemistry. Expression level of insulin was detected in pancreatic islets of vehicle-treated and AEtLP-treated OLETF rats by immunostaining analysis. High intensity was observed in pancreatic islets of AEtLP10-treated OLETF rats as compared with vehicle-treated mice at 200x magnification. Data represent the mean±SD from three replicates. *P<0.05 is the significance level compared to LETO rats. **P<0.05 is the significance level compared to vehicle-treated group in OLETF rats.
|
Effects of AEtLP on insulin secretion and glucose homeostasis
To ascertain whether AEtLP treatment alters the regulation of glucose metabolism during the pre-diabetes and obesity stage of OLETF rats, serum concentrations of glucose and insulin were measured in AEtLP-treated and vehicle-treated mice after 2 weeks of treatment. The glucose concentration was slightly higher in OLETF rats compared to LETO rats. Further, their glucose levels were slightly decreased by 7% and 18%, respectively following AEtLP treatment (Figure 1B). On the other hand, insulin concentrations showed the reverse patterns as those of glucose concentrations. Basically, OLETF rats showed a high level of insulin compared to LETO rats. In the AEtLP-treated groups, a significant increase in insulin level was only evident in OLETF rats treated with AEtLP10. In the case of the AEtLP5-treated group, insulin concentration slightly decreased compared to vehicle-treated OLETF rats (Figure 1B).
To detect the localization and distribution of insulin protein in pancreatic tissues, immunoreactivity of insulin protein was analyzed using optical microscopy after treatment with specific antibody. The highest intensity of insulin immunostaining was spread throughout the pancreatic islets of AEtLP5- and AEtLP10-treated OLETF rats (Figure 1C). These results support the suggestion that higher level of AEtLP treatment could induce the downregulation of glucose by stimulating insulin secretion in 10-week-old OLETF rats with pre-diabetes. Especially, AEtLP10 was more effective than the other concentrations in mediating its anti-diabetic effects even under the pre-diabetic condition.
AEtLP effects on abdominal fat mass and adiponectin concentration
Next, to test whether AEtLP treatment affects abdominal fat accumulation in 10-week-old OLETF rats with obesity, fat mass was measured in rats from each group. Before AEtLP treatment, vehicle-treated OLETF rats showed higher fat mass than LETO rats. Especially, the weight of abdominal fat in vehicle-treated OLETF rats increased by 179% compared to LETO rats. However, abdominal fat mass significantly decreased in AEtLP5- and AEtLP10-treated OLETF rats (Figure 2A). Therefore, these results suggest that AEtLP treatment was a significant effect on reducing body fat mass of 10-week-old OLETF rats.
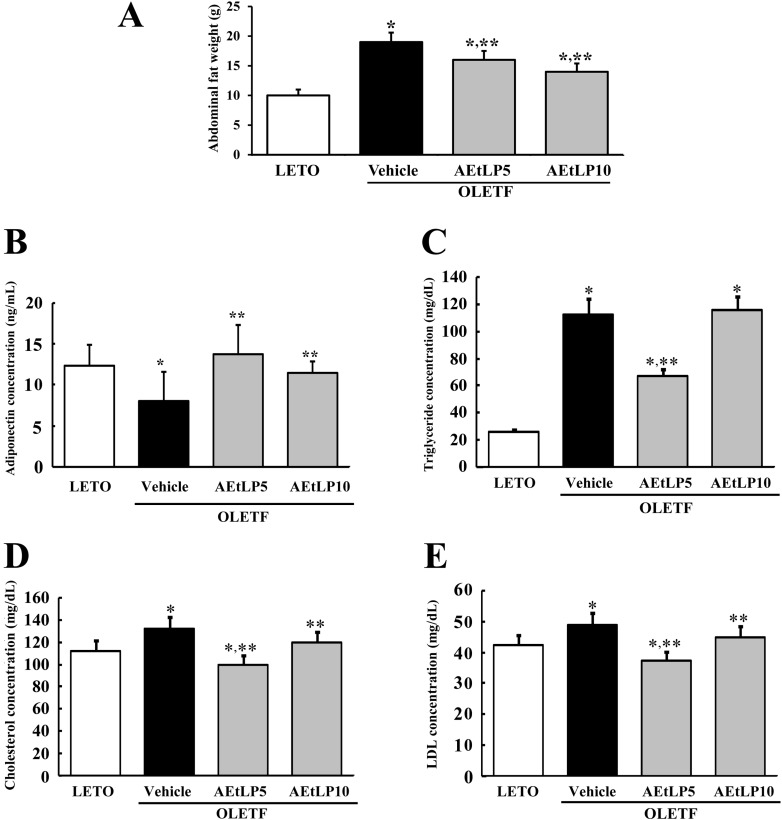 | Figure 2Effects of AEtLP on abdominal fat mass and lipid concentration. (A) At 24 h after final AEtLP treatment, abdominal fat collected from abdominal region of rats and their weight was measured with an electronic balance. Blood was collected from abdominal veins of rats, and (B) adiponectin level in serum was analyzed using an ELISA kit. This kit has 0.1 ng/mL of sensitivity, and the interassay coefficient of variation was between 2.86-5.17. (C-E) Levels of triglycerides, cholesterol, and LDL were analyzed in triplicate using a serum biochemical analyzer. Data represent the mean±SD from three replicates. *P<0.05 is the significance level compared to LETO rats. **P<0.05 is the significance level compared to vehicle-treated group in OLETF rats.
|
To investigate the effect of AEtLP treatment on adiponectin regulation, the concentration of adiponectin was measured in the serum of OLETF rats. As shown in Figure 2B, the adiponectin concentration was lower in vehicle-treated OLETF rats compared to LETO rats. However, the level of adiponectin in AEtLP-treated OLETF rats dramatically increased compared to LETO rats although high increase rate was detected in AEtLP5-treated rats. These results show that AEtLP5 treatment induced strong stimulation of adiponectin in both pre-diabetes and obesity stage of OLETF rats.
AEtLP effects on lipid concentration in OLETF rats
Increased contents of lipids, including triglycerides, cholesterol, and LDL are important features of obesity [15]. To investigate whether or not AEtLP treatment can induce changes in lipid concentration, the levels of triglycerides, cholesterol, and LDL were measured in the serum of OLETF rats. Basically, the concentrations of triglycerides, cholesterol, and LDL were higher in vehicle-treated OLETF rats than LETO rats, although the increase ratios varied (Figure 2C-E). Following AEtLP treatment, a significant decrease in triglyceride concentration was observed in AEtLP5-treated OLETF rats, whereas AEtLP10-treated OLETF rats maintained their triglyceride level similar to the vehicle-treated group (Figure 2C). Further, the concentration patterns of cholesterol and LDL were similar to that of triglycerides. Specifically, significant decreases in cholesterol and LDL were detected in the AEtLP5-treated group compared to vehicle-treated group. AEtLP10-treated OLEFT rats showed slight decreases in cholesterol and LDL (Figure 2D and E). Therefore, the above results suggest that AEtLP treatment reduced the concentration of lipids in 10-week-old OLETF rats showing obesity.
Effects of AEtLP on regulation of Glut-1 expression through the insulin signaling pathway
To investigate the regulatory mechanism of Glut-1 expression via the insulin signaling pathway following AEtLP treatment, changes in Glut-1 expression and Akt phosphorylation were detected in liver tissues of OLETF rats treated with AEtLP. Glut-1 expression in vehicle-treated OLETF rats was very similar with that in LETO rats. Following AEtLP treatment, the level of Glut-1 expression slightly decreased compared to vehicle-treated OLETF rats. However, there was no significant difference between AEtLP5- and AEtLP10-treated OLETF rats (Figure 3A). Further, the level of Akt phosphorylation was lower in OLETF rats than LETO rats. This level was maintained in AEtLP5-treated rats, although it dramatically increased in AEtLP10-treated rats (Figure 3B). These results show that AEtLP10 induced a decrease in Glut-1 expression via Akt phosphorylation in the insulin signaling pathway during both pre-diabetes and obesity stage of OLETF rats.
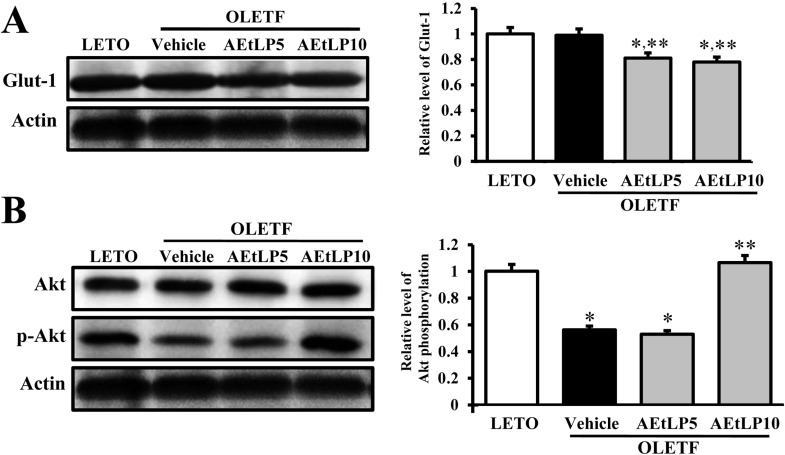 | Figure 3Glut-1 expression and its regulatory mechanism in liver. Tissue lysates were prepared from liver tissues of LETO, vehicle-, and AEtLP-treated OLETF rats. Fifty micrograms of protein per sample was immunoblotted with antibody for each protein. Glut-1 protein expression was detected with primary antibodies for Glut-1 (A), Akt and p-Akt (B), and horseradish peroxidase-conjugated goat anti-rabbit IgG. Intensity of each protein was calculated using an imaging densitometer. Three out of 4 to 5 rats per group were assayed in duplicate by western blot. Data represent the mean±SD. *P<0.05 is the significance level compared to LETO rats. **P<0.05 is the significance level compared to vehicle-treated group in OLETF rats.
|
Effects of AEtLP on regulation of Glut-3 expression through the insulin signaling pathway
The regulation of Glut-3 biosynthesis can be regulated by the downstream signaling pathway of insulin receptor, which includes Ras, Raf, MEK, and MAPK [16]. Of these intermediate proteins, MAPK, which is comprised of three major components, is considered to be crucial. To investigate the effects of AEtLP on the regulatory mechanism and biosynthesis of Glut-3, changes in Glut-3 expression and MAPK phosphorylation were analyzed using Western blot. Basically, expression of Glut-3 in vehicle-treated OLETF rats was higher than in LETO rats. However, this level significantly decreased in both AEtLP5- and AEtLP10-treated rats. Further, there was no significant difference between the two AEtLP treatment levels (Figure 4A). Further, to identify the regulatory mechanism of Glut-3 expression, the phosphorylation levels of three components in the MAPK pathway were measured in liver tissues of OLETF rats. Of the three components, the phosphorylation level of p38 markedly increased depending on the concentration of AEtLP. On the other hand, the phosphorylation level of JNK was lowest in the AEtLP10-treated group, whereas its level was maintained in the AEtLP5-treated group. However, there were no appreciable differences between the vehicle-treated group and AEtLP-treated group concerning the expression levels of ERK and p-ERK (Figure 4B). The results suggest that expression of Glut-3 was tightly correlated with activation of NJK phosphorylation upon AEtLP treatment, although their levels were slightly correlated with inhibition of p38 phosphorylation.
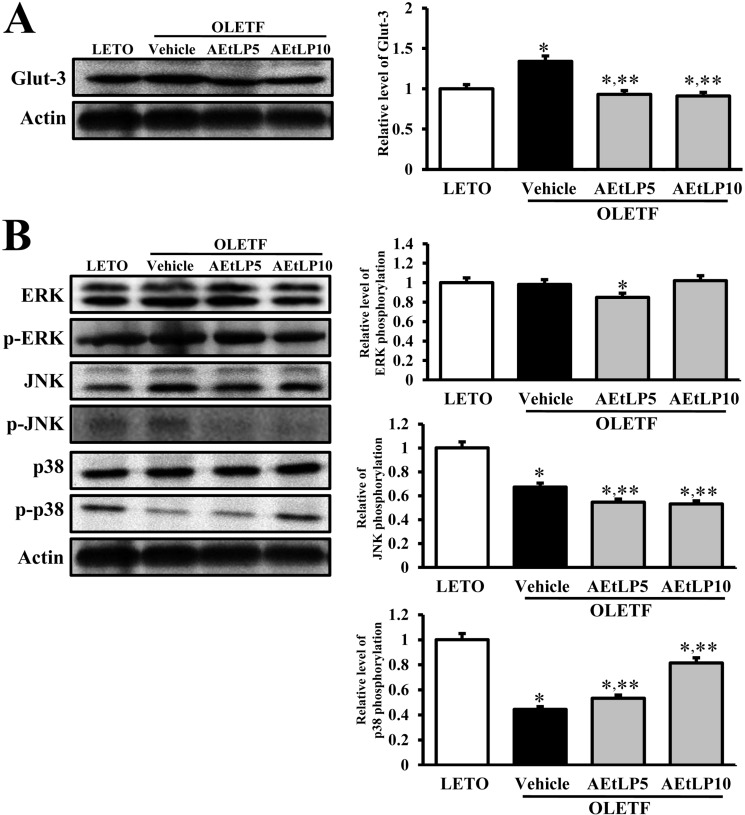 | Figure 4Glut-3 expression and its regulatory mechanism in the liver. Fifty micrograms of protein per sample was immunoblotted with antibody for p-ERK, ERK, p-JNK, JNK, p38, p-p38, or actin. Intensity of each protein was calculated using an imaging densitometer. Three out of 4 to 5 rats per group were assayed in duplicate by western blot. Data represent the mean±SD. *P<0.05 is the significance level compared to LETO rats. **P<0.05 is the significance level compared to vehicle-treated group in OLETF rats.
|
Go to :
Discussion
L. platyphylla possesses therapeutic effects on various chronic diseases. Of these, its antiinflammatory and antimicrobial effects have been well confirmed. Previously, several medicinal plant extracts were screened and determined to have inhibitory effects on sortase, an enzyme found in most Gram-positive bacteria that is important in bacterial adhesion. Among the 80 medical plants tested, L. platyphylla, Cocculus trilobus, Fritillaria verticillata, and Rhus verniciflua demonstrated the strongest antibacterial activities [17]. Further, inhibition of airway inflammation and hyperresponsiveness were detected in a murine model of asthma by modulating the Th1/Th2 cytokine imbalance following L. platyphylla treatment [7]. Meanwhile, L. platyphylla has displayed therapeutic potential in human subjects suffering from Alzheimer's disease (AD). Especially, the steroidal saponin spicatoside A isolated from L. platyphylla induces neuritic outgrowth similar to nerve growth factor (NGF) and has been shown to activate extracellular signal-regulated kinase 1/2 (ERK1/2) as well as phosphatidy-linositol 3-kinase (PI3-kinase/Akt) in PC12 cells [11]. Further, LP-M, a novel butanol extract isolated from L. platyphylla, was shown to stimulate neuronal cell survival and neuritic outgrowth in the hippocampi of mice through Akt/ERK activation in the NGF signal pathway [18]. Recently, L. platyphylla was found to have a novel effect on atopic dermatitis. Specifically, symptoms of atopic dermatitis induced by phthalic anhydride were significantly relieved by aqueous extracts of L. platyphylla in NC/Nga mice [19]. Our study tried to verify the therapeutic effects of L. platyphylla in a type II diabetes model displaying obesity. These new findings in our study constitute strong evidence of the therapeutic effects of L. platyphylla in both pre-diabetes and obesity stage of OLETF rats.
OLETF rats, a well known animal model of obesity and diabetes, were produced by selective breeding rats displaying spontaneous obesity in an outbred colony of Long Evans rats at Otsuka Pharmaceuticals [20]. These rats consume 30% more food than LETO rats, as they possess a food intake disorder induced by defective cholecystokinin (CCK) 1 receptor. Therefore, they become 35% more obese compared to LETO rats [21]. However, OLETF rats show different properties from other obesity rat models in terms of fat deposition. Most of the fat in OLETF rats is predominately deposited in intra-abdominal or visceral areas, whereas fat in Zucker rats is deposited in subcutaneously [22]. In our study, the body weight of 10-week-old OLETF rats showing pre-diabetes and obesity was significantly higher than that of LETO rats. Furthermore, abdominal fat mass dramatically accumulated in OLETF rats. Therefore, the OLETF rats used in this experiment showed spontaneous obesity although the glucose concentration was only slightly increased in the same rats.
It has been reported that certain aqueous extracts display anti-diabetic activity. Aqueous extract of Mours rubra leaves is known to decrease the level of glucose in a dose-dependent manner. Especially, treatment with 400 mg/kg of this extract has been shown to significantly reduce the level of glycosylated hemoglobin as well as restore serum lipid levels [23]. Further, aqueous extract of Cassia auriculata leaves was shown to improve impaired glucose homeostasis by ameliorating carbohydrate metabolic pathways [24]. Our previous study investigated the anti-diabetic effects of AEtLP in a type I diabetes model. Specifically, aqueous extracts were obtained from dried roots of L. platyphylla, and three concentrations were screened for their effects on diabetes and obesity. Of the three concentrations, 10% concentration of AEtLP effectively induced downregulation of glucose as well as upregulation of insulin [14]. In this study, although OLETF rats had showed the pre-diabetic condition, the glucose concentration slightly decreased in AEtLP5- and AEtLP10-treated rats, similar to the results using the type I diabetes model. The highest decrease in the level of glucose occurred in the AEtLP10-treated OLETF rats. Therefore, AEtLP10 may be considered as the optimal concentration to induce downregulation of glucose in the diabetic condition of type I as well as the pre-diabetic condition of type II diabetes models. In addition, this pattern of glucose regulation was observed for insulin regulation.
Adiponectin is considered as an important hormone that participates in the regulation of fatty acid catabolism and glucose regulation [25]. This hormone also contributes to the suppression of metabolic disorders such as diabetes, obesity, atherosclerosis, and non-alcoholic fatty liver disease [25,26]. Most of studies had been reported that the adiponectin concentration was higher in the serum of LETO than that of OLETF rats. This level in OLETF rats was significantly recovered to LETO level by a various factor including food restriction, rosiglitazone, bezafibrate and thiazolidinediones [27-29]. Furthermore, the fat mass and adipocyte size related to the function on adiponection were used to detect the effects of several compounds on the adipogenesis [30]. The results of our study are in agreement with the above data based on adiponectin concentration and fat mass, although the rate of increase varied from these.
Meanwhile, we investigated the therapeutic effects of AEtLP on hypercholersterolemia induced by various factors. Of these factors, a high fat diet has been shown to induce increases in cholesterol, triglycerides, HDL, and LDL levels in male SD rats [31]. Under diabetic conditions induced by streptozotocin, the levels of total cholesterol, HDL, triglycerides, creatinine, and urea are significantly higher than under non-diabetic conditions [15]. The results from our study were in accordance with previous studies, although the rates of increase and decrease varied. Especially, in this study, maximum suppression was observed in AEtLP5-treated OLETF rats, whereas AEtLP10-treated rats did not show any change in serum lipid concentration.
Glucose transporters ferry glucose and related hexose molecules through biological membranes according to a model of alternate conformation [32]. Of the numerous glucose transporters, the biosynthesis of Glut-1 and Glut-3 is specifically regulated by the insulin signaling pathway in the liver, Glut-1 by the PI3-K pathway and Glut-3 by the Raf/Ras/MAPK pathway. In the PI3-K pathway, Akt (protein Ser/Thr kinase B), which plays an important role in cell proliferation and insulin action in cells, is activated by PDK1 [33]. Activated Akt plays a role in regulating the biosynthesis of Glut-1, a high-affinity glucose transporter expressed in most types of cells [34]. In our previous study using a type I diabetes model, we showed that biosynthesis of Glut-1 in the liver markedly increases depending on AEtLP concentration. Further, this alteration coincides with a change in Akt phosphorylation [14]. However, the reverse pattern of Glut-1 expression was observed using OLETF rats in the current study. As shown in Figure 3, AEtLP5- and AEtLP10-treated OLETF rats maintained low levels of Glut-1 expression. However, the phosphorylation level of Akt significantly increased only in AEtLP10-treated OLETF rats. In addition, Glut-3 biosynthesis is mediated by the Raf/Ras/MAPK pathway for the regulation of glucose uptake [16]. The MAPK kinase pathway is activated by Grb2 binding to Tyr-phosphorylated Shc or IRS via its SH2 domain. This resulting signal leads to the expression of genes associated with glucose metabolism as well as induction of mitosis in cells [33]. In previous study using type I model, biosynthesis of Glut-3 in the liver significantly decreased upon treatment with all three concentrations of AEtLP. These regulatory patterns corresponded with the activation of ERK phosphorylation more so than with phosphorylation of JNK and p38 [14]. In this study, reduced Glut-3 expression was similarly observed. However, there were significant changes in the activation of MAPK pathway components. In the type I model, AEtLP treatment induced an increase in ERK phosphorylation as well as a decrease in JNK phosphorylation, whereas p38 phosphorylation was maintained at control level [14]. However, in the current study using OLEFT rats, the increase in p38 phosphorylation and decrease in JNK phosphorylation were detected in AEtLP-treated OLETF rats. ERK phosphorylation was not altered in OLETF rats treated with any concentration of AEtLP.
Taken together, these results suggest a signaling mechanism for the anti-diabetic activity of AEtLP in OLETF rats displaying pre-diabetes and obesity. AEtLP can presently be considered as a therapeutic candidate for diabetes and obesity.
Go to :
 XML Download