

 PDF
PDF ePub
ePub Citation
 Print
Print


Diabetes mellitus (DM) is an epidemic medical challenge that threatens the health and life quality of people worldwide. DM impairs metabolic, neural, and vascular function, and thus has profound impacts on different systems and organs in the body. Despite continuous efforts to study the etiological mechanisms of DM, no cure has been found. DM development may be multifactorial, and the skeletomuscular system, which is affected by insulin, is important to the progression of the disease [1].
A general loss of skeletal muscle mass is characteristic of many chronic diseases, including renal failure, diabetes, cancer, and heart failure [2]. Although reduced food intake plays a role in the development of muscle wasting, it is now widely accepted that metabolic changes such as reduced anabolism, enhanced catabolism, and the perturbation of hormonal and cytokine homeostasis are crucially involved in the pathogenesis of muscle atrophy [3,4]. Muscle atrophy results from an altered balance between the rates of protein synthesis and protein degradation. In particular, data obtained from both experimental and clinical studies suggest that enhanced protein breakdown is the most important factor in pathological muscle wasting [4]. Three major proteolytic pathways have been described in the skeletal muscle: the lysosomal system, the cytosolic Ca2+-activated system, and the ATP-ubiquitin-dependent proteolytic pathway [5]. The relative roles of these different systems in causing muscle protein depletion in skeletal muscle atrophy are not well defined [4].
Recently, a number of studies have suggested that autophagy is crucial for cell protection and survival [6,7]. The autophagic-lysosomal system plays an important role in the degradation and turnover of intracellular proteins, lipids, glycogens, and organelles in skeletal muscle [8,9]. Autophagy involves the turnover of long-lived macromolecules and organelles via the lysosomal degradative pathway [10,11]. During autophagy, isolation membranes envelop a portion of the cytosol containing nonspecific cytosolic components and selectively target toxic protein aggregates [12], intracellular pathogens [13], or organelles such as mitochondria [14]. The autophagosomes are then delivered to the lysosome and form the autophagolysosome, the contents of which are subsequently degraded by lysosomal hydrolases. Recent studies have reported that Apg12, Apg5, and microtubule-associated protein-1 light chain-3 (LC3) are involved in the process of autophagy [15,16]. LC3 is associated with the autophagosome membrane after processing and plays a critical role in the formation of autophagosomes [17]. LC3 is present in various mammalian cells, including myocytes. Two forms of LC3, LC3-I and -II, are produced posttranslationally in various cells. LC3-1 occurs in the cytoplasm, whereas LC3-II occurs in the autophagosome membrane. LC3-II was the first mammalian protein found to specifically associate with autophagosome membranes, and the amount of LC3-II is correlated with the extent of autophagosome formation [18]. Although this pathway has been well characterized, it is not clear how streptozotocin (STZ)-induced diabetes affects this process. Furthermore, the mechanism by which therapeutic exercise affects the adaptation of skeletal muscle in relation to autophagy remains unknown.
Exercise has long been recognized to have important health benefits for people with diabetes. The molecular events underlying exercise-induced adaptations in diabetic muscle remain largely undefined. The beneficial effects of aerobic exercise on the structural and functional adaptations of muscle may be mediated through the activation of various signaling molecules, which activate signaling cascades involved in regulating changes in gene expression [19-21]. It is not known whether the muscles of diabetics respond differently to swimming training. We hypothesized that autophagy is a hypercatabolic mechanism in diabetic skeletal muscles that contributes to muscle atrophy. In this study, we investigated whether swimming exercise could improve muscle mass by suppressing intracellular protein degradation via the down-regulation of autophagic signaling.
Materials and Methods
Animals
We used 8-week-old male Sprague-Dawley (SD) rats for all studies, obtained from Samtaco BioKorea (Osan, Gyeonggido, Korea). The rats had free access to standard rodent chow (Hyochang Science; Daegu, Korea) and tap water ad libitum. All animal procedures were approved by the Ethics Committee for Animal Care and Use at Inje University (2009-081), which is certified by the Korean Association for Accreditation of Laboratory Animal Care. All rats were housed two per cage under controlled environmental conditions (23℃) with an established photoperiod of 12 hr light/day (lights on: 06:00 hr).
Induction of diabetes and blood glucose measurement
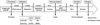
As shown in Figure 1, for all experimental designs in this study, rats received a single intraperitoneal (IP) dose of STZ (Sigma Aldrich, Inc.; St. Louis, MO, USA), a well-known specific pancreatic β-cell toxin, dissolved in a sodium citrate buffer (pH 4.5) at an initial dose of 60 mg/kg body weight after 16 hr fasting, as previously described [22,23]. Age-matched rats with vehicle (citrate buffer) injection were used as controls. Three days after STZ injection, blood glucose was determined with a glucometer (SUPER GLUCOCARD II, Global Business. Inc.; Kyoto, Japan). Animals with a blood glucose level below 200 mg/dL were supplemented with additional STZ via intraperitoneal injection and reassessed. Rats with a blood glucose level higher than 200 mg/dL were considered to have moderate diabetes [23,24]. Animals that were unresponsive to STZ injection (blood glucose <200 mg/dL) were omitted from the study. All blood sampling were performed between 11:00~13:00 hr, unanesthetized rats. Blood samples were obtained by venipuncture of a tail vein. All animals were observed daily for signs of poor health.
Experimental groups
For experimental groups, eight-week-old young diabetic rats and the age-matched control rats were maintained for 4 weeks then randomly divided into four groups: Con=vehicle-injected rats that remained sedentary for 4 weeks (control); Con+Ex=vehicle-injected rats that performed a 4-week swimming exercise program; DM=STZ-injected rats that remained sedentary for 4 weeks; DM+Ex=STZ-injected rats that performed a 4-week swimming exercise program.
Adaptation to the water and swimming exercise training
All of the rats were adapted to the water before the beginning of the experiment. The adaptation involved keeping the animals in shallow water at 31±1℃ from 17:00 to 17:30 hr, 5 days per week [25]. The water adaptation procedure continued during the entire experimental period. The purpose of the adaptation was to reduce the animals' stress in the water without encouraging physical training.
The exercise protocol consisted of swimming exercise (1 hr/day, 5 days/week) for 4 weeks in a swimming pool (100×80×80 cm) filled with water at a temperature of 37℃. The swimming exercise protocol was chosen because it is frequently used in our laboratory and has been shown to improve the aerobic capacity of rats [26].
Intraperitoneal glucose tolerance test (IPGTT)
For the intraperitoneal glucose tolerance test (IPGTT), after the 4-week exercise experiment, all of the groups received an intraperitoneal glucose tolerance test (IPGTT) [27]. Before glucose injection, rats were fasted overnight for 16 to 18 hr. During the normal treatment time (between 9:30 and 11:30 hr), rats were administered an intraperitoneal injection of 50% dextrose (Shinhyo Pure Chemicals Co.; Osaka, Japan) at a dose of 2 g/kg body weight. Blood glucose levels were measured for 2 hr via the tail vein at 30-min intervals starting at T=0 (just before injection).
Sacrifice, tissue collection and analysis
After the 4-week training period (48 hr after the final tests and without previous fasting), all of the animals were anesthetized with ketamine (50 mg/kg body weight) and xylazine (10 mg/kg body weight) for the collection of biological samples, and sacrificed. After all of the animals were weighed and anesthetized, and the soleus (SOL), plantaris (PLT), and exensor digitorum longus (EDL) muscles were separated. Muscles were carefully weighed to the nearest 0.01 g on an electronic balance and stored frozen at -70℃ until homogenization.
Polyacrylamide gel electrophoresis and Western blotting
For Western blot analysis, muscles were homogenized in 0.6 mL ice-cold lysis buffer containing 135 mM NaCl, 1 mM MgCl2, 2.7 mM KCl, 20 mM Tris-HCl (pH 8.0), 0.5 mM Na3VO4, 10 mM NaF, 1% Triton X-100, 10% (v/v) glycerol, 0.2mM phenylmethylsulfonyl fluoride (PMSF), and 10 mg/mL each of aprotinin, leupeptin, and pepstatin. Insoluble material was removed by centrifugation (12,000×g for 10 min at 4℃). Protein analysis was conducted with a Bradford protein assay (Biorad Laboratories; Richmond, CA, USA) [28]. Lysates were resuspended in Laemmli sample buffer. Protein expression was analyzed in lysates of muscle. Proteins were separated by sodium dodecyl sulfate polyacrylamide gel electrophoresis, transferred to poly-vinylidene difluoride membranes (Millipore; Bedford, MA, USA), blocked with 7.5% nonfat milk, washed with Tris-buffered saline Tween-20 (TBST; 10 mM Tris-HCl, pH 7.5; 100 mM NaCl; 0.02% Tween 20), and incubated with primary antibodies (Glyceraldehyde 3-phosphate dehydrogenase (GAPDH); 1:1000, actin; 1:1000, LC3; 1:1000) overnight at 4℃. Membranes were washed with TBST and incubated with appropriate secondary antibody. Proteins were visualized by enhanced chemiluminescence and quantified by densitometry.
Histological examination
To investigate histological alterations, after the experiment, transcardial perfusion fixation with a 4% paraformaldehyde solution was conducted in four rats, one randomly selected from each group (Con, Con+Ex, DM, DM+Ex). After fixation, tissue samples were removed and embedded in optimum cutting temperature compound (Sakura Finetek, Torrance, CA, USA), and routine cryosection was performed using a cryostat (Microtome; Walldorf, Germany) at 8 µm. Tissue sections were subjected to a hematoxylin-eosin staining. Each specimen was analyzed with an Olympus DP70 microscope digital camera (Olympus; Tokyo, Japan) connected to a computer.
Statistical analysis
All statistical analyses were performed using the Statistical Package for the Social Science (SPSS) ver.18 software (SPSS Inc.; Chicago, IL, USA). Data were collected from repeated experiments and are presented as mean±SEM. One-way analysis of variance (ANOVA) and Student's t-test were used for statistical analyses. Differences were considered to be significant at P<0.05.
Results
Blood glucose
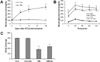
Initially, all diabetic animals showed blood glucose levels similar to those of controls. However, 1 week after the injection, STZ-treated animals demonstrated a significant increase (P<0.05) in blood glucose levels, producing levels three times higher than those observed in controls (342.6±8.96 vs. 116.0±8.96mg/dL, respectively; Figure 2A). Two weeks after injection and thereafter, blood glucose levels from the diabetic animals were approximately four times higher (P<0.05) than were those of control animals (440.2±78.96 vs. 129.8±8.64 mg/dL, respectively; Figure 2A). These data suggest that the diabetic state created by STZ resulted in conditions similar to those observed in type I diabetes.
Four weeks after injection, diabetic rats were randomly subdivided into exercising (DM+Ex) and non-exercising (DM) groups. After a 4-week training period, an IPGTT was performed. As expected, blood glucose levels were higher (P<0.05) in the DM group than in normal Con rats (Figure 2B). However, after the 4-week exercise program, blood glucose levels were slightly decreased in the DM+Ex animals compared to the DM animals (234.75±72.30 vs. 348±91.23mg/dL, respectively; 32.54% lower), although the difference was not statistically significant (Figure 2B). However, the blood glucose levels of DM+Ex rats stayed at a higher level than in Con rats even after the exercise program.
Body mass
The STZ-diabetic rats showed a significant decrease in body mass (Figure 2C). Prior to swimming training, no differences in body mass were observed between the diabetic animals. However, 4 weeks after the exercise program, the body mass of the DM+Ex rats was slightly increased compared to DM rats (239.0±47.91 vs. 182.8±24.31 g) such that they were 31.91% higher than controls (396.8±13.92 vs. 401.5±24.79 g), although the differences were not statistically significant (Figure 2C). However, the DM+Ex animals showed a 52.84% lower body mass than the control group.
Skeletal muscle mass
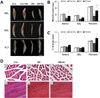
The STZ-diabetic rats showed a significant loss of skeletal muscle (Figure 3). However, after 4 weeks of exercise, a slightly greater increase was observed in the muscle mass of DM+Ex animals than in that of DM rats (19.75±9.07 vs. 10.58±3.79 g) such that they were 80.5% higher than controls (28.75±12.32 vs. 27.08±12.83 g; Figure 3A,B). Given the lower body mass observed after STZ treatment in diabetic animals, skeletal muscle mass might also be expected to be lower. Thus, it was necessary to normalize muscle mass to body mass (Figure 3C). When the relative muscle masses are expressed per unit body mass, the SOL, PLT, and EDL muscles were not significantly different between diabetic and control animals, but the average was significantly lower in diabetic rats compared to control animals. This result suggests that STZ-induced diabetes affects the loss of muscle mass. However, the muscle mass of DM+Ex rats increased after the 4-week training period compared to the DM rats (Figure 3C).
Histological examination
Although skeletal muscle masses were not significantly different between the DM and DM+Ex groups, muscles from DM rats appeared more atrophic upon gross examination compared to muscles from DM+Ex rats. To further study potential swimming exercise-induced changes, EDL muscle sections were subjected to H&E staining. Histological examination of H&E stained EDL sections shows reduction in the diameter of the muscle fibers of DM rats (Figure 3D-b), whereas the diameter of these fibers was increased in DM+Ex rats (Figure 3D-c). In longitudinal sections, DM and DM+Ex rats showed adequately preserved myofibers with clear striations and peripheral myonuclei; however, the nuclear density was increased in the DM group (Figure 3D-e) compared to Con and DM+Ex rats. These data indicate that diabetes causes a reduction in the diameter of the fibers with a corresponding increase in their numerical nuclear density, and suggest that swimming exercise might improve such muscle atrophy.
Protein expression of autophagy with relation to atrophy
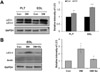
To further characterize potential mechanisms that might be responsible for the decreased muscle mass and decreased diameter of muscle fibers in diabetic rats, we examined the levels of LC3, a key autophagosome molecule, and of actin, a key component of contractile microfilaments. GAPDH was used as a loading control (Figure 4A). In Western blot analysis, the expression of LC3 increased in DM rats compared to Con rats. However, actin protein levels in the EDL were not different among all of the groups. This result suggests that hyperactive autophagy in diabetes does not cause the degradation of actin.
After 4 weeks of swimming exercise, the levels of LC3 increased by approximately 4.5-fold in DM rats compared to Con rats and decreased by approximately 3-fold in DM+Ex rats compared to DM rats. However, actin protein levels in the EDL did not change in any group (Figure 4B).
Discussion
Muscular atrophy is a well-known complication of chronic human diabetes and commonly affects the lower limb muscles [29]. However, little is known of the molecular mechanism by which diabetes leads to skeletal muscle atrophy. Here, we provide evidence for a molecular mechanism for the increased expression of autophagy in lower limb muscles after diabetes, and show that swimming exercise ameliorates the atrophy of muscles by suppressing autophagy. In this study, we observed that rats commonly use their lower limbs to propel themselves during swimming; swimming resulted in the improvement of muscle atrophy in the SOL, PLT, and EDL muscles. It has long been recognized that physical activity has important health benefits for people with diabetes. Regular physical activity leads to a number of adaptations in skeletal muscle that allow the muscle to more efficiently utilize substrates for ATP production and thus become more resistant to fatigue [30]. Chronic physical activity (i.e., exercise training) increases glucose transporter 4 (GLUT4) protein levels and mitochondrial enzyme content, and alters fiber type in skeletal muscle [31,32]. In contrast, exercise and muscle contraction have no effect on insulin receptor and IRS-1 phosphorylation or on phosphatidylinositol 3-kinase (PI3-K) activity [33,34]. Clearly, distinct initiating signals lead to GLUT4 translocation by insulin and by exercise in skeletal muscle. Muscle contraction is a multifactorial process involving changes in cellular energy status (i.e., an increased AMP to ATP ratio), increases in intracellular Ca2+ levels, the activation of protein kinase C (PKC), and other changes [30]. Several studies have provided data supporting the role of reactive oxygen species [35] and nitric oxide [36] in the regulation of contraction-stimulated skeletal muscle glucose transport. These data suggest that various signals are involved in this process. Hence, the reduced blood glucose in the DM group compared to that in the DM+Ex group might be related to some of these adaptations.
AMP-activated protein kinase (AMPK) may be a key signaling intermediate to glucose transport in response to exercise [37]. The activity of AMPK is acutely regulated by changes in the intracellular ratios of ATP to AMP and creatine phosphate to creatine, as well as by changes in intracellular pH [38]. AMPK activity rapidly increases in response to muscle contraction [39].
Autophagy is stimulated by nutrient starvation and growth factor deprivation when cells are unable to take up external nutrients [40]. The class I PI3K/mTOR pathway has been identified as a negative regulator of autophagy in mammalian cells [41,42]. Previous studies have suggested that mTOR, a sensor of the cellular nutrient status, is inhibited during energy starvation and that inhibition of mTOR stimulates autophagy [43]. Recent studies show that AMPK plays an essential role in mediating glucose deficient or ischemia-induced autophagy in cardiac myocytes [44].
These studies suggest that swimming exercise has the potential to change the metabolic state of myocytes by increasing the uptake of glucose and activating glucose signaling, which could inhibit diabetic skeletal muscle autophagy. In this study, DM+Ex rats show a significant increase in muscle mass accompanied by a suppression of autophagy. These results suggest that diabetes-induced skeletal muscle atrophy is affected by autophagy, and that autophagy tends to produce pathophysiological response.
The process of skeletal muscle atrophy caused by insulin depletion is complicated and may involve several overlapping mechanisms, including metabolic derangement, motor end-plate degeneration, and the impairment of myocyte protein synthesis.
This study clearly demonstrates a decrease in muscle mass and in the size of the myofibers of the hind limb muscles of STZ-diabetic rats; these losses were ameliorated by swimming exercise. We found that diabetic conditions stimulate autophagy, with increased expression of LC3, in the EDL muscle; swimming exercise exerts a protective effect by slightly reducing plasma glucose levels and suppressing hyperactive autophagy. Further studies on diabetic muscular atrophy and peripheral neuropathy are required to elucidate and understand the role of autophagy as a causative player. Aerobic exercise could improve glucose uptake through repeated muscle contractions, prevent the destruction of skeletal muscle fiber, and improve diabetes-induced muscle atrophy.
Since its anti-atrophic effects, regular swimming exercise may modify or reverse the skeletal muscle abnormalities of diabetic patients. Also it should consider an aquatic exercise program for diabetic patients. Further investigation of the appropriate intensity of swimming exercise in diabetic patients also is needed.
 XML Download