

 PDF
PDF ePub
ePub Citation
 Print
Print


In the developed countries, colorectal cancer (CRC) is one of the commonest non-smoking related cancers (Tanaka et al, 2003). In Korea, the incidence and mortality of CRC have gradually increased in the last decade, becoming the fourth leading cause of cancer deaths (Korea National Statistical Office, 2007). For inflammatory bowel disease (IBD) and IBD-related CRC, several animal models have been reported. A mouse model induced with azoxymethane (AOM) and dextran sodium sulfate (DSS) has been used most widely (Okayasu et al, 1990). AOM is an indirect and genotoxic colon carcinogen requiring metabolic activation of cytochrome P-450 type 2E1 (CYP2E1) to exert its carcinogenic action (Sohn et al, 2001). A novel colitis-related mouse CRC model initiated with AOM and promoted with DSS was developed to obtain a better understanding of the pathogenesis of CRC (Tanaka et al, 2003; Rosenberg et al, 2009).
Epidemiologic studies have shown a modest association between red meat intake, the major source of dietary Fe, and risk of colon and colorectal cancer (Norat and Riboli, 2001; Larsson and Wolk, 2006). Fe is essential for normal cellular function, but an excessive amount of Fe is now known to be potentially harmful, by increasing oxidative damage to cell membranes as a result of the Fenton reaction (Evans and Halliwell, 2001). Oxidative damage to DNA and other macromolecules appears to play a major role in aging and degenerative diseases such as cancers (Beckman and Ames, 1998).
The essentiality of Se was first established because of the ability of supplemental Se to prevent several diseases in domestic and laboratory animals (National Research Council, 1983). Supplemental Se has been found to reduce the incidence and mortality of colon cancer in humans (Clark et al, 1996). Also, several animal studies showed the protective effects of Se against aberrant crypt formation and colon tumor development (Feng et al, 1999; Finley and Davis, 2001). Se is essential for selenoprotein synthesis and function. More than twenty-five selenoproteins have been identified, among these the glutathione peroxidase (GPx), thioredoxin reductase (TrR) and selenoprotein P (sel P) which play a role in antioxidative defence (Saito et al, 2004). Selenomethionine as Se sources is being incorporated non-specifically into the protein pools before being converted into the precursor available for GPx synthesis whereas inorganic Se sources directly enter into the Se pool available for synthesis of selenoproteins (Butler et al, 1991; Ravn-Haren et al, 2008).
Proposed anti-carcinogenic pathways of Se include the repair and prevention of oxidative damage, alteration of metabolism of carcinogenic agents, regulation of immune response, and p53-independent apoptosis, and repair of DNA damage. It is likely that Se acts as an anti-carcinogen through several mechanisms, which vary in importance based on disease status of the individual (Connelly-Frost et al, 2006). Free radicals are natural by-products of oxygen metabolism that may contribute to the development of chronic diseases such as cancer and heart disease (Combs et al, 2001). The antioxidant properties of Se can help protect the body from damaging effects of free radicals.
Many studies have shown the role of Se or Fe in the colon carcinogenesis, respectively. But, it is the first time to investigate the protective role of Se on the colon carcinogenesis induced by AOM and DSS in ICR mice fed on a high-Fe diet.
Materials and Methods
Materials
AOM was purchased from the Sigma-Aldrich (St. Louis, USA) and DSS (molecular weight 36,000-50,000) was purchased from MP Biomedicals (Solon, USA).
Animals
Male ICR mice (5 weeks old) were obtained from Central Laboratory Animal Inc (SLC Inc., Shizuoka, Japan) and housed in polysulfone cages (5 mice/cage). The temperature and relative humidity were maintained at 20±2℃ and 50±20%. Light and dark cycles were at 12 h each. Mice were allowed to access to AIN-93G purified rodent diet (Dyets Inc., Bethlehem, USA) and water was provided ad libitum. Animal experiments were conducted in accordance with "Guide for Care and Use of Laboratory Animals" of Chungbuk National University Institutional Animal Care and Use Committee. During the experiment, body weight and food intake were measured weekly.
Experimental diets
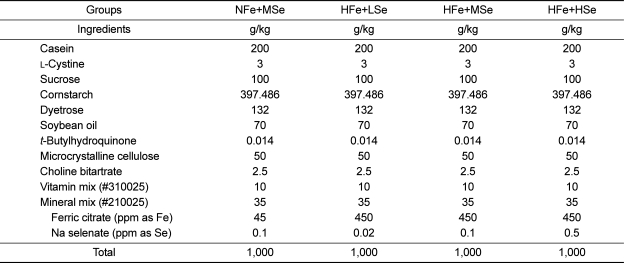
The AIN-93G purified rodent diet contained 20% casein, 0.3% L-cystine, 39.7% cornstarch, 13.2% Dyetrose®, 7% soybean oil, 0.0014% t-butylhydroquinone, 5% cellulose, 3.7% mineral mix, 1% vitamin mix, and 0.25% choline bitartrate (Table 1). Normal-Fe diet (NFe) and high-Fe diet (HFe) contained ferric citrate at the level of 45 ppm and 450 ppm as Fe, respectively. Low-Se diet (LSe), medium-Se diet (MSe) and high-Se diet (HSe) contained sodium selenate at the level of 0.02, 0.1, and 0.5 ppm as Se, respectively, regardless of Fe levels.
Experimental designs
Twenty mice were assigned to each AOM/DSS treatment group, while ten mice to vehicle group. For AOM/DSS treatment groups, animals were injected intraperitoneally with AOM (10 mg/kg body weight in saline) once a week for 3 weeks after starting the experiment. Two weeks later, additionally 2% DSS was given in the drinking water for 7 days. In the vehicle group, mice were injected with saline instead of AOM then no additional DSS was given. There were five experimental groups including vehicle group, positive control (AOM/DSS+NFe+MSe group), AOM/DSS+HFe+LSe group, AOM/DSS+HFe+MSe group, and AOM/DSS+HFe+HSe group. The mice in the vehicle group and positive control group were fed AIN-93G purified rodent diet (NFe diet; 45 ppm Fe, MSe diet; 0.1 ppm Se) and the mice in the other three groups were fed HFe diet (450 ppm Fe) with three different levels of Se [LSe (0.02 ppm Se), MSe (0.1 ppm Se), or HSe (0.5 ppm Se)].
Sample collection
Mice were sacrificed 24 weeks after the first injection of AOM or saline. Before sacrifice blood samples were collected from the abdominal aorta and immediately transferred into tubes containing K3-EDTA and serum separator tubes (Vacutainer, Franklin Lakes, USA). The liver, spleen, kidneys, lung, stomach, small intestine and entire large intestine were isolated. After washing with saline, parts of liver, spleen and kidneys were blot dried, weighted and then frozen in liquid nitrogen. A half of the large intestine from cecum to anus was longitudinally opened, flushed with saline, and frozen in liquid nitrogen. For macroscopic and histological examination of tumors, the remaining tissues were fixed in 10% neutral buffered formalin.
Blood analysis
Blood samples in EDTA tubes were used for analyses of complete blood cell counts and differential counts with Abbott CellDyn-3500 (Abbott Laboratories, Chicago, USA).
Fe and Se analyses in the liver
For the determination of total Fe, liver samples were analyzed by inductively coupled plasma spectrophotometer (ICP-AES) (JY 38 Plus, JOBIN-YVON, rue de Lille, France). Total amount of Se in the liver were analyzed by inductively coupled plasma mass spectroscopy (ICP-MS) (820-MS, Varian, Santa Clara, USA). Frozen liver samples were digested and ashed at 200 for 4 h using concentrated nitric acid and hydrogen peroxide. The digested sample was diluted with equal amounts of deionized water before analysis.
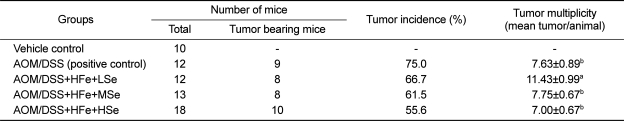
Tumor incidence
Colonic neoplasms were observed for calculation of tumor incidence in each group. Tumor incidence was defined as number of mice with tumors/total living mice in each group. Tumor multiplicity (mean number of tumors per mouse) was defined as the total number of colorectal tumors divided by the number of the tumor-bearing mice in each group.
Immunohistochemistry of proliferating cell nuclear antigen (PCNA)
The 4-µm formalin-fixed, paraffin-embedded distal colon sections were subjected to deparaffinization and hydration prior to quenching of endogenous peroxidase activity (3% H2O2 in methanol for 15 min). The sections were incubated for 60 min with the primary anti-PCNA mouse monoclonal antibody (Santa Cruz Biotechnology, Santa Cruz, USA) in a 1:200 dilution. The slides were subsequently treated with biotinylated secondary antibody, avidin-conjugated peroxidase utilizing Vectastain Elite kit (Vector Laboratories, Burlingame, USA), then developed with diaminobenzidine (DAB) as the substrate. Sections were counterstained with mayer hematoxylin. Twenty fields, randomly selected from each slide, were analyzed at ×100 magnification. The numbers of nuclei with positive reactivity for PCNA-immunohistochemistry were counted in a total of 3×100 cells in 3 different areas of the colonic cancer and expressed as a percentage (Tanaka et al, 2010).
TUNEL assay
Level of apoptosis in distal colon tissue was determined using the terminal deoxynucleotidyl transferase (TdT)-mediated deoxyuridine triphosphate (dUTP)-biotin nick end labeling (TUNEL) method. Paraffin-embedded tissue sections (4-µm thick) from the distal colon were processed according to manufacturer's instructions for the ApopTag peroxidase in situ apoptosis detection kit (TUNEL; Vector Laboratories). The number of nuclei with positive reactivity for TUNEL-assay were counted in a total of 3×100 cells in 3 different areas of the colonic cancer and expressed as a percentage (Tanaka et al, 2010).
Glutathione peroxidase (GPx) activity
The GPx activity was measured using a commercial kit (Cayman, Michigan, USA). This method is based on the principle that GPx can catalyze the action of hydrogen peroxide and glutathione into water and oxidized glutathione. Oxidized glutathione is recycled to its reduced state by glutathione reductase and NADPH. The oxidation of NADPH to NADP+ is accompanied by a decrease in absorbance at 340 nm. The results of this enzymatic assay are given in units of GPx activity per milligram of protein (nmol/mg protein). The extinction coefficient for NADPH at 340 nm is 0.00622 µM-1cm-1. The protein concentrations were determined according to the Bradford method (PRO-MEASURE; iNtRON Biotechnology, Seongnam, Korea).
Western blot analysis
A total of 100 mg large intestine tissues was homogenated with 500 µL of proprep (iNtRON Biotechnology) and centrifuged at 15,000×g for 15 min at 4℃. The protein concentration was measured by the Bradford method (PRO-MEASURE; iNtRON Biotechnology). A total of 40 µg proteins per lane was separated on 12% acrylamide gels and electroblotted onto polyvinylidene fluoride (PVDF) membranes (Hybond-ECL, GE Healthcare, Buckinghamshire, UK). Blots were blocked for 1 h at room temperature with 5% (w/v) bovine serum albumin in tris buffered saline (10 mM Tris (pH 8.0) and 150 mM NaCl) solution containing 0.05% Tween-20. GPx-1 expression levels were assessed with 1:100 diluted rabbit GPx-1 antibody (Abcam, Cambridge, UK). β-Actin expression was evaluated to confirm equal amount of protein loadings by mouse monoclonal β-actin (Santa Cruz). The membranes were incubated overnight at 4℃ with specific antibodies, then incubated with the corresponding anti-rabbit or anti-mouse immunoglobin-G conjugated with horseradish peroxidase (Santa Cruz). Immunoreactive proteins were detected with the ECL western blotting detection system.
Determination of hepatic malondialdehyde (MDA)
The amount of MDA contained in the tissue homogenate was measured using commercial ELISA kits (Cayman). In brief, A mixture of 100 µL liver homogenate, 500 µL of 30 mg/mL sodium dodecyl sulfate, 2 mL HCl, 300 µL of 10 mg/mL phosphotungstic acid, and 1 mL of 7 mg/mL 2-thiobarbituric acid was incubated in boiling water for 30 min with 95℃. After cooling, 5 mL of butanol was added. The organic layer was collected after centrifuging at 1000×g for 10 min at 4℃. The absorbance was measured at 532 nm and compare with a standard curve constructed with known concentration of 1,1,3,3,-tetramethoxypropane. The data were represented as nM MDA/g protein.
Statistical analysis
Data were expressed as mean±standard error (SE). Data were analyzed by one-way analysis of variance and a significant difference among treatment groups were evaluated by Duncan's Multiple Range Test (DMRT) using SPSS v12.0 software. The results were considered significant at P<0.05.
Go to : 
Results
Changes in body weights
The changes in body weights were measured during the experimental period. All AOM/DSS-treated groups were lower in body weight of mice throughout the experimental periods, compared with vehicle group (Figure 1). The mean body weights of mice in the positive control group and all Feoverloaded groups were significantly low, compared with the vehicle group at the 2nd and the 4th weeks (P<0.05). The lowered body weights of mice were associated with the reduction of feed consumption.
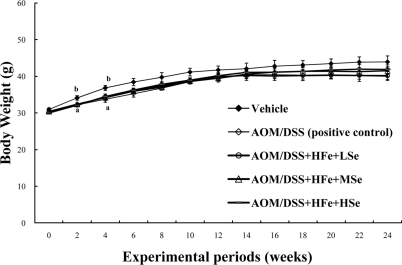 | Figure 1Change in the body weights of mice fed the high Fe diet. All AOM/DSS-treated groups showed a low body weight compared with the vehicle group during experimental periods. AOM: azoxymethane, DSS: dextran sodium sulfate, HFe: high-Fe diet (450 ppm), LSe: low-Se diet (0.02 ppm), MSe: medium-Se diet (0.1 ppm), HSe: high-Se diet (0.5 ppm). Data were represented as mean±SE. abMeans not sharing common superscript letters are significantly different at P<0.05.
|
Changes in hematology
Changes in hematology were determined using whole blood before sacrifice. All high-Fe groups and vehicle group showed a significantly increased hematocrit level compare to the positive control group (P<0.05) (Table 2). There were no significant changes in the values of white blood cells, red blood cells, hemoglobin, mean corpuscular volume, mean corpuscular hemoglobin, and mean corpuscular hemoglobin concentration among experimental groups (Table 2).
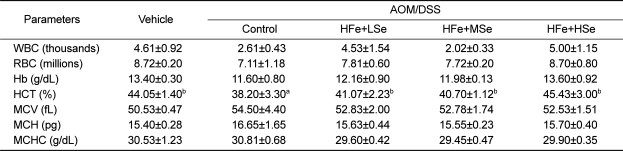
Table 2
Differential blood cell counts in Fe-overloaded mice fed different selenium diets
AOM: azoxymethane, DSS: dextran sodium sulfate, WBC: white blood cells, RBC: red blood cells, Hb: hemoglobin, HCT: hematocrit, MCV: mean corpuscular volume, MCH: mean corpuscular hemoglobin, MCHC: mean corpuscular hemoglobin concentration, NFe: normal-Fe diet (45 ppm), HFe: high-Fe (450 ppm) diet, LSe: low-Se diet (0.02 ppm), MSe: medium-Se diet (0.1 ppm), HSe: high-Se diet (0.5 ppm).
Data represented as mean±SE. abMeans in each row with different superscripts are significantly different (P<0.05).
![]()
Fe concentration in the liver
In order to confirm iron-load in the body by dietary supplement of Fe, the Fe concentrations in the liver were analyzed by ICP-AES. High iron diet significantly increased hepatic Fe concentrations in all HFe groups, regardless of Se, compare to positive control group (P<0.05) (Figure 2).
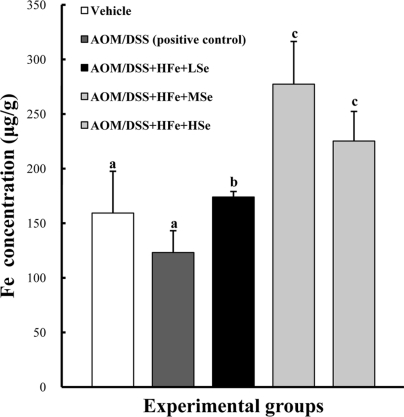 | Figure 2Hepatic Fe levels in mice fed the high Fe diet. Fe concentration was determined using an inductively coupled plasma spectrophotometer. High Fe diet significantly increased hepatic Fe levels compared with the control group. AOM: azoxymethane, DSS: dextran sodium sulfate, HFe: high-Fe diet (450 ppm), LSe: low-Se diet (0.02 ppm), MSe: medium-Se diet (0.1 ppm), HSe: high-Se diet (0.5 ppm). Data were represented as mean±SE. abcMeans not sharing common superscript letters are significantly different at P<0.05.
|
Se concentration in the liver
The Se concentrations in the liver were analyzed using an ICP-MS. The AOM/DSS+HFe+LSe group showed a significant decrease in the hepatic Se concentration compared with the other treatment groups (P<0.05) (Figure 3). On the other hand, the AOM/DSS+HFe+HSe group showed an increase in the hepatic Se concentration without a significance compared with the other groups (Figure 3).
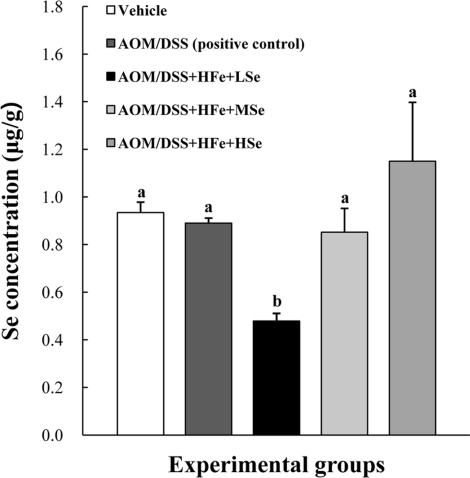 | Figure 3Hepatic Se levels in mice fed the high Fe diet with different Se levels. The Se concentration was determined using an inductively coupled plasma mass spectrophotometer. The hepatic Se levels were dependent on dietary Se levels. AOM: azoxymethane, DSS: dextran sodium sulfate, HFe: high-Fe diet (450 ppm), LSe: low-Se diet (0.02 ppm), MSe: medium-Se diet (0.1 ppm), HSe: high-Se diet (0.5 ppm). Data were represented as mean±SE. abMeans not sharing common superscript letters are significantly different at P<0.05.
|
Tumor incidence and multiplicity
The AOM/DSS+HFe+HSe diet group showed 19.4% lower tumor incidence rate than positive control group, 5.9% lower than HFe+MSe diet group, and 11.1% lower than HFe+LSe group (Table 3). The tumor multiplicity was significantly higher in the AOM/DSS+HFe+LSe diet group compare to all other AOM/DSS treated groups (P<0.05).
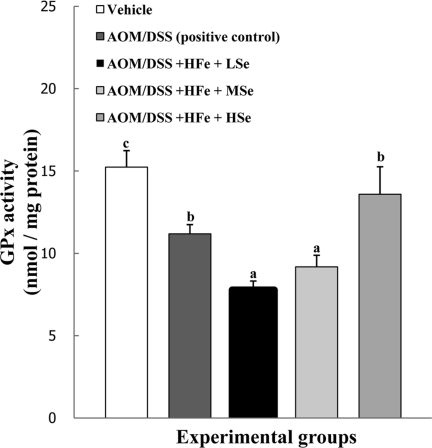
GPx activity in the liver
The activity of GPx in the AOM/DSS+HFe+LSe and MSe groups were significantly lower than positive control group (P<0.05). In the AOM/DSS+HFe+HSe group, hepatic GPx activity was comparable to that of positive control group, and significantly higher than those of AOM/DSS+HFe+LSe or MSe groups (P<0.05)
Expression levels of GPx-1 protein in the liver
The expression of GPx-1 in the liver was significantly decreased in the AOM/DSS+HFe+LSe group compared to the positive control group (Figure 5). In contrast, AOM/DSS+HFe+HSe group showed an increased expression level of GPx-1 compared to the AOM/DSS+HFe+LSe group (Figure 5).
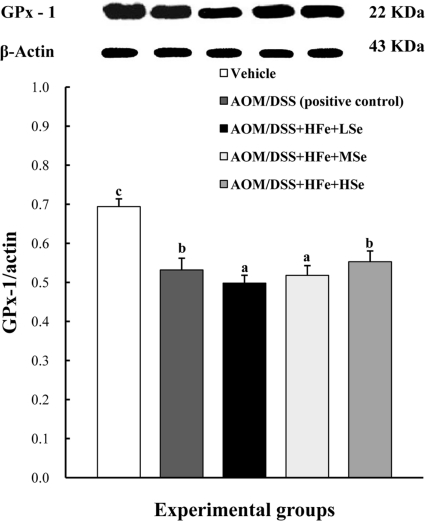 | Figure 5Effect of Se on hepatic GPx-1 by western blot in mice fed the high Fe diet with different Se levels. The expression of GPx-1 was up-regulated in the high-Se group compared with the low-Se group. AOM: azoxymethane, DSS: dextran sodium sulfate, HFe: high-Fe diet (450 ppm), LSe: low-Se diet (0.02 ppm), MSe: medium-Se diet (0.1 ppm), HSe: high-Se diet (0.5 ppm). Data were represented as mean±SE. abcMeans not sharing common superscript letters are significantly different at P<0.05.
|
MDA levels in the liver
The positive control group showed an increased level of MDA in the liver compared to the vehicle group (Figure 6). Also, the AOM/DSS+HFe+LSe group showed the highest level of MDA compared to the other groups. The HSe diet significantly decreased the level of MDA in the liver compared with the AOM/DSS+HFe+LSe or MSe group (P<0.05).
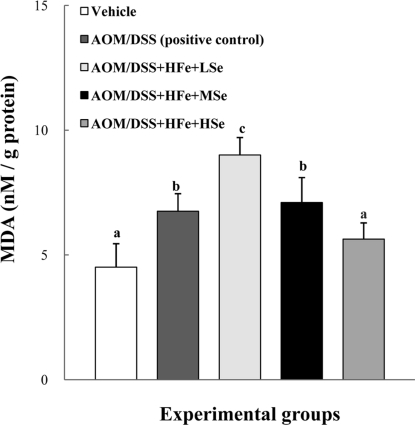 | Figure 6Effect of Se on hepatic MDA levels in mice fed the high Fe diet with different Se levels. The MDA levels were decreased by dietary Se in a dose-dependent manner. AOM: azoxymethane, DSS: dextran sodium sulfate, HFe: high-Fe diet (450 ppm), LSe: low-Se diet (0.02 ppm), MSe: medium-Se diet (0.1 ppm), HSe: high-Se diet (0.5 ppm). Data were represented as mean±SE. abcdMeans not sharing common superscript letters are significantly different at P<0.05.
|
Effect of Se on cell proliferation and apoptosis in colon tumor
Proliferative indices in AOM/DSS treated groups (positive control, HFe+LSe, HFe+MSe) were significantly higher than vehicle group, and the proliferative index in AOM/DSS+HFe+HSe group was significantly lower than those in LSe or MSe goups (P<0.05) (Table 4). The suppression of proliferative index showed strong Se-dependency.
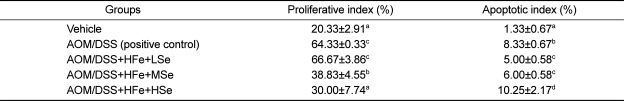
The apoptotic indices in low-Se group and medium-Se group were significantly lower than positive control group. However, apoptotic index of high-Se diet group was significantly higher than all other groups. Representative micrographs of PCNA immunohistochemistry and apoptotic bodies in the tumor sections visualized by TUNEL assay are shown in Figure 7 and Figure 8.
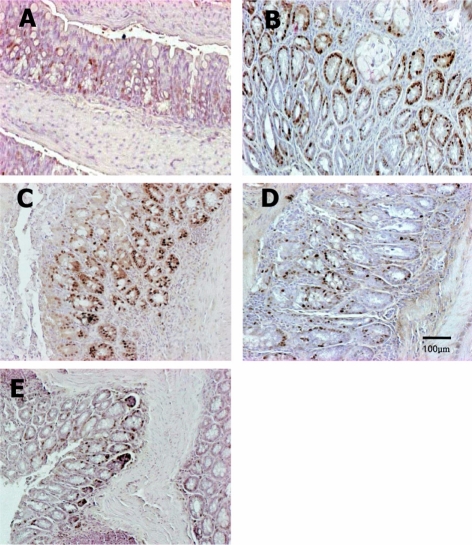 | Figure 7Immunohistochemistry of PCNA in the colon of mice fed the low Fe diet with different Se levels. The PCNA-positive cells were increased by treatment with AOM/DSS, but they were reduced by co-administration of a high concentration of Se. Vehicle (A), AOM/DSS+NFe+MSe (positive control, B), AOM/DSS+HFe+LSe (C), AOM/DSS+HFe+MSe (D), AOM/DSS+HFe+HSe (E).
|
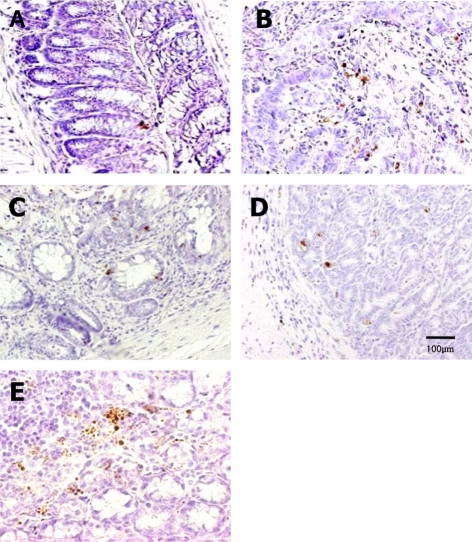 | Figure 8TUNEL assay for apoptotic nuclei in distal colon sections of mice fed high-Fe diet with different Se levels. The TUNEL-positive cells were increased by dietary Se in a dose-dependent manner. Vehicle (A), AOM/DSS+NFe+MSe (positive control, B), AOM/DSS+HFe+LSe (C), AOM/DSS+HFe+MSe (D), AOM/DSS+HFe+HSe (E).
|
Go to :
Discussion
The current study of AOM/DSS-induced colon carcinogenesis in the mouse model elucidated how Fe-overloaded status in mice influences colon carcinogenesis and how dietary Se affects the colon carcinogenesis in Fe-overloaded mice. In this study, sodium selenate as dietary supplementation was used for Se source. The tumor incidence rates at three different doses of Se (0.02, 0.1, and 0.5 ppm in diet) were reversely dependent on the concentration of Se in the mouse colon carcinogenesis model under the Fe-overloaded condition. The high dose (0.5 ppm) of Se suppressed the incidence of colonic cancer induced by AOM/DSS compared with low or medium doses of Se. Both inorganic (e.g., selenite and selenate) and organic forms of Se have impressively shown cancer-chemopreventive effects both in humans and in animal models (Youn et al, 2001).
In present study, mice that fed a high-Fe diet (AOM/DSS+HFe+MSe) showed increased in tumor incidence rate (13.5%) compared to the mice that fed a normal-Fe diet (positive control). Lund et al (1998) reported that Fe on the formation of reactive oxygen species (ROS) via a Fenton reaction is associated with changes in crypt cell proliferation in rat large intestine. Also, Ilsley et al (2004) suggest that Fe exerts its effect at the stage of tumor promotion, but is not sufficient to initiate tumor formation. According to their results, there were no significant differences in incidence of aberrant crypt foci (ACF) attributable to Fe, whereas there was a trend toward greater multiplicity in mice on high-Fe diets. On the other hand, Soyars and Fischer (1998) reported that dietary Fe did not enhance oxidative stress, cell proliferation and ACF development in the colon of SD rats. Still the relationship between high iron and the risk of colorectal cancer is a controversial issue. Thus, further studies and more information are required to explain the detail mechanisms of the iron associated with the colorectal carcinogenesis.
In the present study with Fe-overloaded mice, the tumor incidence was reversely dependent on the Se concentration in diets. High-Se diet group showed lower incidence of colon cancer compare to medium-Se diet group (5.9% lower) and low-Se diet group (11.1% lower), respectively. These results suggest that supplement of the high-Se diet causes an inhibition of colon carcinogenesis in Fe-overloaded condition. Se supplement can prevent tumorigenesis and decrease the incidence rate of cancer (Beno et al, 2000; Yang, 2000). High Se was associated with a reduced prevalence of colorectal adenomas (Clark et al, 1996; Connelly-Frost et al, 2006). In previous study, cells are endowed with cytoprotective mechanisms (antioxidation, scavenging free radicals, damage repair) that act to counteract the effects of free radical production (Britton, 1996). Thus, the net effect of metal-induced free radicals on cellular function will depend on the balance between radical production and the cytoprotective systems (Britton, 1996). In addition, Fe may catalyze the production of prooxidative carcinogens (oxygen radicals) while Se may destroy them via antioxidant action of selenoproteins (Stevens and Kalkwarf, 1990).
Low-Se diet group showed higher tumor incidence than high-Se diet group and medium-Se diet group with Fe-overloaded status. In previous study, Se is considered as an antioxidant nutrient and the diseases where low Se is implicated range from nutritional disorders like protein energy malnutrition to degenerative diseases such as cancer (Burk and Hill, 1993; Khanna and Karjodkar, 2006). Further studies are required to elucidate the influence of low Se status on the colorectal carcinogenesis. As the results showed, the activity of hepatic GPx and expression level of GPx-1 in the low-Se diet group were decreased while they were increased in the high-Se diet regardless of hepatic Fe concentration. The increase of activity of GPx, which is one of the antioxidants, is known to protect DNA and other cellular components from damage by oxygen radicals. Thus, the colon carcinogenesis might be inhibited due to the GPx activity based on the selenium level. The hepatic MDA level was decreased by dietary Se in a dose-dependent manner. These results suggest that supplement of the high-Se diet may effective on reducing oxidative stress and it might be associated with a possible protective effect on the events leading to tumor incidence.
In this study, TUNEL and PCNA stains were performed on the mucosal membrane of colon tissue in order to confirm the association between Se and cell proliferation or apoptosis. On TUNEL assay, apoptotic cells were increased in the high-Se diet group but decreased in low-Se diet group. The number of PCNA-positive cells in the high-Se diet group was lower than in the medium-Se diet group or low-Se diet group. From these results, dietary Se with Fe-overloaded status induced the colon tumor cell apoptosis and inhibited mucosal cell proliferation. In summary, these findings indicate that dietary Se might exert a protecting effect on colon carcinogenesis induced by AOM/DSS in the Fe-overloaded ICR mice. The low-Se diet with Fe-overloaded status facilitates colorectal cancer, while high-Se diet with Fe-overloaded status reduced the incidence of colorectal cancer. The protective ability of Se with Fe-overloaded status is considered to be mediated by modulating proliferation and apoptosis. Although it is hypothesized that dietary Se in combination with Fe-overloaded status can modulate a decrease of tumor incidence due to the mechanism by destruction of reactive oxygen radicals induced by Fe, our results did not show great inhibitory effect of Se on colon carcinogenesis. In addition, high iron diet, regardless of Se supplements, increased the incidence rate of colon tumors in the AOM/DSS mouse model. Further studies are required to elucidate the detail interaction between Fe and Se status on the colorectal carcinogenesis.
Go to :
 XML Download