

 PDF
PDF ePub
ePub Citation
 Print
Print


Animal models of human diseases have always played a central role in biomedical research for the exploration and development of new therapies [1,2]. However, the evolutionary gap between humans and many of the applied animal models has hampered the direct application of knowledge gained from these studies to human therapy. In this regard, pigs share a number of anatomical and physiological characteristics with humans, which potentially make them a better model for some procedures and studies compared to other large animal species [1,3,4]. Minipigs are a major animal species used in translational research and are increasingly being used as an alternative to dogs and monkeys in biomedical research [5]. There is a large body of literature available detailing the normal anatomy and physiology of the species [5]. When different breeds are age-matched, organ sizes reflect the increased size of domestic breeds compared to miniature breeds; however, the physiologic functions are similar [6]. Conversely, when animals are weight-matched, the sizes are similar for organs and structures; however, the physiologic functions are related to the relative maturity of the animals [6]. There are various swine strains available, each with its own characteristics including size and weight, which of course can influence data [6]. The most common miniature breeds available in the United States are the Hanford, Yukatan (mini), Sinclair and Göttingen (from largest to smallest) [7-10]. However, to our knowledge, there are no data on the macroscopic or microscopic background descriptions of Yukatan minipigs in the laboratory setting.
The pig brain is relatively large, with structures typical of other mammals [11,12]. The pig central nervous system (CNS) and the brain in particular have rapidly evolved as a model system for humans given both its size and anatomic characteristics [12]. Pigs have a gyrencephalic brain which predominantly consists of white matter with similar developmental peaks to that of humans [13,14]. Accurate determination of neuronal coordinates is necessary for precise and reliable biomedical research. These specifications can be verified with the use of magnetic resonance imaging (MRI) which allows for repeated examination of brain anatomy in live animals [15]. Recent developments in MRI hardware (radiofrequency coils, magnet design and receiver systems), together with improved pulse sequences, have facilitated acquisition with sub-millimeter resolution [16]. Accordingly, MRI-based stereotaxic procedures are currently of significant interest in neural research, including deep brain stimulation and cell transplantation [16-18]. Calculation of coordinates in the minipig has previously been restricted by insufficient structural information from MRI, excluding direct targeting. Furthermore, no intracranial stereotaxic reference points, standard-space null points or standard target coordinates have yet been established in this species. Therefore, this study was conducted to determine optimal conditions necessary for the use of MRI in Yukatan minipig stereotaxic procedures and to examine anatomic characteristics specific to Yukatan minipigs.
Materials and Methods
Animal handling
All experimental protocols were approved by the Ethics Committee of Chonnam National University (CNU IACUCYB-2008-29). The study was conducted on six physically healthy female Yukatan minipigs purchased from PWG Genetics Korea (Pyeongtaek, Korea). Animals were housed in individual cages at the central animal facility and received standard pig meal ad libitum. Prior to MRI procedures, all animals were fasted for a minimum of 24 h. Pigs were premedicated with an intramuscular injection of Azaperone® (0.5 mg/kg; SF Inc, Ansan, Korea) and xylazine (Rompun®, 8 mg/kg; Bayer Korea, Seoul, Korea), and anesthetized with an intramuscular injection of a combination of zolazepam/tiletamine (Zoletil®, 4.4 mg/kg; Virbac, Carros, France).
Hematoxylin and eosin (H&E) staining
For euthanasia, pigs were anesthetized with an intravenous injection of sodium pentobarbital (Entobal®, 100 mg/kg; Hanlim Pharm, Seoul, Korea), and executed by electrocution. After euthanasia, formalin-fixed and paraffin-embedded sections from brain tissue were stained with Mayer's H&E and examined microscopically.
MRI protocol
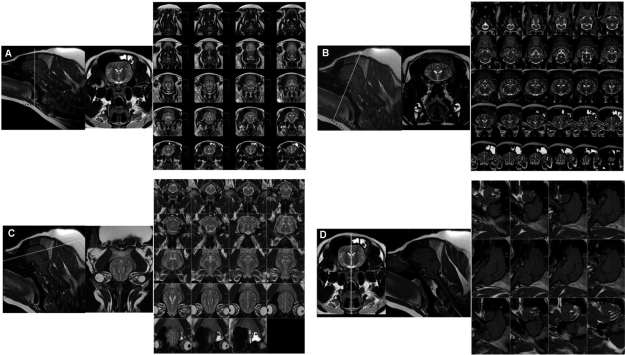
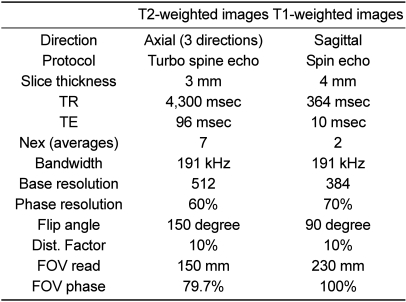
The animals were placed in a prone position in a Siemens Magnetom Avanto 1.5 System (Siemens Healthcare, Erlangen, Germany) with a head coil. Axial T2-weighted and sagittal T1-weighted MRI images were obtained from each pig; axial view directions differed (Figure 2). The sequence was optimized to improve spatial resolution, the signal-to-noise-ratio and contrast. Furthermore, the sequence was performed within a reasonable acquisition time acceptable for in vivo imaging and survival studies. MRI parameters are shown in Table 1. The acquired images were adjusted for brightness and contrast to aid in the identification of structures.
Go to : 
Results
To perform MRI in Yukatan minipigs, we took advantage of the unique organization of the Yukatan minipig brains, whose anatomy includes the cortex and the gyrus (Figure 1A) [12]. The superior, lateral and inferior views of a perfusion-fixed whole brain are shown in Figures 1B-1D. In addition, it should be noted that MRI visualizes organs with a slight geometric distortion. This is often insignificant in clinical procedures, but can be an important factor in stereotaxic procedures. To confirm stereotaxic procedures and existence of artifacts, we have done a comparative analysis with various histological sections and MR images (Figures 1E-1H). As shown in Figure 1G, the phase-encoding axis is prone to scanner-induced artifacts and phase-dependent flow artifacts were also found on all our images at the level of the large vessels of the neck. In contrast, the round contour of the column of fornix and the mammilo-thalamic tract on coronal histological sections were also round and undistorted on the acquired images with no blurring of the edges or duplication of the structures. Therefore, image artifacts in the phase-encoding direction were considered minor using the protocol proposed in our study. The anatomical landmarks similar to other mammals were identified by MRI in the Yukatan minipig brain.
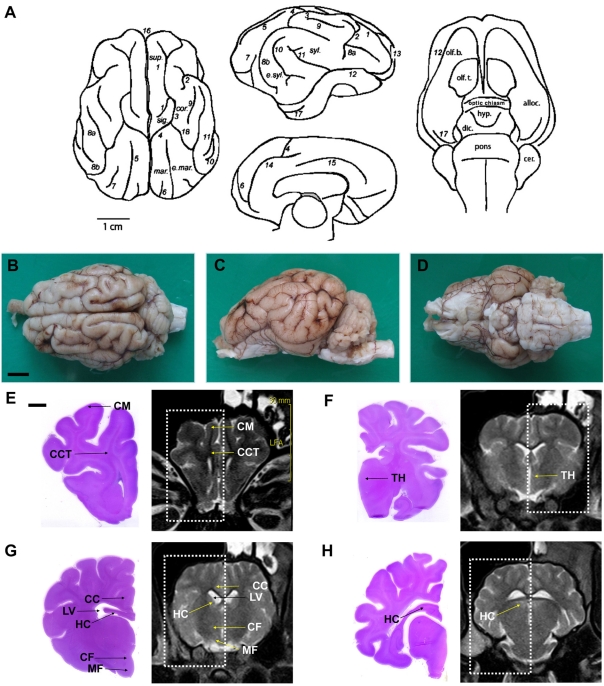 | Figure 1A minipig brain depicting (A) drawings of sulci and gyri patterns: (1) cruciate sulcus; (2) diagonal sulcus; (3) coronal sulcus; (4) ansate sulcus; (5) lateral sulcus; (6) entolateral sulcus; (7) ectolateral sulcus; (8) suprasylvii sulcus, (a) anterior, (b) posterior; (9) sulcus naris; (10) ectosylvia sulcus; (11) sylvii sulcus; (12) rhinal sulcus; (13) praesylvii sulcus; (14) splenial sulcus; (15) cingulate sulcus; (16) longitudinal sulcus; (17) sagittal sulcus; (18) coronal sulcus. cer., cerebellum; cor., coronal gyrus; dic., diencephalons; e.mar., ectomarginal gyrus; e.syl., ectosylvian gyrus; hyp., hypothalamus; mar., marginal gyrus; olf. b., olfactory bulbus; olf. t., olfactory tubercle; sig., sigmoid gyrus; sup., superior frontal gyrus; syl., sylvian gyrus [23]. Scale bars represent 1 cm. (B) superior, (C) lateral and (D) inferior view of a perfusion-fixed whole brain. Normal structures of cerebrum, axial section. Scale bars represent 1 cm. H&E-stained histological section and MR image at the level of the anterior of corpus callosum (E) and the optic chiasm region (F). (G) Histological section and MR image at the level of the mammillo-thalamic tract (MF) and the column of fornix (CF) seen as four hypothalamic, delicately stained rounded structures. In the corresponding MRI, CF dorsally and MF ventrally are found as four round structures in the hypothalamus. (H) Histological section and MR image at the level of the front of posterior of corpus callosum. Scale bars represent 0.5 cm. CM, cerebral medulla; CCT, cerebral cortex; TH, thalamus; LV, lateral ventricle; CC, corpus callosum; HC, hippocampus.
|
T2- and T1-weighted imaging sequences provided good contrast and spatial resolution for identification of most clinically relevant brain anatomy in both the axial and sagittal planes (Figure 2). However, T2-weighted images were the most useful for identifying clinically relevant neuroanatomy. Using a slice thickness of 3.0 mm enabled reduced-volume averaging and improved spatial resolution of smaller structures (Figures 3-4). Axial plane images are shown in Figure 3. Sagittal plane images are shown in Figure 4. The striatum was fairly large, appearing as two compartments, namely the putamen and caudate nucleus. The caudate nucleus is an elongated mass of gray matter which is closely related to the lateral ventricle. The putamen is the largest part of the striatum and its most rostral portion is located lateral to the head of the caudate nucleus, separated by the anterior part of the internal capsule. The putamen is separated from cortical tissue by the external capsule (Figure 3). On sagittal T1-weighted MR images of the posterior pituitary lobe, the adenohypophysis is isointense relative to gray matter and the neurohypophysis is hyperintense (Figure 4). The globus pallidus forms the more medial part of the stratum and it is separated from the putamen by a thin layer of white matter called the lateral medullary lamina (Figures 5A-5C). The substantia nigra was identified as a broad band of gray matter dorsal to the cerebral peduncle extending from the level of the red nucleus (Figure 6A). The entire hippocampus could be visualized (Figures 6A-6C). Also, on sagittal T1-weighted MR images of the hippocampus could be visualized (Figure 6D).
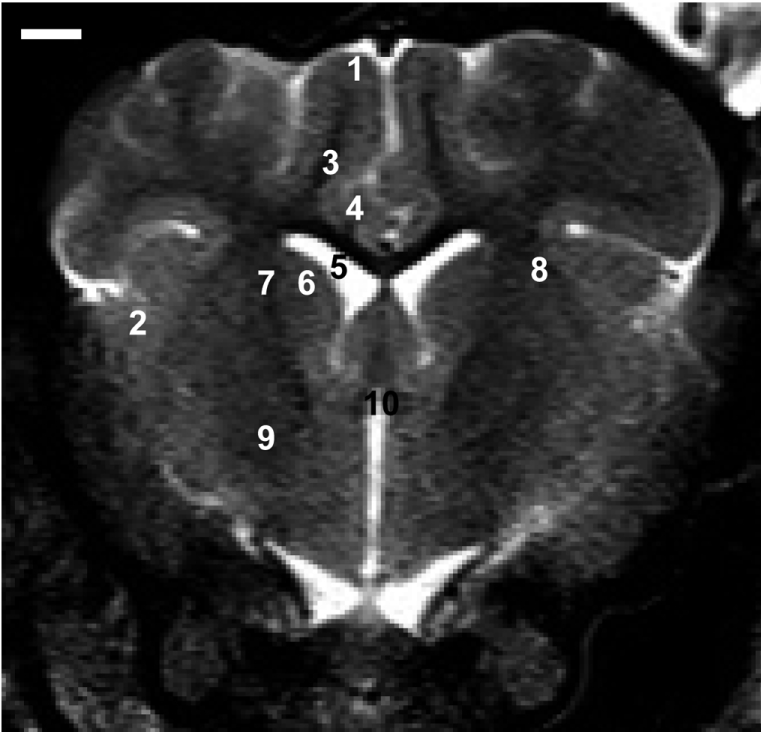 | Figure 3Representative axial T2-weighted images at the anterior commissure level. Frontal cortex (1), temporoparietal cortex (2), subcortical white matter (3), corpus callosum (4), lateral ventricle (5), caudate nucleus (6), internal capsule (7), putamen (8), globus pallidus (9), and anterior commissure (10) are present. Scale bar represents 0.5 cm.
|
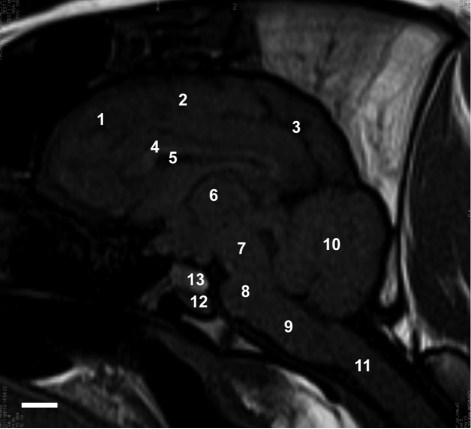 | Figure 4Sagittal T1-weighted MRI. frontal lobe (1), parietal lobe (2), occipital lobe (3), corpus callosum (4), lateral ventricle (5), thalamus (6), midbrain (7), pons (8), medulla oblongata (9), cerebellum (10), spinal cord (11), adenohypophysis (12), and neurohypophysis (13). Sagittal T1-weighted MRI shows the posterior pituitary lobe. The adenohypophysis is isointense relative to gray matter and the neurohypophysis is hyperintense. Scale bar represents 1 cm.
|
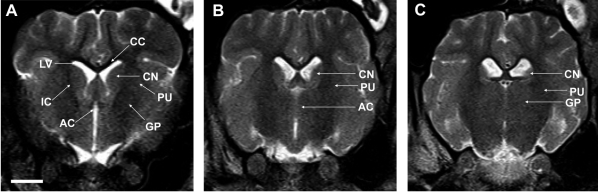 | Figure 5Striatum identified as a large two-compartment structure divided into the putamen (PU) and the caudate nucleus (CN) by the internal capsule (IC). Laterally, the PU is separated from the cortical tissue by the external capsule (A). Posteriorly, only the tail of the CN is visualized and the PU becomes dominate. The anterior commisure (AC) connects the hemispheres ventrally (B). At the AC level, a band of white substance, pars posterior of the AC, separates the most posterior parts of the PU from the globus pallidum (GP). Subdivision of the GP into internal and external segments was not possible (C). Scale bar represents 1 cm. LV, lateral ventricle; CC, corpus callosum.
|
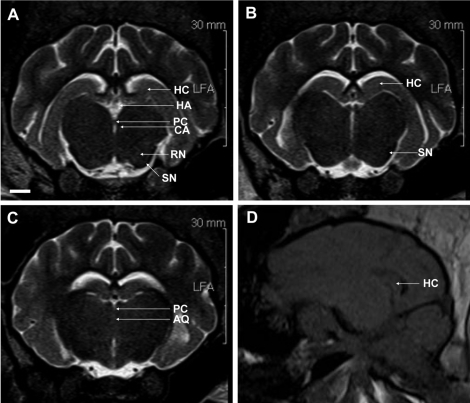 | Figure 6The substantia nigra (SN) is seen as a band of white matter dorsal to the dark cerebral peduncle, ventro-lateral to the bilaterally visible red nucleus (RN), a distinct rounded structure separated from the midline by the midbrain tegmentum. Habenular nuclei (HA) are also visualized. The hippocampus is seen in its full extent dorsal to the thalamus, sweeping around it to the temporal lobe (A-C). Sagittal T1-weighted MRI shows the hippocampus (D). Scale bar represents 0.5 cm. HC, hippocampus; HA, habenular nuclei; PC, posterior commissure; CA, cerebral aqueduct; SN, substantia nigra; RN, red nucleus; AQ, cerebral aqueduct.
|
Go to :
Discussion
Animal models of human diseases have played a central role in biomedical research for the exploration and development of new therapies [19,20]. However, the evolutionary gap between humans and many of the applied animal models has continued to hamper direct applicability of the knowledge gained for human therapy [20,21]. Although the non-human primate model appears ideal, technical and organizational difficulties and high costs dictate the need for an alternative species. Therefore, we require animal models that reflect the geometry and complexity of the cytoarchitecture found in the human CNS as closely as possible, that are more affordable than primates. Minipigs have a relatively large brain with a human-like blood supply and immunologic response characteristics [16,20]. However, the topology of the pig hippocampus, hidden within the temporal lobe, indicates a degree of encephalization, an anatomical difference falling somewhere between that of the rodent and human brain [22]. In general, the organization of the main cortical lobes in the pig brain differs somewhat from that of humans and lacks the pronounced caudal expansion and curvature of the progressive telencephalon observed in primates [12]. Although these differences exist between pig and human brains, the pig brain, which is gyrencephalic, resembles the human brain more in anatomy, growth and development than the brains of commonly used small laboratory animals [12]. Furthermore, similarities in the gross anatomy of the pig brain to that of humans has also been demonstrated for the hippocampus, a limbic structure [23,24], as well as for subcortical and diencephalic nuclei [25,26] and brainstem structures [27,28]. Thus, the size of the pig brain permits the identification of cortical and subcortical structures by imaging techniques [12]. The CNS size and physiology and the longer lifespan of swine make them suitable for long-term evaluation of the safety and efficacy of cell therapies for CNS disorders [29,30].
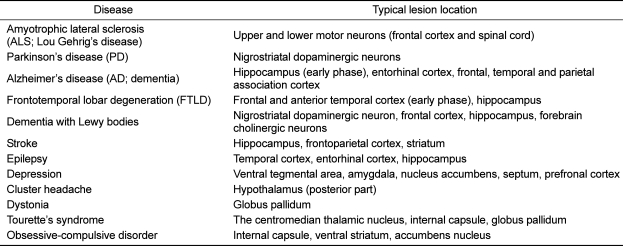
While non-invasive methods for identifying the function of a particular brain region are now well established, there is still a challenge to relate location to architecture identified microscopically [31]. Here, we describe how imaging technology can now be used to identify anatomical regions based on the underlying myeloarchitecture in the living Yukantan minipig brain. Neurologic and neurodegenerative disorders and typical lesion locations as described in Table 2 are adapted from a syndrome approach to clinical neurology [32,33]. This approach attributes predictable neurodegenerative or neurologic signs to disruption of specific tracts, nuclei or nerves within one or more of the embryologic subdivisions of the brain [15,16]. As shown in Table 2, multifocal lesions or diffuse brain disease will also usually present with multiple neurologic signs, making neuroanatomic localization more complex.
Most people are familiar with MRI scans of the brain and the way they depict the internal structures of this fascinating organ [31]. The most striking feature in such scans, apart from the overall shape of the pig head, is the distinction between the convoluted surface of the brain, the cerebral cortex and the white matter connections that join different parts of the brain [31]. While MRI is useful to map the concentration of water in structures being imaged, the distinction between white matter and grey matter is resolved in a much more subtle way [16]. In the future, high-resolution MRI could become a standard method of detecting pathological changes in the brain at the earliest possible occasion, leading to early treatment and minimization of irreversible damage. In the present study, we used T1/2-weighted MRI results from six Yukatan minipigs as the basis for developing a volumetric and stereotaxic pig brain atlas. Automatic coregistration of the pig brain was obtained using 12 degrees of freedom, rather than 9 degrees typically used in human studies [34]. The relatively greater spatial uniformity of the smaller pig brain facilitates coregistration with a higher number of fitting parameters [34]; thus, the 3D surface rendering of the average pig brain preserves the major sulcal anatomy. In particular, the Sylvian fissure and the coronal fissure can clearly be seen in the average brain surface rendering. However, the fine details of sulcal and gyral anatomy were lost in the coregistration and averaging process. Furthermore, the detailed segmentation of subcortical structures is impossible to see with the present 1-T imaging. New MR data to be acquired with a 3-T magnet and with longer scanning times should improve the surface rendering of the pig brain and also reveal subcortical anatomic details. Current efforts are directed toward the registration of high-field images to histologic material sectioned in the anatomical planes defined in the common coordinate system. Although various researches on swine brain strains by MR imaging was reported, minipig brain research is concentrated in the most common or smallest miniature breeds such as Göttingen [16]. Our study provided moderate miniature breed data on macroscopic or microscopic background descriptions in the laboratory setting. Also, this work provides the basis for a planned systemic comparison of gender, age and strain differences in minipig neuroanatomy for the bio-organ research field.
Go to :
 XML Download