

 PDF
PDF ePub
ePub Citation
 Print
Print


Hyperglycemia has been shown to be a primary factor in the development of diabetic nephropathy [1]. Glomerular epithelial cells (GECs), which are located in the renal cortex, play an important role in the regulation of kidney function, and hyperglycemia-induced dysfunction of GECs is implicated in the onset of diabetic nephropathy. In particular, loss of GECs in diabetic nephropathy is a major factor that induces the dysfunction of glomerular filtration and eventually induces albumin and proteinuria [2].
EPO, a 30.4-kDa glycoprotein, is produced mainly by peritubular fibroblasts of the renal cortex in adult life [3]. In general, erythropoietin (EPO) controls erythropoiesis in bone marrow through erythropoietin receptor-mediated signaling pathways [4]. EPO production is generally induced by hypoxic conditions. However, non-hematopoietic effects of EPO such as effects on the heart, brain, and kidney have been published [5-7]. In addition, a recent report suggested that endogenous EPO production is associated with inflammation and mortality in diabetic chronic kidney disease [8]. Therefore, we hypothesized that the expression of EPO and EPO receptor (EPOR) under diabetic conditions are altered in rat GECs in vitro. This suggests that an understanding of the patterns of EPO regulation in the kidney will provide important insights into processes mediated by diabetic nephropathy. The present study is aimed at investigating the effect of high glucose on the expression of EPO and EPOR phosphorylation in rat GECs.
Materials and Methods
Materials
Dulbecco's Modified Eagle's Medium (DMEM) and Ham's nutrient mixture F-12 (F-12) were purchased from Life Technologies (Gibco BRL, Grand Island, NY, USA). Fetal bovine serum (FBS) was purchased from HyClone (Logan, Utah, USA). D-Glucose was obtained from Sigma Chemical Company (St. Louis, MO, USA). EPO, phospho-EPOR, and actin were purchased from Santa Cruz Biotechnology (Santa Cruz, CA, USA). Goat anti-rabbit IgG and rabbit anti-mouse IgG were purchased from Jackson Immunoresearch (West Grove, PA, USA). All reagents were of the highest purity commercially available.
Cell cultures
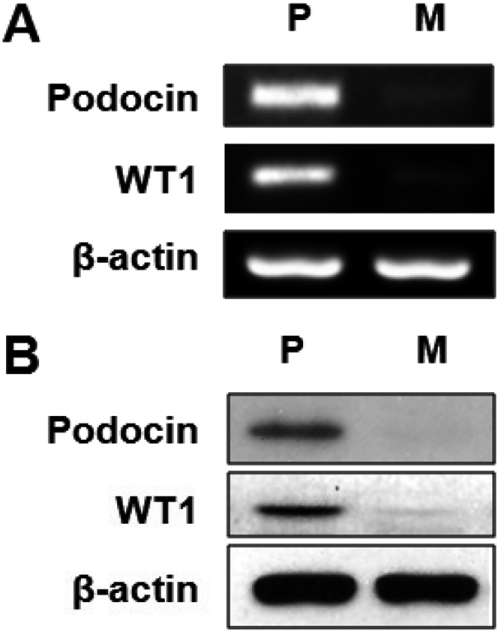
Rat visceral GECs were isolated and characterized as described by Kreisberg et al [9]. These cells were used between passages 10 and 12. The culture medium for glomerular epithelial cells was DMEM/Ham's F-12 (1:1) supplemented with 10% FBS. Glomerular epithelial cells were grown to confluence in 60 mm dishes in DMEM/Ham's F-12 (DMEM, Gibco BRL, Grand Island, NY, USA; F-12 Nutrient Mixture, Gibco; obtained without glucose and then supplemented by adding glucose to the appropriate concentrations) with 15 mM HEPES buffer, 10% FBS, 5.5 mM glucose, 0.35% additional sodium bicarbonate, 2.5 mM L-glutamine, and 1% penicillin/streptomycin at 37℃. The cells were maintained at 37℃ in 5% CO2 in a humidified cell culture incubator. The media was changed every other day. Passaged cells were plated to yield near-confluent cultures at the end of the experiments. These cultured cells exhibit the markers of podocytes. Podocin and WT1 that are podocyte specific markers were strongly expressed in cultured podocytes, but not in mesangial cells (Figures 1A and 1B).
RNA isolation and reverse transcriptase-polymerase chain reaction (RT-PCR)
Total RNA was extracted from the cells using TRIzol, which is a monophasic solution of phenol and guanidine isothiocyanate and which was purchased from Invitrogen (Carlsbad, CA, USA). Reverse transcription was carried out with 1 µg RNA using a reverse transcription system kit (AccuPower® RT Premix, Seoul, Korea) with oligo-dT18 primers. Then the RT products (1 µL) were amplified with a PCR kit (AccuPower® PCR Premix). The primers used were 5'-CCTCTGGGCCTCCCAGTCCT-3' (sense) & 5'-CCTCCCCTGT GTACAGCTTC-3' (antisense) for EPO, 5'-GATAGGTGTCCAG GCAGGGT-3' (antisense) for podocin, 5'-CCACCTCCAGTGTA TGGCTG-3' (sense) & 5'-GGGTACGCACACATGAAAGG-3' (antisense) for WT-1, and 5'-GTACAGTTGTTGGCGAGCA-3' (sense) & 5'-TGCATCAGAAGTAAGCCTCTC-3' (antisense) for β-actin. They were used as a control to confirm the quantity of RNA. The RT-PCR products were separated and visualized on 1.2% agarose gels. The PCR products were analyzed by calculating the ratio of the high glucose treatment group relative to the control group, and standardizing the data relative to β-actin.
Western blotting
The reactions were stopped by quick freezing in a dry ice bath. The medium was then removed and the cells were washed twice with ice-cold phosphate buffered saline (PBS), scraped, and then harvested by microcentrifugation (3,000 rpm for 10 min) and removal of the supernatant. The pellet was resuspended in lysis buffer (20mM HEPES, 10% glycerol, 0.5% Triton X-100). The resuspended cells were lysed mechanically on ice by vortexing. The lysates were centrifuged at 15,000 rpm for 10 min at 4℃. The supernatants were whole cell fractions. The protein level was quantified using the Bradford procedure. Whole cells (50 µg of protein) were separated by 10% sodium dodecyl sulfate-polyacrylamide gel electrophoresis (SDS-PAGE) and transferred to an enhanced nitrocellulose membrane. The blots were then washed with TBST (10 mM Tris-HCl, pH 7.6, 150 mM NaCl, 0.05% Tween-20), blocked with 5% skim milk (made from a powder) in TBST for 1 h and incubated for 2 h at room temperature with the primary antibody at the dilutions recommended by the supplier. The membrane was then washed with TBST, and the secondary antibodies conjugated to horseradish peroxidase were incubated for 2 h at room temperature. The bands were visualized using Amersham ECL™Western Blotting Detection Reagents (GE Healthcare, UK) on X-ray film (Kodak BioMax Light Film; Kodak, Tokyo, Japan). To confirm equal amounts of protein loaded for each sample, blots were subsequently stripped using a low pH-buffer containing 1 M glycine, pH 2.0 and 1% SDS and then reprobed with an antibody that specifically recognized β-actin in the membranes first treated. The protein in each sample was quantified as described previously [10].
Results
Time and dose dependent effects of high glucose on the expression of EPO mRNA and protein content in rat GECs.
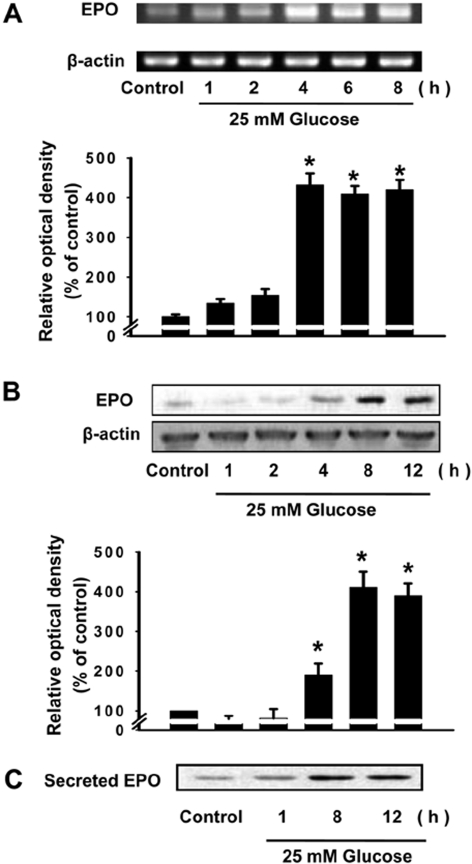
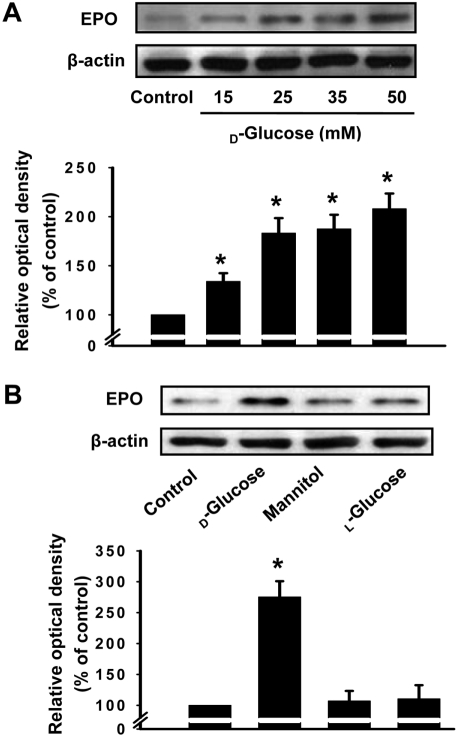
The time dependent effects of high glucose on EPO mRNA and protein content were determined by exposing rat GECs to 25 mM glucose for various times (0 to 12 h). Glucose (25 mM) significantly upregulated EPO mRNA levels over a 4-h period; the maximum stimulatory effect was observed between 4 and 8 h (Figure 2A). We also examined the effect of high glucose on protein levels of EPO. As shown in Figure 2B, 25 mM glucose significantly upregulated the expression of EPO protein levels, which correlated with EPO mRNA expression. In addition, high glucose stimulated the secretion of EPO in a time dependent manner (>8 h) by analyzing the media using TCA precipitation (Figure 2C). The dose dependent effect of high glucose on the expression of EPO mRNA and protein content was also determined. As shown in Figure 3A, above 15 mM D-glucose there was an increase in EPO protein expression. High glucose concentrations can result in altered medium osmolarity. To rule out an influence of altered osmolarity on glucose uptake, we tested the effects of mannitol and L-glucose. Although 25 mM D-glucose upregulated the expression of EPO protein, 25 mM mannitol and L-glucose did not (Figure 3B).
The effect of high glucose on the phosphorylation of EPO receptors in rat GECs
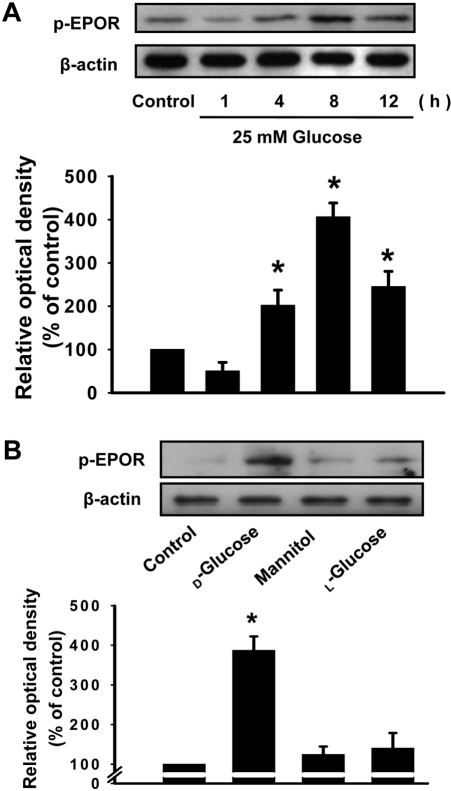
We investigated the effect of high glucose on EPOR expression. Glucose (25 mM) significantly stimulated the phosphorylation of EPOR over a 4-h period (Figure 4). These results suggest that endogenous EPO secretion induced by high glucose activates EPOR in rat GECs. To rule out an influence of altered osmolarity on glucose uptake, we also tested the effect of mannitol or L-glucose. Although 25 mM D-glucose stimulated the phosphorylation of EPOR, 25 mM mannitol and L-glucose did not (Figure 4B).
Discussion
This study demonstrated that high glucose stimulates EPO secretion in rat GECs. Until now, it has been reported that EPO expression was restricted to the peritubular cells of the kidney. However, recently, several lines of evidence have shown that EPO synthesis is evident in diverse cells such as astrocytes and hepatocytes [11,12]. In kidney, the evidence that proximal tubule cell and glomerular epithelial cells produce EPO protein was reported, although the major sites of EPO production are peritubular cells of the renal cortex [13,14]. Those reports are in accordance with our results. It is generally accepted that EPO secretion is induced by hypoxia. Our study suggests that EPO is secreted from rat GECs in the presence of extracellular factors such as hyperglycemia.
In our study, high glucose stimulated EPO mRNA and protein expression and secretion in rat GECs. These stimulatory effects are D-glucose-specific and unlikely due to an osmotic effect since the responses were not mimicked by mannitol or L-glucose. The stimulatory effect on EPO expression is contradictory to reports from clinical studies that plasma EPO is often low in diabetic patients with anemia and without anemia [15,16]. Several lines of evidence indicate that treatment with EPO protects against high glucose-induced dysfunction of pancreatic beta cells and renal tubular cells [17,18]. Therefore, we surmised that the levels of endogenously secreted EPO in response to high glucose contribute to early protection against diabetic nephropathy and the depletion of EPO protective role can aggravate the development of diabetic nephropathy. Our results are in agreement with an in vivo report that increases in EPO secretion during diabetic pregnancies may be responsible for the body's early endogenous protective mechanisms against diabetic complications [19]. The action of EPO is mediated by activation of the EPO receptor [5]. Our study also reported that high glucose stimulates phosphorylation of the EPOR in rat GECs (Figure 4). Rat GECs also retain erythropoietin receptor mRNA and protein [20]. Furthermore, in this study, the pattern of EPO protein expression in response to high glucose correlated with EPOR phosphorylation. These results suggest that stimulation of EPO secretion by high glucose activates EPO receptors in rat GECs. We firstly demonstrated that high glucose alone stimulates EPOR phosphorylation. The protective effects of the endogenous EPO-EPOR system were observed in non-hematopoietic cells [21,22]. A recent study reported a similar finding, that exposure of cells to EPOR activator evoked protective effects against non-ischemic diabetic kidney injury [23]. Here we provide evidence that endogenous EPO-EPOR coupling protects against diabetic nephropathy in its early stages. Whether stimulation of EPO production under hyperglycemic conditions in this study has clinical implications is not certain but a protective effect against diabetic nephropathy may be elicited. Further studies are required to understand which signaling molecules are involved in the effect of high glucose. In conclusion, we demonstrated that high glucose stimulates EPO expression and secretion and EPOR phosphorylation in rat GECs. These effects may be associated with early protection against renal damage in diabetic nephropathy.
 XML Download