Journal List > Allergy Asthma Immunol Res > v.9(6) > 1052695

Kang, Kim, Song, Kim, Jo, Lee, Kwon, Lee, Park, Park, Park, Chang, Lee, Lee, Jee, Lee, Choi, and Cho: Patterns of Inhalant Allergen Sensitization and Geographical Variation in Korean Adults: A Multicenter Retrospective Study

Abstract

Purpose

Inhalant allergen sensitization is one of the major factors involved in the pathogenesis of allergic respiratory diseases. However, the sensitization is determined by interactions between genetic and environmental factors. Thus, testing panels of inhalant allergens may differ among geographical areas. Here we aimed to determine 10 common inhalant allergens in Korean adult patients with suspected respiratory allergies and to examine the variation between different geographical locations.

Methods

A total of 28,954 patient records were retrieved for retrospective analysis, from 12 referral allergy clinics located in 9 different areas. Inclusion criteria were Korean adults (≥18 years old) who underwent the inhalant allergen skin prick test for suspected history of respiratory allergy. The primary outcome was inhalant allergen skin prick response. Demographic and clinical information were also collected. Positive skin prick responses to allergens were defined as allergen-to-histamine wheal ratio ≥1. Based on skin test results, the most prevalent aeroallergens were determined.

Results

The overall prevalence of allergic sensitization was 45.3%. Dermatophagoides farinae and Dermatophagoides pteronyssinus were the most commonly sensitized allergens. Other common inhalant allergens were cat epithelium (8.1%), birch (7.7%), mugwort (6.9%), alder (6.7%), hazel (6.7%), beech (6.7%), oak (6.6%), and Tyrophagus putres (6.2%), in decreasing order frequency. These 10 inhalant allergens explained 90% of inhalant allergen sensitization in the study participants. However, distinct patterns of the 10 inhalant sensitization were observed in patients living in Chungnam and Jeju. American cockroach, Gernam cockroach, and Trichophyton metagrophytes were unique in Chungnam. Orchard, Japanese cedar, and Velvet were unique in Jeju.

Conclusions

The present analysis suggests a panel of 10 most common inhalant allergens in Korean adult patients with suspected respiratory allergies, which explained 90% of inhalant allergen sensitization. This panel can be utilized as a practical and convenient tool for primary practice and epidemiological surveys of respiratory allergic diseases.

INTRODUCTION

IgE sensitization to inhalant allergens is one of the major components underlying the pathophysiology of allergic respiratory diseases like asthma and rhinitis. Among several tools to assess inhalant allergen-specific IgE sensitization, the skin prick test is one of the most useful tests for its high sensitivity and simplicity. The status of inhalant IgE sensitization is determined by interactions between genetic and environmental factors, and may differ between populations.123 Thus, testing panels of inhalant allergen need localization.
Current panels of the inhalant allergen skin test in Korean adults were based on previous studies conducted a relative small number of institutions, such as a study involving 2,554 adult patients recruited from the referral centers located in 3 different areas (Seoul, Suwon, and Jeju) in 2001.4 These results have been also utilized in several community-based population surveys on allergic diseases in Korean adults.567 There have been several additional studies on the sensitization rates of inhalant allergens in Korean patients.891011 However, how the panels of skin prick testing for common inhalant allergens differ among areas was not addressed in those studies, as they were mostly restricted to specific centers or locations.891011 Here we performed a retrospective multicenter survey involving 12 referral allergy clinics located in 9 different areas in Korea, to identify recent common inhalant allergens in adult patients with allergic symptoms and to examine the regional difference in common inhalant allergen sensitization. Doing this, we aimed to suggest a panel of major inhalant allergens for skin prick testings to be used in further clinical practice and epidemiological surveys of Korean adults.

MATERIALS AND METHODS

Study design

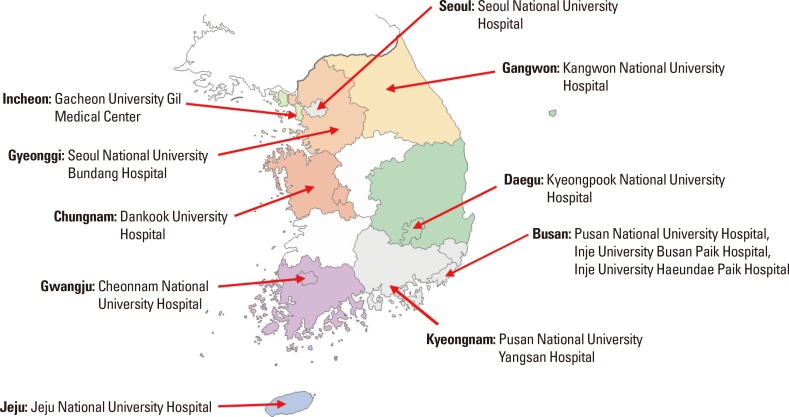
A retrospective study of medical records was performed in 2014, as an integral part of the project of ‘Standardization of diagnostic tests for allergic diseases in adults.’ A total of 12 referral allergy clinics located in 9 different areas covering all provinces in Korea were enrolled (Fig. 1): Seoul National University Hospital (SNUH) in Seoul, Seoul National University Bundang Hospital (SNUBH) in Seongnam, Gacheon University Gil Medical Center (GUGMC) in Incheon, Kangwon National University Hospital (KWNUH) in Chuncheon, Dankook University Hospital (DKUH) in Cheonan, Kyungpook National University Hospital (KPNUH) in Daegu, Inje University Busan Paik Hospital (IUBPH), Inje University Haeundae Paik Hospital (IUHPH), Pusan National University Hospital (PNUH) in Busan and Pusan National University Yangsan Hospital (PNUYH) in Yangsan, Cheonnam National University Hospital (CNUH) in Gwangju, and Jeju National University Hospital (JNUH) in Jeju. The study period was slightly different between individual clinics, and detailed information on the study period was described in supplementary Table 1. A retrospective review was performed on adult patients (≥18 years old) who visited referral allergy clinics for their respiratory symptoms suggestive of asthma or rhinitis and underwent inhalant allergen skin prick testing. Medical record reviews included clinical history, demographics (age, gender, and residential areas), final diagnosis for allergic diseases and skin prick test results (the list of tested allergens and wheal sizes of allergens and controls). The patients were reclassified according to area for further analyses, depending on their registered residential places in electronic health records of each institution. The study protocol was approved by the Institutional Review Board of each participating institution.

Skin prick test

The skin prick test was performed by trained specialists in each institution with in-hospital protocol. The histamine (1.0 or 1.7 mg/mL) was used for a positive control and physiologic saline was used for a negative control. Participants who did not react to histamine or reacted to physiologic saline were excluded in the present analyses. The skin test results were interpreted after 15 minutes by measuring the mean size of flares and wheals for each allergen. Considering variations in the source and concentrations of allergen extracts and controls between centers, the allergen-to-histamine ratio was utilized to determine the positivity. A skin prick test was considered positive of the mean wheal size for any allergen was greater than or equal to that for histamine (A/H ratio≥1).12 Allergen extracts manufactured by the Allergopharma, Lofama and Allergy Therapeutics were used in our study population, which are listed in supplementary Table 1.

Statistical analysis

All statistical analyses were performed using SPSS version 20.0 (SPSS Inc., Chicago, IL, USA) and spreadsheet of Excel (Microsoft Corporation, Redmond, WA, USA) made by Neyeloff.13 The regional prevalence of sensitization to each allergen, and overall sensitization were estimated with arithmetic mean and confidence intervals by using logistic regression for binary outcomes. Nationwide sensitization profile of allergens were also meta-analyzed after adjusting for the heterogeneity of population composition according to the 2010 Korean population and housing census.14

RESULTS

Baseline characteristics of study population and summary of allergens tested

A total of 28,954 adult patients were enrolled from the 12 allergy clinics of referral hospitals in 9 different areas. As described in the Materials and Method section, all the participants were re-classified based on their residential areas for further analyses of geographic difference, but not the location of the enrolled clinic. The clinical findings were summarized in Table 1. The mean age of the total population was 45.6±17.0 years and elderly participants who were older than 65 years accounted for 15.1% of the study population. The percentage of females was 53.3%. In total, 66.8% of patients were finally diagnosed with asthma or allergic rhinitis. The other diagnoses included chronic sinusitis, upper airway cough syndrome, and chronic idiopathic cough.
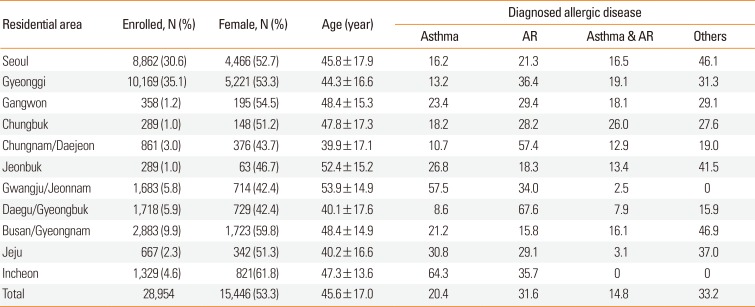
Detailed information on commercial inhalant allergens tested in each hospital was listed in supplementary Table 1. A total of 92 different allergens were found to be utilized in at least 1 institution, which included 6 types of mite allergens, 2 types of cockroach allergens, 13 types of mold allergens, 11 types of animal allergens, 17 types of tree allergens, 10 types of grass allergens, and 8 types of weed allergens. Sixteen allergens were found to be utilized in all participating centers: Dermatophagoides farina (Der f), Dermatophagoides pteronysimus (Der p), German cockroach, Alternaria, Cladosporium berbarum and Aspergillus fumigatus, alder, ash, hazel, poplar, birch, rye, nettle, ragweed, mugwort, and Japanese hop. The following 18 allergens were found to be tested in most centers (9 of 12): Tyrophagus putrescentiae, Penicilliun notatum, cat epithelia and dog epithelia, elder, elm, willow tree, acacia, beech, pine, oak, plane tree, orchard, timothy, meadow and bermuda grass, dandelion, and plantain. The following 10 allergens were exclusively being used in Jeju: Panonychus citrus, Trychophyton metagrophytes, Helminthosporium, hay dust, Jeju cedar, rape, dog's tail grass, vernal grass, Johnson grass, and feather mix.

Sensitization profiles of inhalant allergens and their geographical difference

The sensitization profiles of individual allergens according to area were summarized in Table 2. A total of 45.3% of study participants had at least 1 positivity in their skin prick tests. The mean number of allergens in sensitized patients were 4.5±2.2, and 60.8% of the participants were sensitized to more than 3 allergens. The positivity rate was relatively high in Daegu (54.1%) and Jeju (53.8%), and relatively low in Incheon (36.3%), Jeonbuk (33.7%), and Jeonnam (26.8%). Fig. 2 shows the overall sensitization rate for each allergen tested. Der f and Der p were the most commonly sensitized allergens (29.0% and 28.2%, respectively).
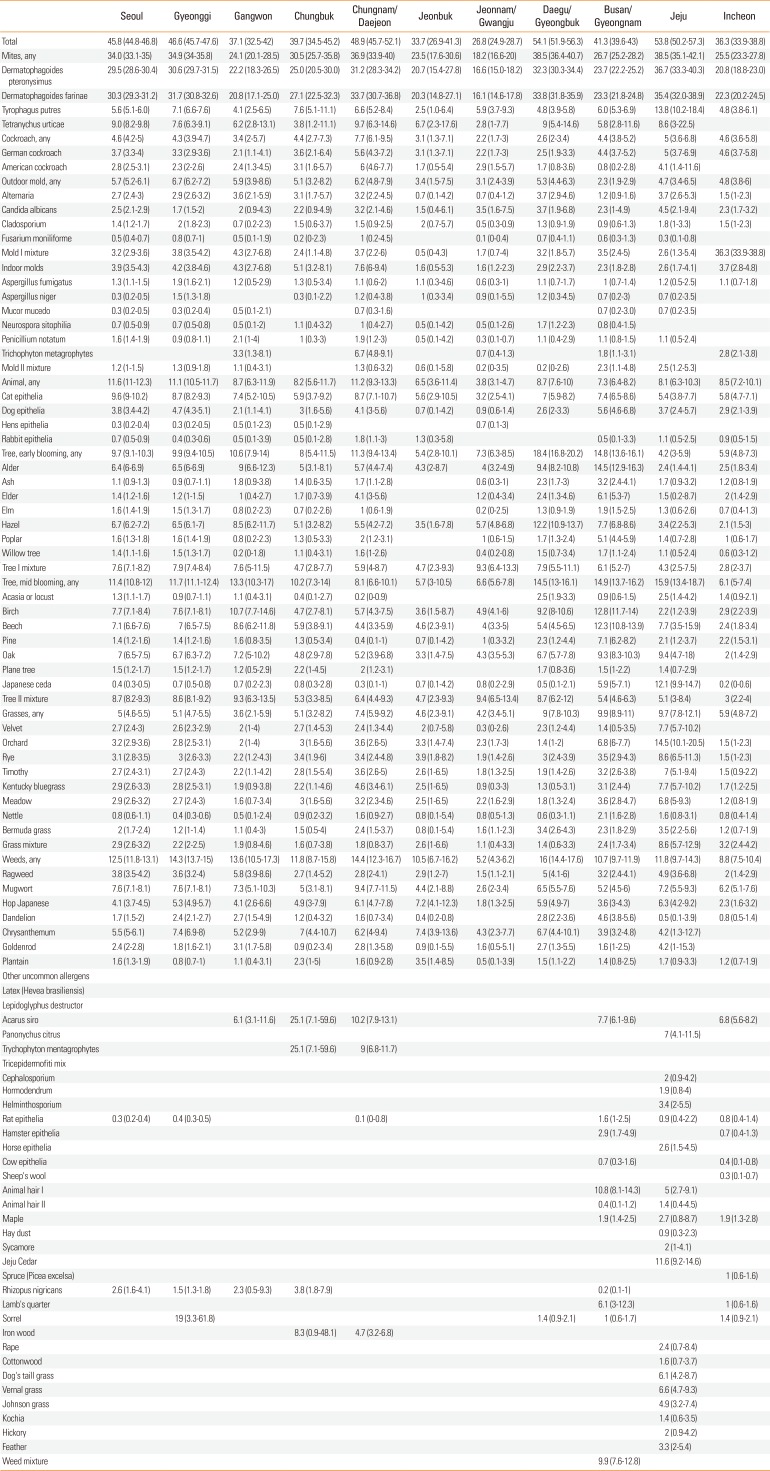
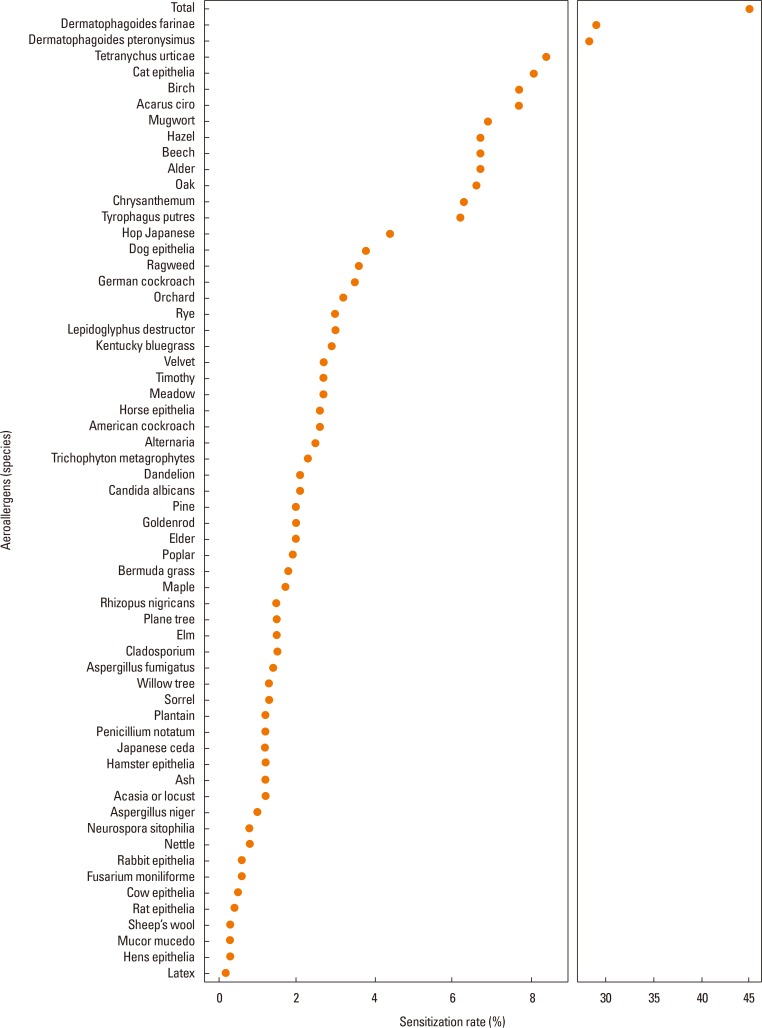
For allergen groups, about one-third (32.4%) of all the study participants were sensitized to mites. Among pollens, sensitization to tree pollens was found to be most prevalent (13.3%), followed by weed pollens (12.5%) and grass pollens (6.4%). Sensitization rate to the animal allergen group was about 10%. Sensitization rate to the other allergens except cat (8.1%) and dog (3.8%) were lower than 1.0%. Sensitization rates to outdoor molds were slightly higher than those to indoor molds (5.4% vs 3.7%).
Seven out of 10 sensitized patients were sensitized to house dust mites (Dp or Df). Other common inhalant allergens were cat epithelium (8.1%), birch (7.7%), mugwort (6.9%), alder (6.7%), hazel (6.7%), beech (6.7%), oak (6.6%) and Tyrophagus putres (6.2%), in decreasing order of frequency. Ninety percent cases of inhalant allergen sensitization could be detected by testing these 10 inhalant allergens.
The panel of 10 most commonly sensitized inhalant allergens was similar among areas, except Chungnam and Jeju (Table 3). Since Jeju Island is an island geographically separated from mainland Korea, its sensitization profile of inhalant allergens was considerably different from that of mainland Korea. Der f and Der p were also the most common inhalant allergens, accounting for 75% of inhalant allergen sensitization, and Tyrophagus Putrescentiae, Tetranychus urticae, and mugwort were also prevalent in Jeju. However, Japanese cedar, which is the fifth most common allergen was considerably more sensitized in participants from Jeju (12.4% vs 0.6%, P<0.001). Grass pollens, such as orchard, rye, and velvet, were considerably more sensitized in participants from Jeju. This Jeju-specific inhalant allergen panel could explain 9 of 10 patients who had atopy in Jeju, which were considerably higher than the other areas (only 75%). The types of top 10 allergens were also different between Chungnam and the other areas. American cockroach, German cockroach, and Trichophyton metagrophytes were found to be area-specific.
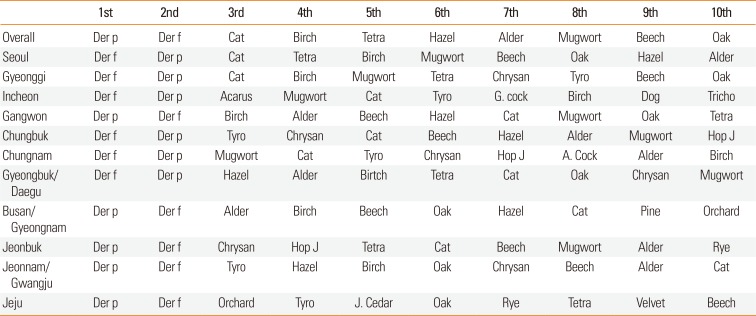
DISCUSSION

To get representativeness, we attempted to include areas evenly and adjusted for population according to 2010 Korean population and housing census.14 The number of subjects was about 11-fold larger than a previous multicenter study in Korea.4
The first aim of our study was to summarize variable allergens which were used in actual medical practice. Each hospital used its own inhalant panel which was not perfectly same as other hospitals. Thus, we could not determine the exact sensitization rate to each allergen. For example, Tetranychus urticae was included in not all hospitals despite belonging to the top 10 allergens. Only 3 hospitals performed skin testing for this allergen, and 1 hospital used this allergen regularly. Furthermore, despite their high antigenicity, beech, oak, orchard, and timothy were not used in 3 hospitals. Some hospitals did not use cat, beech, and oak that belong to top 10 allergens. Some patients were diagnosed with atopy in one hospital, but not in another hospital. We cannot test all inhalant allergens available, so we need to make a standardized allergen panel for clinical use by considering the significance of each allergen.
The second aim of our study was to rank common sensitized inhalant allergens and to find their geographical and temporal difference. Over one-third of patients were sensitized to house dust mites (Der p and Der f). Among pollens, tree pollens was most common (tree, weed, and grass in decreasing order of frequency). Among animals, dog and cat epithelia were most common. This might be related to the frequency of exposure. For the same reason, patients were more sensitized to indoor molds than outdoor molds. In 2003, common allergens were mites (Der p, Der f, and Teranychns urticae), animals (cat, dog, and cockroach), tree pollen (mixtures I, and II), mugwort, ragweed, Japanese hop, chrysanthemum, and Jeju cedar.4 In our study, mites (Der p, Der f, and Tyrophagus), cat, tree pollen and mugwort showed higher sensitization rates. Japanese cedar or Jeju cedar was still considerably more sensitized in participants from Jeju.15 In Chungnam, cockroach and Trichophyton showed higher sensitization rates than in other areas. Compared to the previous 10 years, sensitization rate to mites is still higher than in other allergens.4 Among pollens, sensitization rate to tree pollens was higher than that to weed pollen. Temporal changes were also found geographically. The most common allergens in Seoul were Der p, Der f, Tetranychus urticae, Tyrophagus putrescentiae, and Panonychus citri in decreasing order of frequency.4 However, in our study, the most common allergens in Seoul were Der p, Der f, cat, Tetranychus urticae, and mugwort. There have been several studies showing temporal changes in sensitization.41617 We should investigate the reasons why the pattern of sensitization changes. One of the main reasons to specify the allergen panel nationally, regionally, and temporally is that amounts and types of exposure to allergens may vary among different climates and geographic characteristics.18 In our study, frequency and types of top 10 allergens were different among areas, especially in Chungnam and Jeju. In Jeju, many region-specific allergens found tested in many studies.41719 Without such studies, patients with atopy could be underdiagnosed in Jeju. In our study, the types of allergens were similar among the areas of mainland Korea except Chungnam, but were different between Jeju Island and them. This may due to differences in biological environment and climate. Not only current regional difference in inhalant allergens but also global warming would influence the change of allergen type in the future. More studies are needed to confirm our results. If the change is not completely determined, it may be necessary to change the panel at regular intervals.
The third aim of our study was to find top 10 allergens. If these 10 allergens are used in the diagnosis of patients, we can detect 90% of patients with the allergen panel would be useful in hospitals with limited time and resources.
Our study has several limitations. First, we enrolled patients who visited mainly tertiary hospitals. A larger number of patients who have mild to moderate allergic symptoms received medical treatment in local hospitals. This could be a bias to sensitized profiles. Further studies of patients who visit primary and secondary hospitals are needed. Second, some allergens were intermittently tested during the study period because of inadequate allergen supply from oversea manufacturers. Thus, the overall sensitization rate was difficult to analyze. It is important to maintain adequate allergen extract supply for further studies. In addition, it is necessary to develop allergen extracts suitable to domestic situations. Third, the difference in allergen extracts manufactured by Allergopharma, Lofama, and AllergyTherapeutics can cause the heterogeneity of sensitization profiles among institutions. This could be an important confounding. Actually, we diagnosed atopy using the same criteria irrespective of the manufacturers. Thus, we defined allergen sensitization as the allergen/histamine wheal ratio (AHR) ≥1, not as absolute mean allergen wheal size ≥3 mm. Most institutions used histamine manufactured by Allergopharma (Reinbeck, Germany) and the concentration of histamine (1.0 mg/mL) is nearly the same except 1 institution (1.7 mg/mL). The skin prick test was performed by trained specialists in each institution using their in-hospital protocol. Fortunately, most institutions used 10 common allergen extracts manufactured by Allergopharma. Further studies are needed to evaluate the allergenicity of the commercial allergen extracts. Finally, we could not evaluate clinically relevance of allergens tested. Only 67.5% of patients tested were diagnosed with allergic rhinitis or allergic asthma. It is difficult to correlate symptoms to positive skin test results. The aim of this study was to find the distribution of sensitized allergens in patients who were suspected to have allergic respiratory diseases at first visit. We are planning further study to evaluate clinically relevance of allergens in patients with allergic disease.
The present multicenter study demonstrated the geographical pattern of inhalant allergen sensitization in Korean adult patients with suspected respiratory allergies. Our panel of 10 most common inhalant allergens may account for 90% of inhalant allergen sensitization in Korean adults. We hope that this panel could be utilized as a practical and convenient tool for primary practice and epidemiological surveys of respiratory allergic diseases.

ACKNOWLEDGMENTS

This research was supported by a fund (2014-ER5603) by Research of Korea Centers for Disease Control and Prevention.

Notes

This research was supported by a fund (2014-ER5603) by Research of Korea Centers for Disease Control and Prevention.

There are no financial or other issues that might lead to conflict of interest.

References

1. Newson RB, van Ree R, Forsberg B, Janson C, Lötvall J, Dahlén SE, et al. Geographical variation in the prevalence of sensitization to common aeroallergens in adults: the GA(2) LEN survey. Allergy. 2014; 69:643–651. PMID: 24654915.
2. Chan-Yeung M, Anthonisen NR, Becklake MR, Bowie D, Sonia Buist A, Dimich-Ward H, et al. Geographical variations in the prevalence of atopic sensitization in six study sites across Canada. Allergy. 2010; 65:1404–1413. PMID: 20557300.
crossref
3. Salo PM, Arbes SJ Jr, Jaramillo R, Calatroni A, Weir CH, Sever ML, et al. Prevalence of allergic sensitization in the United States: results from the National Health and Nutrition Examination Survey (NHANES) 2005–2006. J Allergy Clin Immunol. 2014; 134:350–359. PMID: 24522093.
crossref
4. Kim TB, Kim KM, Kim SH, Kang HR, Chang YS, Kim CW, et al. Sensitization rates for inhalant allergens in Korea; a multi-center study. J Asthma Allergy Clin Immunol. 2003; 23:483–493.
5. Kim YK, Kim SH, Tak YJ, Jee YK, Lee BJ, Kim SH, et al. High prevalence of current asthma and active smoking effect among the elderly. Clin Exp Allergy. 2002; 32:1706–1712. PMID: 12653160.
crossref
6. Song WJ, Kim SH, Lim S, Park YJ, Kim MH, Lee SM, et al. Association between obesity and asthma in the elderly population: potential roles of abdominal subcutaneous adiposity and sarcopenia. Ann Allergy Asthma Immunol. 2012; 109:243–248. PMID: 23010229.
crossref
7. Song WJ, Chang YS, Lim MK, Yun EH, Kim SH, Kang HR, et al. Staphylococcal enterotoxin sensitization in a community-based population: a potential role in adult-onset asthma. Clin Exp Allergy. 2014; 44:553–562. PMID: 24444125.
crossref
8. Park HJ, Lim HS, Park KH, Lee JH, Park JW, Hong CS. Changes in allergen sensitization over the last 30 years in Korea respiratory allergic patients: a single-center. Allergy Asthma Immunol Res. 2014; 6:434–443. PMID: 25229001.
crossref
9. Park HJ, Lee JH, Park KH, Ann HW, Jin MN, Choi SY, et al. A nationwide survey of inhalant allergens sensitization and levels of indoor major allergens in Korea. Allergy Asthma Immunol Res. 2014; 6:222–227. PMID: 24843797.
crossref
10. Lee JE, Ahn JC, Han DH, Kim DY, Kim JW, Cho SH, et al. Variability of offending allergens of allergic rhinitis according to age: optimization of skin prick test allergens. Allergy Asthma Immunol Res. 2014; 6:47–54. PMID: 24404393.
crossref
11. Jung JW, Choi JC, Shin JW, Kim JY, Park IW, Choi BW. Clinical characteristics according to sensitized allergens in adult korean patients with bronchial asthma. Allergy Asthma Immunol Res. 2010; 2:102–107. PMID: 20358023.
crossref
12. Adinoff AD, Rosloniec DM, McCall LL, Nelson HS. Immediate skin test reactivity to Food and Drug Administration-approved standardized extracts. J Allergy Clin Immunol. 1990; 86:766–774. PMID: 2229841.
crossref
13. Neyeloff JL, Fuchs SC, Moreira LB. Meta-analyses and Forest plots using a microsoft excel spreadsheet: step-by-step guide focusing on descriptive data analysis. BMC Res Notes. 2012; 5:52. PMID: 22264277.
crossref
14. Statistics Korea. 2010 Population and housing census. Daejeon: Statistics Korea;2011.
15. Lee J, Lee KH, Lee HS, Hong SC, Kim JH. Japanese cedar (Cryptomeria japonica) pollinosis in Jeju, Korea: is it increasing? Allergy Asthma Immunol Res. 2015; 7:295–300. PMID: 25749782.
crossref
16. Kim YJ, Han JE, Kang IJ. Change of inhalant allergen sensitization in children with allergic respiratory diseases during recent 10 years. Korean J Asthma Allergy Clin Immunol. 2004; 24:241–246.
17. Lee JJ, Lee KH, Kim JH. Japanese cedar (Cryptomeria japonica) pollinosis in Jeju, Korea; might it be increasing? J Allergy Clin Immunol. 2015; 135:AB108.
crossref
18. Oh JW, Lee HB, Kang IJ, Kim SW, Park KS, Kook MH, et al. The revised edition of Korean calendar for allergenic pollens. Allergy Asthma Immunol Res. 2012; 4:5–11. PMID: 22211164.
crossref
19. Jeon BH, Lee J, Kim JH, Kim JW, Lee HS, Lee KH. Atopy and sensitization rates to aeroallergens in children and teenagers in Jeju, Korea. Korean J Asthma Allergy Clin Immunol. 2010; 30:14–20.

SUPPLEMENTARY MATERIAL

Supplementary Table 1

Institutions and their skin test panel of inhalant allergens during study period
aair-9-499-s001.pdf
Fig. 1

The locations of the referral centers enrolled in this study.

aair-9-499-g001
Fig. 2

Overall sensitization profiles of inhalant allergens in decreasing order of frequency.

aair-9-499-g002
Table 1

Clinical findings of the study participants according to the residential area

aair-9-499-i001
Residential area Enrolled, N (%) Female, N (%) Age (year) Diagnosed allergic disease
Asthma AR Asthma & AR Others
Seoul 8,862 (30.6) 4,466 (52.7) 45.8±17.9 16.2 21.3 16.5 46.1
Gyeonggi 10,169 (35.1) 5,221 (53.3) 44.3±16.6 13.2 36.4 19.1 31.3
Gangwon 358 (1.2) 195 (54.5) 48.4±15.3 23.4 29.4 18.1 29.1
Chungbuk 289 (1.0) 148 (51.2) 47.8±17.3 18.2 28.2 26.0 27.6
Chungnam/Daejeon 861 (3.0) 376 (43.7) 39.9±17.1 10.7 57.4 12.9 19.0
Jeonbuk 289 (1.0) 63 (46.7) 52.4±15.2 26.8 18.3 13.4 41.5
Gwangju/Jeonnam 1,683 (5.8) 714 (42.4) 53.9±14.9 57.5 34.0 2.5 0
Daegu/Gyeongbuk 1,718 (5.9) 729 (42.4) 40.1±17.6 8.6 67.6 7.9 15.9
Busan/Gyeongnam 2,883 (9.9) 1,723 (59.8) 48.4±14.9 21.2 15.8 16.1 46.9
Jeju 667 (2.3) 342 (51.3) 40.2±16.6 30.8 29.1 3.1 37.0
Incheon 1,329 (4.6) 821(61.8) 47.3±13.6 64.3 35.7 0 0
Total 28,954 15,446 (53.3) 45.6±17.0 20.4 31.6 14.8 33.2
Table 2

Sensitization rates to inhalant allergens according to the residential area

aair-9-499-i002
Seoul Gyeonggi Gangwon Chungbuk Chungnam/Daejeon Jeonbuk Jeonnam/Gwangju Daegu/Gyeongbuk Busan/Gyeongnam Jeju Incheon
Total 45.8 (44.8–46.8) 46.6 (45.7–47.6) 37.1 (32.5–42) 39.7 (34.5–45.2) 48.9 (45.7–52.1) 33.7 (26.9–41.3) 26.8 (24.9–28.7) 54.1 (51.9–56.3) 41.3 (39.6–43) 53.8 (50.2–57.3) 36.3 (33.9–38.8)
Mites, any 34.0 (33.1–35) 34.9 (34–35.8) 24.1 (20.1–28.5) 30.5 (25.7–35.8) 36.9 (33.9–40) 23.5 (17.6–30.6) 18.2 (16.6–20) 38.5 (36.4–40.7) 26.7 (25.2–28.2) 38.5 (35.1–42.1) 25.5 (23.3–27.8)
Dermatophagoides pteronysimus 29.5 (28.6–30.4) 30.6 (29.7–31.5) 22.2 (18.3–26.5) 25.0 (20.5–30.0) 31.2 (28.3–34.2) 20.7 (15.4–27.8) 16.6 (15.0–18.2) 32.3 (30.3–34.4) 23.7 (22.2–25.2) 36.7 (33.3–40.3) 20.8 (18.8–23.0)
Dermatophagoides farinae 30.3 (29.3–31.2) 31.7 (30.8–32.6) 20.8 (17.1–25.0) 27.1 (22.5–32.3) 33.7 (30.7–36.8) 20.3 (14.8–27.1) 16.1 (14.6–17.8) 33.8 (31.8–35.9) 23.3 (21.8–24.8) 35.4 (32.0–38.9) 22.3 (20.2–24.5)
Tyrophagus putres 5.6 (5.1–6.0) 7.1 (6.6–7.6) 4.1 (2.5–6.5) 7.6 (5.1–11.1) 6.6 (5.2–8.4) 2.5 (1.0–6.4) 5.9 (3.7–9.3) 4.8 (3.9–5.8) 6.0 (5.3–6.9) 13.8 (10.2–18.4) 4.8 (3.8–6.1)
Tetranychus urticae 9.0 (8.2–9.8) 7.6 (6.3–9.1) 6.2 (2.8–13.1) 3.8 (1.2–11.1) 9.7 (6.3–14.6) 6.7 (2.3–17.6) 2.8 (1–7.7) 9 (5.4–14.6) 5.8 (2.8–11.6) 8.6 (3–22.5)
Cockroach, any 4.6 (4.2–5) 4.3 (3.9–4.7) 3.4 (2–5.7) 4.4 (2.7–7.3) 7.7 (6.1–9.5) 3.1 (1.3–7.1) 2.2 (1.7–3) 2.6 (2–3.4) 4.4 (3.8–5.2) 5 (3.6–6.8) 4.6 (3.6–5.8)
German cockroach 3.7 (3.3–4) 3.3 (2.9–3.6) 2.1 (1.1–4.1) 3.6 (2.1–6.4) 5.6 (4.3–7.2) 3.1 (1.3–7.1) 2.2 (1.7–3) 2.5 (1.9–3.3) 4.4 (3.7–5.2) 5 (3.7–6.9) 4.6 (3.7–5.8)
American cockroach 2.8 (2.5–3.1) 2.3 (2–2.6) 2.4 (1.3–4.5) 3.1 (1.6–5.7) 6 (4.6–7.7) 1.7 (0.5–5.4) 2.9 (1.5–5.7) 1.7 (0.8–3.6) 0.8 (0.2–2.8) 4.1 (1.4–11.6)
Outdoor mold, any 5.7 (5.2–6.1) 6.7 (6.2–7.2) 5.9 (3.9–8.6) 5.1 (3.2–8.2) 6.2 (4.8–7.9) 3.4 (1.5–7.5) 3.1 (2.4–3.9) 5.3 (4.4–6.3) 2.3 (1.9–2.9) 4.7 (3.4–6.5) 4.8 (3.8–6)
Alternaria 2.7 (2.4–3) 2.9 (2.6–3.2) 3.6 (2.1–5.9) 3.1 (1.7–5.7) 3.2 (2.2–4.5) 0.7 (0.1–4.2) 0.7 (0.4–1.2) 3.7 (2.9–4.6) 1.2 (0.9–1.6) 3.7 (2.6–5.3) 1.5 (1–2.3)
Candida albicans 2.5 (2.1–2.9) 1.7 (1.5–2) 2 (0.9–4.3) 2.2 (0.9–4.9) 3.2 (2.1–4.6) 1.5 (0.4–6.1) 3.5 (1.6–7.5) 3.7 (1.9–6.8) 2.3 (1–4.9) 4.5 (2.1–9.4) 2.3 (1.7–3.2)
Cladosporium 1.4 (1.2–1.7) 2 (1.8–2.3) 0.7 (0.2–2.3) 1.5 (0.6–3.7) 1.5 (0.9–2.5) 2 (0.7–5.7) 0.5 (0.3–0.9) 1.3 (0.9–1.9) 0.9 (0.6–1.3) 1.8 (1–3.3) 1.5 (1–2.3)
Fusarium moniliforme 0.5 (0.4–0.7) 0.8 (0.7–1) 0.5 (0.1–1.9) 0.2 (0–2.3) 1 (0.2–4.5) 0.1 (0–0.4) 0.7 (0.4–1.1) 0.6 (0.3–1.3) 0.3 (0.1–0.8)
Mold I mixture 3.2 (2.9–3.6) 3.8 (3.5–4.2) 4.3 (2.7–6.8) 2.4 (1.1–4.8) 3.7 (2.2–6) 0.5 (0–4.3) 1.7 (0.7–4) 3.2 (1.8–5.7) 3.5 (2.4–5) 2.6 (1.3–5.4) 36.3 (33.9–38.8)
Indoor molds 3.9 (3.5–4.3) 4.2 (3.8–4.6) 4.3 (2.7–6.8) 5.1 (3.2–8.1) 7.6 (6–9.4) 1.6 (0.5–5.3) 1.6 (1.2–2.3) 2.9 (2.2–3.7) 2.3 (1.8–2.8) 2.6 (1.7–4.1) 3.7 (2.8–4.8)
Aspergillus fumigatus 1.3 (1.1–1.5) 1.9 (1.6–2.1) 1.2 (0.5–2.9) 1.3 (0.5–3.4) 1.1 (0.6–2) 1.1 (0.3–4.6) 0.6 (0.3–1) 1.1 (0.7–1.7) 1 (0.7–1.4) 1.2 (0.5–2.5) 1.1 (0.7–1.8)
Aspergillus niger 0.3 (0.2–0.5) 1.5 (1.3–1.8) 0.3 (0.1–2.2) 1.2 (0.4–3.8) 1 (0.3–3.4) 0.9 (0.1–5.5) 1.2 (0.3–4.5) 0.7 (0.2–3) 0.7 (0.2–3.5)
Mucor mucedo 0.3 (0.2–0.5) 0.3 (0.2–0.4) 0.5 (0.1–2.1) 0.7 (0.3–1.6) 0.7 (0.2–3.0) 0.7 (0.2–3.5)
Neurospora sitophilia 0.7 (0.5–0.9) 0.7 (0.5–0.8) 0.5 (0.1–2) 1.1 (0.4–3.2) 1 (0.4–2.7) 0.5 (0.1–4.2) 0.5 (0.1–2.6) 1.7 (1.2–2.3) 0.8 (0.4–1.5)
Penicillium notatum 1.6 (1.4–1.9) 0.9 (0.8–1.1) 2.1 (1–4) 1 (0.3–3) 1.9 (1.2–3) 0.5 (0.1–4.2) 0.3 (0.1–0.7) 1.1 (0.4–2.9) 1.1 (0.8–1.5) 1.1 (0.5–2.4)
Trichophyton metagrophytes 3.3 (1.3–8.1) 6.7 (4.8–9.1) 0.7 (0.4–1.3) 1.8 (1.1–3.1) 2.8 (2.1–3.8)
Mold II mixture 1.2 (1–1.5) 1.3 (0.9–1.8) 1.1 (0.4–3.1) 1.3 (0.6–3.2) 0.6 (0.1–5.8) 0.2 (0–3.5) 0.2 (0–2.6) 2.3 (1.1–4.8) 2.5 (1.2–5.3)
Animal, any 11.6 (11–12.3) 11.1 (10.5–11.7) 8.7 (6.3–11.9) 8.2 (5.6–11.7) 11.2 (9.3–13.3) 6.5 (3.6–11.4) 3.8 (3.1–4.7) 8.7 (7.6–10) 7.3 (6.4–8.2) 8.1 (6.3–10.3) 8.5 (7.2–10.1)
Cat epithelia 9.6 (9–10.2) 8.7 (8.2–9.3) 7.4 (5.2–10.5) 5.9 (3.7–9.2) 8.7 (7.1–10.7) 5.6 (2.9–10.5) 3.2 (2.5–4.1) 7 (5.9–8.2) 7.4 (6.5–8.6) 5.4 (3.8–7.7) 5.8 (4.7–7.1)
Dog epithelia 3.8 (3.4–4.2) 4.7 (4.3–5.1) 2.1 (1.1–4.1) 3 (1.6–5.6) 4.1 (3–5.6) 0.7 (0.1–4.2) 0.9 (0.6–1.4) 2.6 (2–3.3) 5.6 (4.6–6.8) 3.7 (2.4–5.7) 2.9 (2.1–3.9)
Hens epithelia 0.3 (0.2–0.4) 0.3 (0.2–0.5) 0.5 (0.1–2.3) 0.5 (0.1–2.9) 0.7 (0.1–3)
Rabbit epithelia 0.7 (0.5–0.9) 0.4 (0.3–0.6) 0.5 (0.1–3.9) 0.5 (0.1–2.8) 1.8 (1.1–3) 1.3 (0.3–5.8) 0.5 (0.1–3.3) 1.1 (0.5–2.5) 0.9 (0.5–1.5)
Tree, early blooming, any 9.7 (9.1–10.3) 9.9 (9.4–10.5) 10.6 (7.9–14) 8 (5.4–11.5) 11.3 (9.4–13.4) 5.4 (2.8–10.1) 7.3 (6.3–8.5) 18.4 (16.8–20.2) 14.8 (13.6–16.1) 4.2 (3–5.9) 5.9 (4.8–7.3)
Alder 6.4 (6–6.9) 6.5 (6–6.9) 9 (6.6–12.3) 5 (3.1–8.1) 5.7 (4.4–7.4) 4.3 (2–8.7) 4 (3.2–4.9) 9.4 (8.2–10.8) 14.5 (12.9–16.3) 2.4 (1.4–4.1) 2.5 (1.8–3.4)
Ash 1.1 (0.9–1.3) 0.9 (0.7–1.1) 1.8 (0.9–3.8) 1.4 (0.6–3.5) 1.7 (1.1–2.8) 0.6 (0.3–1) 2.3 (1.7–3) 3.2 (2.4–4.1) 1.7 (0.9–3.2) 1.2 (0.8–1.9)
Elder 1.4 (1.2–1.6) 1.2 (1–1.5) 1 (0.4–2.7) 1.7 (0.7–3.9) 4.1 (3–5.6) 1.2 (0.4–3.4) 2.4 (1.3–4.6) 6.1 (5.3–7) 1.5 (0.2–8.7) 2 (1.4–2.9)
Elm 1.6 (1.4–1.9) 1.5 (1.3–1.7) 0.8 (0.2–2.3) 0.7 (0.2–2.6) 1 (0.6–1.9) 0.2 (0–2.5) 1.3 (0.9–1.9) 1.9 (1.5–2.5) 1.3 (0.6–2.6) 0.7 (0.4–1.3)
Hazel 6.7 (6.2–7.2) 6.5 (6.1–7) 8.5 (6.2–11.7) 5.1 (3.2–8.2) 5.5 (4.2–7.2) 3.5 (1.6–7.8) 5.7 (4.8–6.8) 12.2 (10.9–13.7) 7.7 (6.8–8.6) 3.4 (2.2–5.3) 2.1 (1.5–3)
Poplar 1.6 (1.3–1.8) 1.6 (1.4–1.9) 0.8 (0.2–2.3) 1.3 (0.5–3.3) 2 (1.2–3.1) 1 (0.6–1.5) 1.7 (1.3–2.4) 5.1 (4.4–5.9) 1.4 (0.7–2.8) 1 (0.6–1.7)
Willow tree 1.4 (1.1–1.6) 1.5 (1.3–1.7) 0.2 (0–1.8) 1.1 (0.4–3.1) 1.6 (1–2.6) 0.4 (0.2–0.8) 1.5 (0.7–3.4) 1.7 (1.1–2.4) 1.1 (0.5–2.4) 0.6 (0.3–1.2)
Tree I mixture 7.6 (7.1–8.2) 7.9 (7.4–8.4) 7.6 (5–11.5) 4.7 (2.8–7.7) 5.9 (4–8.7) 4.7 (2.3–9.3) 9.3 (6.4–13.3) 7.9 (5.5–11.1) 6.1 (5.2–7) 4.3 (2.5–7.5) 2.8 (2–3.7)
Tree, mid blooming, any 11.4 (10.8–12) 11.7 (11.1–12.4) 13.3 (10.3–17) 10.2 (7.3–14) 8.1 (6.6–10.1) 5.7 (3–10.5) 6.6 (5.6–7.8) 14.5 (13–16.1) 14.9 (13.7–16.2) 15.9 (13.4–18.7) 6.1 (5–7.4)
Acasia or locust 1.3 (1.1–1.7) 0.9 (0.7–1.1) 1.1 (0.4–3.1) 0.4 (0.1–2.7) 0.2 (0–0.9) 2.5 (1.9–3.3) 0.9 (0.6–1.5) 2.5 (1.4–4.2) 1.4 (0.9–2.1)
Birch 7.7 (7.1–8.4) 7.6 (7.1–8.1) 10.7 (7.7–14.6) 4.7 (2.7–8.1) 5.7 (4.3–7.5) 3.6 (1.5–8.7) 4.9 (4.1–6) 9.2 (8–10.6) 12.8 (11.7–14) 2.2 (1.2–3.9) 2.9 (2.2–3.9)
Beech 7.1 (6.6–7.6) 7 (6.5–7.5) 8.6 (6.2–11.8) 5.9 (3.8–9.1) 4.4 (3.3–5.9) 4.6 (2.3–9.1) 4 (3.3–5) 5.4 (4.5–6.5) 12.3 (10.8–13.9) 7.7 (3.5–15.9) 2.4 (1.8–3.4)
Pine 1.4 (1.2–1.6) 1.4 (1.2–1.6) 1.6 (0.8–3.5) 1.3 (0.5–3.4) 0.4 (0.1–1) 0.7 (0.1–4.2) 1 (0.3–3.2) 2.3 (1.2–4.4) 7.1 (6.2–8.2) 2.1 (1.2–3.7) 2.2 (1.5–3.1)
Oak 7 (6.5–7.5) 6.7 (6.3–7.2) 7.2 (5–10.2) 4.8 (2.9–7.8) 5.2 (3.9–6.8) 3.3 (1.4–7.5) 4.3 (3.5–5.3) 6.7 (5.7–7.8) 9.3 (8.3–10.3) 9.4 (4.7–18) 2 (1.4–2.9)
Plane tree 1.5 (1.2–1.7) 1.5 (1.2–1.7) 1.2 (0.5–2.9) 2.2 (1–4.5) 2 (1.2–3.1) 1.7 (0.8–3.6) 1.5 (1–2.2) 1.4 (0.7–2.9)
Japanese ceda 0.4 (0.3–0.5) 0.7 (0.5–0.8) 0.7 (0.2–2.3) 0.8 (0.3–2.8) 0.3 (0.1–1) 0.7 (0.1–4.2) 0.8 (0.2–2.9) 0.5 (0.1–2.1) 5.9 (5–7.1) 12.1 (9.9–14.7) 0.2 (0–0.6)
Tree II mixture 8.7 (8.2–9.3) 8.6 (8.1–9.2) 9.3 (6.3–13.5) 5.3 (3.3–8.5) 6.4 (4.4–9.3) 4.7 (2.3–9.3) 9.4 (6.5–13.4) 8.7 (6.2–12) 5.4 (4.6–6.3) 5.1 (3–8.4) 3 (2.2–4)
Grasses, any 5 (4.6–5.5) 5.1 (4.7–5.5) 3.6 (2.1–5.9) 5.1 (3.2–8.2) 7.4 (5.9–9.2) 4.6 (2.3–9.1) 4.2 (3.4–5.1) 9 (7.8–10.3) 9.9 (8.9–11) 9.7 (7.8–12.1) 5.9 (4.8–7.2)
Velvet 2.7 (2.4–3) 2.6 (2.3–2.9) 2 (1–4) 2.7 (1.4–5.3) 2.4 (1.3–4.4) 2 (0.7–5.8) 0.3 (0–2.6) 2.3 (1.2–4.4) 1.4 (0.5–3.5) 7.7 (5.7–10.2)
Orchard 3.2 (2.9–3.6) 2.8 (2.5–3.1) 2 (1–4) 3 (1.6–5.6) 3.6 (2.6–5) 3.3 (1.4–7.4) 2.3 (1.7–3) 1.4 (1–2) 6.8 (6–7.7) 14.5 (10.1–20.5) 1.5 (1–2.3)
Rye 3.1 (2.8–3.5) 3 (2.6–3.3) 2.2 (1.2–4.3) 3.4 (1.9–6) 3.4 (2.4–4.8) 3.9 (1.8–8.2) 1.9 (1.4–2.6) 3 (2.4–3.9) 3.5 (2.9–4.3) 8.6 (6.5–11.3) 1.5 (1–2.3)
Timothy 2.7 (2.4–3.1) 2.7 (2.4–3) 2.2 (1.1–4.2) 2.8 (1.5–5.4) 3.6 (2.6–5) 2.6 (1–6.5) 1.8 (1.3–2.5) 1.9 (1.4–2.6) 3.2 (2.6–3.8) 7 (5.1–9.4) 1.5 (0.9–2.2)
Kentucky bluegrass 2.9 (2.6–3.3) 2.8 (2.5–3.1) 1.9 (0.9–3.8) 2.2 (1.1–4.6) 4.6 (3.4–6.1) 2.5 (1–6.5) 0.9 (0.3–3) 1.3 (0.5–3.1) 3.1 (2.4–4) 7.7 (5.7–10.2) 1.7 (1.2–2.5)
Meadow 2.9 (2.6–3.2) 2.7 (2.4–3) 1.6 (0.7–3.4) 3 (1.6–5.6) 3.2 (2.3–4.6) 2.5 (1–6.5) 2.2 (1.6–2.9) 1.8 (1.3–2.4) 3.6 (2.8–4.7) 6.8 (5–9.3) 1.2 (0.8–1.9)
Nettle 0.8 (0.6–1.1) 0.4 (0.3–0.6) 0.5 (0.1–2.4) 0.9 (0.2–3.2) 1.6 (0.9–2.7) 0.8 (0.1–5.4) 0.8 (0.5–1.3) 0.6 (0.3–1.1) 2.1 (1.6–2.8) 1.6 (0.8–3.1) 0.8 (0.4–1.4)
Bermuda grass 2 (1.7–2.4) 1.2 (1–1.4) 1.1 (0.4–3) 1.5 (0.5–4) 2.4 (1.5–3.7) 0.8 (0.1–5.4) 1.6 (1.1–2.3) 3.4 (2.6–4.3) 2.3 (1.8–2.9) 3.5 (2.2–5.6) 1.2 (0.7–1.9)
Grass mixture 2.9 (2.6–3.2) 2.2 (2–2.5) 1.9 (0.8–4.6) 1.6 (0.7–3.8) 1.8 (0.8–3.7) 2.6 (1–6.6) 1.1 (0.4–3.3) 1.4 (0.6–3.3) 2.4 (1.7–3.4) 8.6 (5.7–12.9) 3.2 (2.4–4.2)
Weeds, any 12.5 (11.8–13.1) 14.3 (13.7–15) 13.6 (10.5–17.3) 11.8 (8.7–15.8) 14.4 (12.3–16.7) 10.5 (6.7–16.2) 5.2 (4.3–6.2) 16 (14.4–17.6) 10.7 (9.7–11.9) 11.8 (9.7–14.3) 8.8 (7.5–10.4)
Ragweed 3.8 (3.5–4.2) 3.6 (3.2–4) 5.8 (3.9–8.6) 2.7 (1.4–5.2) 2.8 (2–4.1) 2.9 (1.2–7) 1.5 (1.1–2.1) 5 (4.1–6) 3.2 (2.4–4.1) 4.9 (3.6–6.8) 2 (1.4–2.9)
Mugwort 7.6 (7.1–8.1) 7.6 (7.1–8.1) 7.3 (5.1–10.3) 5 (3.1–8.1) 9.4 (7.7–11.5) 4.4 (2.1–8.8) 2.6 (2–3.4) 6.5 (5.5–7.6) 5.2 (4.5–6) 7.2 (5.5–9.3) 6.2 (5.1–7.6)
Hop Japanese 4.1 (3.7–4.5) 5.3 (4.9–5.7) 4.1 (2.6–6.6) 4.9 (3–7.9) 6.1 (4.7–7.8) 7.2 (4.1–12.3) 1.8 (1.3–2.5) 5.9 (4.9–7) 3.6 (3–4.3) 6.3 (4.2–9.2) 2.3 (1.6–3.2)
Dandelion 1.7 (1.5–2) 2.4 (2.1–2.7) 2.7 (1.5–4.9) 1.2 (0.4–3.2) 1.6 (0.7–3.4) 0.4 (0.2–0.8) 2.8 (2.2–3.6) 4.6 (3.8–5.6) 0.5 (0.1–3.9) 0.8 (0.5–1.4)
Chrysanthemum 5.5 (5–6.1) 7.4 (6.9–8) 5.2 (2.9–9) 7 (4.4–10.7) 6.2 (4–9.4) 7.4 (3.9–13.6) 4.3 (2.3–7.7) 6.7 (4.4–10.1) 3.9 (3.2–4.8) 4.2 (1.3–12.7)
Goldenrod 2.4 (2–2.8) 1.8 (1.6–2.1) 3.1 (1.7–5.8) 0.9 (0.2–3.4) 2.8 (1.3–5.8) 0.9 (0.1–5.5) 1.6 (0.5–5.1) 2.7 (1.3–5.5) 1.6 (1–2.5) 4.2 (1–15.3)
Plantain 1.6 (1.3–1.9) 0.8 (0.7–1) 1.1 (0.4–3.1) 2.3 (1–5) 1.6 (0.9–2.8) 3.5 (1.4–8.5) 0.5 (0.1–3.9) 1.5 (1.1–2.2) 1.4 (0.8–2.5) 1.7 (0.9–3.3) 1.2 (0.7–1.9)
Other uncommon allergens
Latex (Hevea brasiliensis)
Lepidoglyphus destructor
Acarus siro 6.1 (3.1–11.6) 25.1 (7.1–59.6) 10.2 (7.9–13.1) 7.7 (6.1–9.6) 6.8 (5.6–8.2)
Panonychus citrus 7 (4.1–11.5)
Trychophyton mentagrophytes 25.1 (7.1–59.6) 9 (6.8–11.7)
Tricepidermofiti mix
Cephalosporium 2 (0.9–4.2)
Hormodendrum 1.9 (0.8–4)
Helminthosporium 3.4 (2–5.5)
Rat epithelia 0.3 (0.2–0.4) 0.4 (0.3–0.5) 0.1 (0–0.8) 1.6 (1–2.5) 0.9 (0.4–2.2) 0.8 (0.4–1.4)
Hamster epithelia 2.9 (1.7–4.9) 0.7 (0.4–1.3)
Horse epithelia 2.6 (1.5–4.5)
Cow epithelia 0.7 (0.3–1.6) 0.4 (0.1–0.8)
Sheep's wool 0.3 (0.1–0.7)
Animal hair I 10.8 (8.1–14.3) 5 (2.7–9.1)
Animal hair II 0.4 (0.1–1.2) 1.4 (0.4–4.5)
Maple 1.9 (1.4–2.5) 2.7 (0.8–8.7) 1.9 (1.3–2.8)
Hay dust 0.9 (0.3–2.3)
Sycamore 2 (1–4.1)
Jeju Cedar 11.6 (9.2–14.6)
Spruce (Picea excelsa) 1 (0.6–1.6)
Rhizopus nigricans 2.6 (1.6–4.1) 1.5 (1.3–1.8) 2.3 (0.5–9.3) 3.8 (1.8–7.9) 0.2 (0.1–1)
Lamb's quarter 6.1 (3–12.3) 1 (0.6–1.6)
Sorrel 19 (3.3–61.8) 1.4 (0.9–2.1) 1 (0.6–1.7) 1.4 (0.9–2.1)
Iron wood 8.3 (0.9–48.1) 4.7 (3.2–6.8)
Rape 2.4 (0.7–8.4)
Cottonwood 1.6 (0.7–3.7)
Dog's taill grass 6.1 (4.2–8.7)
Vernal grass 6.6 (4.7–9.3)
Johnson grass 4.9 (3.2–7.4)
Kochia 1.4 (0.6–3.5)
Hickory 2 (0.9–4.2)
Feather 3.3 (2–5.4)
Weed mixture 9.9 (7.6–12.8)

*Sensitization rates to inhalant allergens are presented as mean (95% confidence interval).

Table 3

Common inhalant allergen panel according to the residential area

aair-9-499-i003
1st 2nd 3rd 4th 5th 6th 7th 8th 9th 10th
Overall Der p Der f Cat Birch Tetra Hazel Alder Mugwort Beech Oak
Seoul Der f Der p Cat Tetra Birch Mugwort Beech Oak Hazel Alder
Gyeonggi Der f Der p Cat Birch Mugwort Tetra Chrysan Tyro Beech Oak
Incheon Der f Der p Acarus Mugwort Cat Tyro G. cock Birch Dog Tricho
Gangwon Der p Der f Birch Alder Beech Hazel Cat Mugwort Oak Tetra
Chungbuk Der f Der p Tyro Chrysan Cat Beech Hazel Alder Mugwort Hop J
Chungnam Der f Der p Mugwort Cat Tyro Chrysan Hop J A. Cock Alder Birch
Gyeongbuk/Daegu Der f Der p Hazel Alder Birtch Tetra Cat Oak Chrysan Mugwort
Busan/Gyeongnam Der p Der f Alder Birch Beech Oak Hazel Cat Pine Orchard
Jeonbuk Der p Der f Chrysan Hop J Tetra Cat Beech Mugwort Alder Rye
Jeonnam/Gwangju Der p Der f Tyro Hazel Birch Oak Chrysan Beech Alder Cat
Jeju Der p Der f Orchard Tyro J. Cedar Oak Rye Tetra Velvet Beech

Acarus (Acarus siro), A. cock (American cockroach), Cat (Cat epithelium), Chrysan (Chrysanthemum), Def f (Dermatophagoides farina), Der P (Dermatophagoides pteronyssinus), Dog (Dog epithelium), G. Cock (German cockroach), Hop J (Hop Japanese), J. cedar (Japanese cedar), Tetra (Tetranychus urticae), Tricho (Trichophyton metagrophytes), Tyro (Tyrophagus putres).

TOOLS
Similar articles