

 PDF
PDF ePub
ePub Citation
 Print
Print


INTRODUCTION
Asthma is a heterogeneous disease with various respiratory symptoms, such as wheezing, coughing, and dyspnea, and is characterized by chronic airway inflammation and remodeling.1 Owing to its heterogeneity, asthma has been classified into several phenotypes, such as atopic or non-atopic, eosinophilic or neutrophilic, and severe or non-severe subtypes.23 These classifications have been applied in the implementation of appropriate environmental management, prediction of prognosis, and treatment strategies.345678 Recently, candidate molecular targeted therapeutics, such as lebrikizumab and mepolizumab, have been used in cases with specific phenotypes, such as elevated immunoglobulin E (IgE) levels910 and blood or sputum eosinophilia.111213 Further subgroup analyses of asthmatics have also been initiated using newly adopted clinical, laboratory, and molecular markers.2141516
Cluster analysis involves grouping a set of objects together that are more similar to each other than to objects in other groups.17 For the first time, Haldar et al.18 demonstrated differences in clinical responses to treatments among clusters. In addition, in the Severe Asthma Research Program cohort, 2 severe asthma phenotype clusters were identified: 1) long disease duration with childhood onset and atopic disease; and 2) female predominance with mainly later-onset disease and less atopy.19 Further cluster analyses using additional parameters such as inflammatory biomarkers and obesity in asthmatics have also been reported.2021
Previously, we found differences in temporal changes in forced expiratory volume in 1 second (FEV1) over a 12-month follow-up among clusters of asthmatics.22 An additional longitudinal analysis of the populations in this cluster study demonstrated consistent differences in asthma control test scores and systemic corticosteroid usage among the clusters.23 Even the patients with refractory asthma could be classified into 4 subtypes.24 However, few cluster analyses have evaluated the risk of exacerbation in terms of long-term prognosis. In the present study, we attempted to determine whether clusters reflect the prognosis of risk of asthma exacerbation over a follow-up period of at least 1 year.
MATERIALS AND METHODS
Selection of the study subjects
Clinical and demographic data from 1,843 asthmatics registered in an asthma cohort in Korea22 were analyzed retrospectively. These asthmatics were recruited from 3 general hospitals in different areas. Asthma was diagnosed by physicians based on the Global Initiative for Asthma guidelines.1 Among the 1,843 subjects, 628 who were regularly followed-up for over 1 year were included in the analysis, after excluding current smokers and ex-smokers of 10 pack-year or more. The protocol was approved by the ethics committee of Soonchunhyang University Bucheon Hospital (SCHBC_2014_07_028).
At the baseline visit, demographic information was collected, such as age at enrollment, sex, body mass index (BMI), age at asthma onset, asthma duration, and smoking amount. All patients underwent a standardized assessment, which included peripheral blood total and differential cell counts, serum total IgE levels, chest radiography, sputum cell analysis and skin prick tests with 24 common inhalant allergens (Bencard Co., Brentford, UK). Baseline FEV1, forced vital capacity (FVC), short acting bronchodilator-induced percent change in FEV1 (ΔFEV1), and provocation concentration of methacholine inducing a 20% decrease in FEV1 (PC20) methacholine levels (mg/mL) were measured. The total amount of inhaled steroids was calculated from electronic medical records and expressed as the equivalent dosage of fluticasone propionate per day. Exacerbation of asthma was defined as episodes of increased dyspnea, wheezing, or coughing with a decrease in the personal best FEV1 by more than 20%.25 Short-term treatment with systemic corticosteroids was administered when the subjects experienced moderate exacerbation; the amount administered is expressed as the equivalent dosage of prednisone per year. Frequent exacerbation was defined when more than 2 episodes occurred. Sputum was induced using isotonic saline containing a short-acting bronchodilator and was processed within 2 hours of collection as described previously.4 Slides were prepared by cytocentrifugation, and 500 cells were counted on each slide after staining with Diff-Quick (American Scientific Products, Chicago, IL, USA).
Cluster analysis
Uniform cluster analysis was applied to each population using a 2-tiered approach.26 In the first step, hierarchical cluster analysis was performed using Ward's method to generate a dendrogram for estimation of the number of likely clusters within the population. Cluster boundaries were defined by large differences between successive fusion levels.27 K-means cluster analysis was then performed to select the most representative model. The K-means algorithm was repeated 10 times in each dataset at random starting points to ensure repeatability and stability within each model using SPSS version 18 (IBM Corp., Chicago, IL, USA). The variables used for cluster modeling were selected based on their contribution to characterization of the asthma phenotype. All measurements were standardized using z scores for continuous variables and 0 or 1 for categorical variables. Initially, we selected 12 variables (age at enrollment, sex, BMI, age at asthma onset, asthma duration, smoking amount, atopy, peripheral blood eosinophils (%), total IgE level, FEV1, ΔFEV1, and PC20) that have been identified as determinants of asthma.2829
Statistical analysis
SPSS version 18 (IBM Corp.) was used for the principal components analysis (PCA), clustering, and discriminant analyses. To compare clinical parameters among clusters, analysis of variance, Kruskal-Wallis test, and χ2 test were applied to parametric continuous, non-parametric continuous, and categorical variables, respectively. In addition, the times of exacerbation appearance were compared among the clusters using Kaplan-Meier analysis and the log-rank test.
RESULTS
Clinical characteristics of the study population
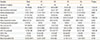
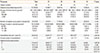
A total of 628 subjects were regularly followed-up for more than 1 year. Among them, 109 subjects with missing PC20 data and 260 subjects who presented with acute exacerbation at the initial visit were excluded; the remaining 259 subjects were analyzed for clustering. Clinical and demographic characteristics are summarized in Table 1.
Hierarchical cluster analysis
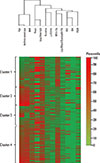
To estimate the number of likely clusters, hierarchical analysis using Ward's method was performed to generate dendrograms using 12 variables (Supplementary Figs. 1 and 2) and showed that the subjects could be classified into 4 clusters. The hierarchical analysis was repeated using the 12 variables, revealing that 4 clusters are likely optimal for discriminating the subjects; thus, subsequent K-means cluster analysis was performed using the 4 clusters. The heap map and hierarchical clustering of these 12 variables are presented in Fig. 1.
Characteristics of the 4 clusters
Age, age at asthma onset, BMI, atopic status, FEV1, ΔFEV1, and PC20 were markedly different among the 4 clusters (Table 1). Cluster 1 (C1) comprised the youngest patient group with early-onset asthma. Individuals in this cluster had well-preserved FEV1 with a high rate of positive skin prick tests. Thus, C1 was defined as early-onset atopic asthma with preserved lung function. Cluster 2 (C2) comprised the oldest patient group with an age at onset of 56 years. These individuals had the lowest rate of positive skin prick tests and decreased FEV1. Thus, C2 was defined as late-onset non-atopic asthma with impaired lung function. Cluster 3 (C3) showed the lowest FEV1 and PC20 with the highest rate of positive skin prick tests, while cluster 4 (C4) comprised older patients with the highest FEV1 and a lower rate of atopy. Thus, C3 was defined as early-onset atopic asthma with severely impaired lung function and C4 as late-onset non-atopic asthma with well-preserved lung function. The age at asthma onset was different among age groups; early-onset asthma was found in the younger groups (C1 and C3), while late-onset asthma was found in the older groups (C2 and C4). Atopic status was distinguishable between age groups, showing higher rates in the early-onset groups (C1 and C3) than in the late-onset groups (C2 and C4).
We also performed a post-hoc analysis (Table 1) of variables with P values <0.05. All pairs of clusters differed significantly in terms of age and FEV1. C1 represented the youngest group and C2 the oldest. C3 showed the worst FEV1 while C4 showed the best. In early-onset asthmatics (C1 and C3), the distinguishable parameters were FEV1 and PC20, similar variables to the late-onset groups (C2 and C4), FEV1, and ΔFEV1.
Use of corticosteroids and exacerbation frequency among the clusters
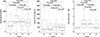
The dosages of inhaled steroids, number of subjects experiencing exacerbation, and the annual number of exacerbations showed inter-individual differences (Table 2). More than 80% of the subjects in each cluster used inhaled steroid. The dosage of inhaled steroid was lower in C1 than other clusters (Fig. 2A), while the proportion of subjects using high-dose inhaled steroid was not significantly different. There was no significant difference in the proportion or dosage of systemic steroid among clusters (Fig. 2B).
The exacerbation rate over 1 year was significantly higher in C2 and C3 than in C1 and C4 (Table 2). The difference was still apparent in a post-hoc analysis. Furthermore, the annual number of exacerbations was higher in C2 and C3 than in C1 and C4 (Fig. 2C). The proportion of subjects with frequent exacerbations (more than 2 times per year) was higher in C2 and C3 than in the other clusters (Table 2). Thus, we defined C2 and C3 as the exacerbation-prone clusters.
Additionally, correlations between the annual rate of exacerbation and the dosage of inhaled or systemic corticosteroids used were analyzed. The annual rate of exacerbation was significantly correlated with the dosage of inhaled corticosteroids in all study subjects (Supplementary Fig. 3).
Comparison of exacerbation risk
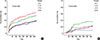
To compare the exacerbation risk among the 4 clusters, Kaplan-Meier analysis, the log-rank test, and Cox regression analyses were applied. The cumulative rate of the first and second attack was different among the 4 clusters in the Kaplan-Meier analysis (Fig. 3). C3 showed a significantly increased risk of the first exacerbation compared with C1 (odds ratio [OR], 17.569; P<0.001) and C4 (OR, 12.664; P<0.001). C3 also showed an increased risk of a second exacerbation compared with C1 and C4. No significant differences in the first and second exacerbation were observed between C2 and C3 (Supplementary Table 1).
Next, Cox regression analysis was performed to compare the risk of exacerbation among clusters after adjusting for other clinical parameters. To identify multicollinearity, correlation analysis was performed using 12 variables (Supplementary Table 2). The result of the Cox regression analysis using these 12 variables and cluster groups are presented in Supplementary Table 3. Asthma duration and FEV1 were significantly associated with exacerbation, while no significant associations were found in any of the clusters.
To reveal the differences in inflammatory patterns among the clusters, total and differential cell counts in peripheral blood (n=259) and sputum (n=86) were compared. There were no differences in the cellular fraction or total cell counts among the clusters, except for white blood cell and neutrophil counts in peripheral blood (Supplementary Table 4).
DISCUSSION
In the present study, we performed a longitudinal analysis of the clinical outcomes of asthma subphenotypes defined by cluster analysis. We included only patients who were followed-up for longer than 1 year to analyze the annual exacerbation rate and exacerbation risk within 1 year. Four clusters among patients with adult asthma were identified in this study. Among them, C2 and C3 comprised patients with lower lung function and higher exacerbation risk. We defined these clusters as exacerbation-prone asthma. The C2 and C3 clusters showed contrasting clinical characteristics; C2 showed late-onset (age 50s) and non-atopic asthma, while C3 showed early-onset (age 20s) and atopic asthma. To the best of our knowledge, this study is the first to analyze the exacerbation risk of asthma clusters using 1-year follow-up data.
The clinical characteristics of the exacerbation-prone clusters in our study differed somewhat from those in other studies. First, obesity and the inflammatory patterns in the airway may not have been factors that aggravated asthma in our clusters. A recent cohort study by Amelink et al.21 surveying 200 patients with adult-onset asthma showed the following exacerbation-prone clusters: 1) obese females with frequent symptoms, high healthcare utilization, and low sputum eosinophil counts; and 2) a severe eosinophilic inflammation-predominant group with persistent airflow limitation. Obese asthma patients showed a different expression profile of clinical and inflammatory biomarkers and reduced glucocorticoid receptor expression, which may mediate glucocorticoid insensitivity.20 However, the exacerbation-prone subjects in our study did not have a higher BMI or eosinophilic inflammation, which is in contrast to studies conducted in Caucasian populations.18192021 We decided that BMI was not a significant parameter to define asthma clusters, because Asian asthmatics usually have a normal BMI range compared with Western populations. Few Asian asthmatics have BMIs over 30 kg/m2, and all of our subjects were in the range of 21.9–26.2 kg/m2. Second, the asthma duration was not significantly different among clusters. Instead, there were 2 age groups among the 4 clusters: older subjects with an age at asthma onset of over 50 years in C2 and C4 and younger subjects with an age at asthma onset in their 20s in C1 and C3. In other studies, asthmatics were in their late 30s to late 40s and had a long asthma duration of approximately 30 years in Moore et al.'s study,19 or they were in their mid- to late 40s and had early-onset asthma with a duration of approximately 25 years in the study by Haldar et al.'s study.18 We believe these differences originated from the relatively short asthma duration (4.7–10.0 years) of our cohort.
When comparing the present results with those of a previous cluster analysis performed in South Korea,2224 there are apparent differences in the demographic parameters of study populations and variables used for clustering. In the present study, we excluded current smokers and ex-smokers of 10 pack-year or more and patients presented with acute exacerbation at the initial visit while the previous study did not. The main result of that study22 is the presence of 4 asthma subtypes: 1) smoking asthma; 2) severe obstructive asthma; 3) early-onset atopic asthma; and 4) late-onset mild asthma using 6 variables (FEV1, BMI, age at onset, atopic status, smoking history, and history of hospital use due to exacerbation) in 724 asthmatics of the Cohort for Reality and Evolution of Adult Asthma in Korea (COREA) and 1,843 asthmatics of Soonchunhyang University Asthma Genome Research Centre (SCH) cohorts. However, the present study analyzed a complete set of 12 variables and exacerbation frequency with asthma control medications' usage for 1 year follow-up period. As the result, only 259 patients are included in the present analysis among the 1,843 subjects of SCH cohort. In another cluster analysis,24 86 refractory asthma patients were selected from SCH cohort on the basis of the American Thoracic Society's criteria.30 This study used 5 variables (age at the onset of asthma, BMI, FEV1/FVC ratio, amount of cigarette smoking, and PC20) in the cluster analysis and mean smoking amount was 8.4 pack-year, while the present study excluded current smokers and ex-smokers of more than 10 pack-year. In addition, only 39 subjects were included in both 2 studies. Accordingly, the present study seems to present new cluster, C2, which the previous studies of ours could not, on the basis of exacerbation frequency and asthma medication usages. C2 comprised the oldest patient group with an age at onset of 56 years. These individuals had the lowest rate of positive skin prick tests and decreased FEV1. Thus, C2 was defined as late-onset non-atopic asthma with impaired lung function.
Our study has several limitations caused by the difficulty in collecting clear follow-up data in practice. First, we did not record adherence at clinic visits, making it difficult to assess whether the study subjects visited a hospital for every occurrence of exacerbation. Second, we did not check the remaining dosage of inhaled steroids after use. Because some patients did not use steroids even when they had been prescribed them, the dosages of inhaled steroids calculated in our study might be overestimates. Third, the subjects were recruited from only 3 hospitals (Seoul, Bucheon, and Cheonan hospital), which may have contributed to a selection bias. Fourth, there is a chance that mild asthma was excluded, because only patients followed-up over 1 year were included in the analysis. Fifth, the proportion of female patients was higher than that in other cohorts, so we could not analyze the effects of sex on asthma exacerbation. However, we believe that our study was valuable in terms of the racial differences and the data completeness including the exact exacerbation-free duration in all subjects. We showed different clinical characteristics among exacerbation-prone asthmatics in an Asian population and analyzed complete exacerbation data from all subjects included in the cluster analysis. Further studies should be performed to define the parameters or pathogeneses that contributed to the asthma exacerbation observed in patients in C2 and C3, in addition to FEV1.
In conclusion, 2 different phenotypes of exacerbation-prone asthma were identified in Korean asthmatics using cluster analysis, revealing somewhat different clinical characteristics from those of asthmatics in Western countries. Both of the phenotypes showed impaired lung function with different ages at asthma onset and atopic statuses, while no significant differences in BMI or eosinophilic inflammation were identified.
 XML Download