

 PDF
PDF ePub
ePub Citation
 Print
Print


INTRODUCTION
In high ventilation sports defined as “sustained periods of high aerobic and ventilatory demand,”1 the prevalence of airway hyperresponsiveness (AHR), exercise-induced bronchoconstriction (EIB), and exercise-induced asthma (EIA) exceeds recreationally active populations.2 Airway dysfunction is also the most common reported symptom in summer sport athletes (8%), and prevalent in high ventilation sports of triathlon (25%), cycling, and swimming (17%).2 However, the majority of cases identified as AHR are EIB-related,3 implicating exercise in the etiology of AHR.4
Bronchiole challenge tests used to determine EIB involve eucapnic voluntary hyperpnea (EVH) developed by5 and evaluated against other provocation tests.6 As described by Rundell et al.3 and Anderson et al.,7 the EVH test replicates the heavy ventilation of a maximal exercise test6 or a race pace field test.8 The International Olympic Committee (IOC)-Medical Commission has designated the EVH test as the ‘gold standard’ for EIB identification in athletes39 and has been shown to be an effective airway challenge in well trained,1011 elite athletes12 as well as high ventilation sports.1 However, questions regarding the best method as well as sensitivity and specificity to determine EIB are still ongoing.3
Regarding sensitivity, the initial work found a decrease in FEV1 of 5% to 10% to be suggestive of AHR and a decrease of >10% FEV1 to be diagnostic.6 Currently, a ≥10% FEV1 decrease at 2 consecutive time points post-EVH is the most accepted threshold for EIB determination. However, the reliability of the post-test FEV1 to determine EIB has been questioned because of the wide Limits Of Agreement (LOA) associated with EVH in elite13 and recreational swimmers.10 Specifically upon follow-up testing, the number of EIB-positive individuals can change.10 However, despite the performance in the EVH test (i.e. the ability for subjects or patients to meet their target FEV1 X 30 breaths per minute for 6 minutes) which may affect the magnitude of the post-test FEV1 change (and the potential diagnosis of EIB), to our knowledge no research has described the minute by minute in-test performance. Furthermore, given the inherent biological variability associated with post-test spirometry,10 the short-term reproducibility of the in-test EVH performance has not been well established.
Thus, the primary purpose of this study was to evaluate the short-term in-test reproducibility of the EVH test as well as pre-and post-EVH spirometry in high ventilation athletes. We hypothesized that all participants, who were swimmers, would achieve the recommended EVH protocol and that their test-retest reproducibility would not be different. We also hypothesized that short-term reproducibility would not be clinically or statistically different for pre- and post-test spirometry.
To provide an additional insight into the efficacy of the standard EVH protocol, we also investigated the actual inspired CO2 concentration required to maintain eucapnic conditions by manually titrating CO2 into the inspirate. This modification is described in detail in the methods and results of this modification considered in the discussion.
MATERIALS AND METHODS
Study Population
Eleven varsity swimmers (5 males) with ≥10 years of competitive swimming experience were recruited. All swimmers came from full-time high-performance clubs prior to attending university. All were currently training and free of any diagnosed illness (flu, fever), respiratory infection or musculoskeletal injury which prohibited them from their normal training program. One swimmer used a short-acting beta-agonist occasionally when needed. No other swimmers had a history of asthma or respiratory symptoms associated with exercise. Their training program for 3 months prior to testing included 7-9 swim sessions, 2 dryland sessions, and 1 day off per week (Sunday). All participants had normal baseline FEV1 and FVC values for their age, height, and gender.
Experimental design
Participants were assessed twice 24 hours apart at the same time of day. As per previous recommendations,7 on each day participants had not completed any training or strenuous exercise each day prior to their arrival at the laboratory. A cough/atopy questionnaire was completed on the first day prior to spirometry and EVH testing. Spirometry was performed before and after the EVH as described below. Participants were asked to refrain from medications that might influence lung function (24 hours for short-acting β2-agonists and 72 hours for inhaled corticosteroids). The study received Institutional Research Ethics Board approval, and all participants provided informed consent for all tests and procedures prior to starting the study.
Bronchial provocation test
A modified version of the EVH test previously described was performed.57 Participants breathed at a target rate of 30 breaths/min (metronome) and tidal volume equal to FEV1 (visual feedback from a digital chart recorder [LabChart, ADInstruments, Colorado Springs, USA] which approximates 85% Maximal Voluntary Ventilation (MVV) for 6 minutes. Previously published EVH protocols suggest that an inspired dry gas mixture of 21% O2, 5% CO2, and balance N2 be used to avoid hypocapnia;7 however, to understand whether 5% CO2 is the best FICO2 to maintain eucapnia the following modification was made: participants breathed a gas mixture of 21% FiO2 (balance N2) from a 200-L reservoir with FICO2 manually titrated within the inspiratory circuit by a trained researcher targeting breath-by-breath PetCO2 to maintain eucapnia.
Pulmonary function
Participants completed baseline spirometry assessments of FEV1 and FVC to determine lung function according to “ATS/ERS Task Force: Standardisation of Lung Function Testing guidelines.14
Post-EVH test spirometry was completed as follows. FEV1 was measured in duplicate within 45 seconds (and is referred to as “post”) as well as 5, 10, and 20 minutes post-test. If FEV1 measures at a given time point differed by ≥5%, an additional FEV1 maneuver was performed.14 A fall of 10% in FEV1 observed at two consecutive time points within 20 minutes post-test9 was considered a positive indication of EIB. The severity of EIB was classified as normal (0 to <10%), mild (≥10 to <25%), moderate (≥25 to <50%) or severe (≥50%) according to the magnitude of reduction in FEV1.3 The specificity for the diagnosis of asthma is 100% when a FEV1 fall of 15% or greater is found in athletes.15
Questionnaire
Two questions from the European Community Respiratory Health Survey (ECRHS) were used to evaluate common cough triggers, including exercise (during, within 1 hour post exercise and between 2 and 8 hours post exercise), time of day (morning and night), and common allergens. The 2 questions from the ECRHS have previously been used to determine cough sensitivity to exercise and environmental allergens in elite summer and winter sport athletes.16
Statistical analysis
Descriptive statistics (means and standard deviations) were calculated for FEV1, FVC, FEV1/FVC, questionnaire scores, and test performance indicators (e.g. ventilatory rate, depth, and total ventilation) on each day. Paired t tests were used to compare FEV1, FVC, FEV1/FVC, questionnaire scores, and test performance indicators between days. Intra-class correlation coefficients model 2,1 were estimated to quantify test-retest reliability for a single measurement of EVH with the corresponding 95% confidence intervals.17 ICC exceeding 0.70 were deemed sufficient to use in research and those exceeding 0.90 adequate for use in individuals.18 All statistical analysis were performed using SPSS version 21. P values less than 0.05 were considered significant.
RESULTS
Participant descriptives and prevalence of EIB
Male swimmers were 20.2±0.8 years of age, 185.4±7.4 cm in height, and weighed 79.3±7.8 kg. Female swimmers were 20.2±1.2 years of age, 169.1±4.2 cm in height, and weighed 64.3±4.5 kg. One male swimmer used a short-acting β2-agonist as prescribed by his physician when required. The prevalence of cough based on ECRHS questionnaire indicated that 4/11 swimmers coughed during exercise; 4/11 coughed within 1 hour post exercise. The prevalence of cough due to exposure to environmental allergens was 4/11 for tobacco smoke, 4/11 for strong odors, 7/11 for dust, 2/11 for domestic animals, 3/11 for tree pollen, 2/11 for grass pollen, and 1/11 for ragweed. Respiratory tract infections were associated with cough in 7/11 swimmers and 3/11 reported other causes of cough, including cold exposure and the pool environment. Chi square analysis revealed a significant difference between EIB-positive and -negative participants (cough due to domestic animals was greater in EIB-positive participants; P=0.039).
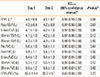
Four swimmers were positive for bronchoconstriction (>10% fall in FEV1) on day 1 with the greatest reduction observed at 5 minutes post EVH test for each swimmer that was positive. The swimmers who were positive for EIB on day 1 all had smaller reductions in post-test FEV1 on day 2 (range, 10.6% to 1.9% less on day 2), and this smaller FEV1 resulted in 1 swimmer not being EIB-positive on day 2 (day 1 FEV1=-14.0% to -6.9% on day 2). Pre- and post-test measures of FEV1, FVC, and FEV1/FVC are reported in Table 1.
EVH in-test performance and test-retest performance reproducibility
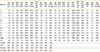
Test performance indicators for days 1 and 2 are reported in Table 2. Respiratory rate did not differ between days (29.5±0.5 vs 29.5±0.6 breaths/min), and participants achieved similar Target FEV1 volume expressed in % on days 1 (85.2±8.5%) and 2 (87.1%±8.9%) (NS; Table 2). There was a wide range of target FEV1 achieved on both days (68.2% to 106.6%) which reduced total volume of air ventilated over the test (82.5%±8.2% and 84.3%±8.5%, days 1 and 2 respectively) with a large range between participants on each day (76.0% to 99.6% for day 1; 67.2% to 102.4% for day 2) (Table 2).
End Tidal CO2 was 38.1±5.8 mmHg and 38.3±5.7 mmHg for days 1 and 2, respectively. These End Tidal CO2 values were achieved with averages FICO2 of 2.5%±0.5 and 2.5±0.6% on days 1 and 2, respectively. Table 2 provides the individual responses for inspired CO2 concentrations and the subsequent End Tidal CO2 values expressed both as ETCO2 (%) and ETCO2 (mmHg).
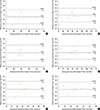
Fig. 1 provides an analysis of the agreement between days 1 and 2 for each minute of the EVH test using Bland Altman plots. The measure “% of Target FEV1” was used in the Bland Altman analysis because it provides a normalized score that accounts for anthropometric differences in participants. In the interest of brevity, this measure was chosen as a representative measure of performance between days. For each minute, the limits of agreement (LOA) were wide (see Panels A-F, Fig. 1) and no pattern of decreasing or increasing LOA over the test is evident (see Fig. 1). Fig. 1 also provides the distribution of average %Target FEV1 (combined days 1 and 2) for each participant for each minute of the EVH test. The Bland Altman indicates greater dispersion of mean %Target FEV1 in minute 6 compared to the middle minutes (3 and 4).
Spirometry and test-retest spirometry reproducibility
Pre-test FVC did not differ significantly between days. However, pre-test FEV1 was decreased on day 2 (4.5±0.7 L) vs day 1 (4.6±0.8, P=0.04; -2.3%±2.9%, range -6.8% to +3.2% on day 2). Nonetheless, test-retest reliability was excellent for all pre- and post-test FEV1 and FVC variables with ICCs exceeding 0.90 (Table 1). Point estimates for the ICC for measurements obtained 20 min post-test presented lower reliability than other post-test measurements (Table 1). No post-test measure of FEV1 or FVC differed significantly between days (Table 1). FEV1/FVC (%) ICC was poor (0.43), with a wide range (0.0 to 0.8, Table 1).
DISCUSSION
EVH test performance
The EVH test has been shown to be an efficacious bronchoprovocation test for screening and diagnosis of AHR in high ventilation varsity athletes1 as well as elite swimmers.12 Since the original publications regarding EVH, the description of the protocol has remained largely the same, and the majority of research evaluating the efficacy of the EVH test has focused on sensitivity/specificity and reliability of pre- and post-test spirometry. Practically, an air mixture of 5% CO2, which was initially developed by Yaeger et al.,5 as a standardized means of bronchial provocation and described in detail by Anderson et al.,7 has been shown to provide adequate ventilatory drive and prevention of hypocapnia.19 This can be inferred by the fact that no study using this protocol has reported any pre-syncope symptoms or inability for participants to complete the test. However, it has been suggested that operator controlled introduction of CO2, as we have done here, may optimize performance.7 In fact, the average operator controlled FICO2 was 2.5% on both days which may decrease the chance of hypercapnia which is a known bronchodilator.2021 Although a recent investigation has shown with a fixed 5% FICO2 from an air reservoir (21% O2, 5% CO2, and balance N2) resulted in PetCO2 of 39 mm Hg in both normal and EIB-positive physically active males.22
More importantly, this study indicates that the required FICO2 is variable between individuals within each test day (range on both days: 3.3% to 1.8%) and variable within each participant between days (inter-day variability within each participant ranged from 0% to 0.9%). The suboptimal test-retest ICC of 0.65 for FICO2 demonstrates how manual control of FICO2 may improve the individualization of the test to best maintain eucapnic conditions in each test.7 We also found a significant relationship between FICO2 and End Tidal CO2 (day 1: r=0. 70; day 2: r=0.86; P<0.05), but no other significant relationship between FICO2 on either day and other ventilatory measures. This suggests that other factors beyond optimal FICO2 required by each participant to maintain adequate PaCO2 influence EVH in-test performance.
In this study, only 1 participant achieved the EVH protocol, with an overall low group average on each day and wide variability of individual performance on each day as shown in Table 2. This was unexpected given that swimmers are high ventilation athletes used to hard maximal ventilation efforts,4 which is in keeping with others who found 82% to 88% of target MVV.22 It could be hypothesized that respiratory muscle fatigue may have influenced the performance during the EVH test; however, the swimmers were tested after 4 months of regular training and had had many workouts and competitions which met the ventilation requirements of the EVH test. The swimmers had no problem maintaining breath frequency and could see whether they were hitting their target FEV1 per breath via visual feedback. The swimmers studied by Stadelmann, Stensrud, and Carlsen in 201113 (with comparable training and demographic backgrounds) also had a wide range of performance relative to their target ventilations, with a mean greater than 100% of target (mean of target, 106.9%±13.9%; range, 81%-131%) for the EVH test. Thus, in elite swimmers the standard EVH protocol is a challenging bronchoprovocation protocol and only a small percentage of swimmers will achieve the target FEV1×30 breaths/min target. Moreover, this inability to achieve target FEV1 or minute ventilation results in a reduced total ventilation over the 6-minute period (139 L less than target on day 1 and 125 L less on day 2) which may influence the subsequent sensitivity of the test to diagnose EIB. In addition, the difficulty of the protocol likely affects the reproducibility of measurements within the test as we observed that Target FEV1 expressed in % of Target FEV1 is associated with wide LOA's for each minute of the EVH test (Fig. 1).
Diagnostic stability of EVH test
The main aim of the EVH test is to elicit bronchoprovocation in order to determine the degree of AHR,23 and the sensitivity of the EVH to diagnose AHR has been demonstrated to be good compared to other provocation methods.624 The importance of reproducibility had been raised in a recent review of EIB diagnosis in recreationally active adults,3 and short-and long-term reproducibility of the EVH test in high ventilation athletes have not been fully established. Specifically, in instances of borderline tests where a post-test fall of ≥10% FEV1 may indicate positivity for EIB, further testing should be performed to confirm the diagnosis of EIB.
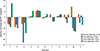
In those that have examined reproducibility of the EVH test for the diagnosis of AHR, the evidence is mixed.10132223 Initial determination of reproducibility of pre- and post-test FEV1, FVC, and FEV1/FVC was deemed appropriate based on no statistical difference between spirometry on 2 EVH tests spaced within a 6-week period in individuals all with AHR;23 however, no reliability estimates were provided. In athletes, Stadelmann et al.13 found a strong correlation between EVH tests with only 1 outlier for a Bland Altman LOA of ±6% when examining maximal reduction in post-test FEV1. Most recently, however, Price et al.10 cautioned that the LOA which were ±10% in their study limits the sensitivity of any EVH test. Consistent with Agryos et al.23 we found no statistical difference in post-test spirometry between tests though the significant difference in pre-test FEV1 does illuminate the influence a previous EVH test might have on baseline spirometry in follow-up testing. In our study, 9/11 swimmers had a lower pre-test FEV1 on day 2 (-330 to -33 mL). However, post-test spirometry test-retest reliability based on ICC estimates was good, for there was variability at each of the post-test time points (range=18%, 29%, 18%, and 27% for 5, 10, and 20 min, respectively; see Fig. 2 for individual results) and no distinct directional change was found (i.e. some participants increased, decreased or had a mixture of increased/decreased post-test FEV1 between days 1 and 2).
In our study, 1 participant had a smaller maximal fall in FEV1 post-test which moved their results from positive for EIB on day 1 (-14%) to normal (-7%) on day 2. This change from 4 swimmers as positive on day 1 (36%) to 3 swimmers on day 2 (27%) highlights the importance of reproducibility on diagnostic accuracy for EIB in athletes and was more consistent in diagnosing EIB than10 where 15 athletes were diagnosed with EIB on day 1 compared to 7 EIB positive athletes on test 2 over 2 weeks later. In addition, the 3 swimmers in our study who all had a post-test FEV1 fall of ≥20% remained positive in both tests, indicating that from a diagnostic standpoint the reliable threshold for reproducibility of EIB in athletes may be 20% or greater. This finding is in accordance with10 whom found that the 4 recreational athletes (out of a sample of 32 athletes) with a post-test fall in FEV1 of greater than 20% were also positive on both visits. Future studies are needed to confirm these findings regarding diagnostic threshold as well as utility of number of EVH tests to confirm EIB-positive diagnosis.
Self-report respiratory symptoms
The prevalence of cough in swimmers from the present study was similar to that from others13 who have investigated the respiratory and cough symptoms in swimmers.1325 However, we also found that cough and cough triggers (exercise, environment, allergens) were not significantly greater for those whom were EIB positive on either day (except domestic animals). Recently, others have examined the reliability of cough questionnaires26 and like these results found good reliability though further research is required to find the best way to evaluate cough in clinical and at-risk populations such as swimmers.27 Thus, as with others, this study supports the accumulated evidence that an objective diagnostic bronchial provocation test is most important in diagnosing AHR (then respiratory symptoms) and that although cough is prevalent in swimmers and other high ventilation athletes, the connection between cough and AHR is negligible.
Short term reproducibility approach
Our aim in this study was to determine short-term reproducibility because the reproducibility studies that have previously been completed have had days to weeks separating EVH tests, whereas we aimed to look at 24 hours short term reproducibility of the EVH test. This approach addressed a deficit in the literature and replicates the race/meet schedule that many high ventilation athletes face in their sporting careers (swimmers swimming consecutive days at a meet, Nordic skiers racing on a Saturday/Sunday; soccer players playing a weekend tournament). This approach also controlled the other factors that might affect long-term reproducibility studies, including exposure to allergens, illness, physical activity, and environmental factors such as temperature and humidity. We also attempted to control biological variability by having each swimmer come on the same day and all testing was completed on the same 2 days. The days that were chosen to test swimmers were at the conclusion of the fall training block where all swimmers had had a standard 60 hours without training or competing before arriving for their scheduled time on test day 1.
Perspective
The reproducibility of the EVH to diagnose EIB in athletes has been questioned because previous research has shown that follow-up tests do not provide the same post-test FEV1 values. However, since the follow-up test in previous studies was not short-term, we aimed to examine whether day 2 results would be the same as the previous days results. While post-test FEV1 reliability was good, this research also illuminates that reproducibility of the in-test EVH performance is associated with wide LOA's which may introduce variability in the degree of post-test FEV1 fall. How this finding implicates diagnosis of EIB in athlete's remains to be explored further, but these results would indicate: 1) that a positive diagnosis for EIB should incorporate 2 tests with a fall of ≥20% in FEV1; 2) that the recommended protocol of FEV1×30 breaths/min may be difficult to achieve in certain “high ventilation” populations which contributes to greater variability in performance within a test and between tests; 3) and that an operator-controlled induction of FICO2 may improve the eucapnic condition and enhance test performance in high ventilation athletes. These results also highlight that different intervals of time between tests should continue to be evaluated to determine any effect the first EVH test may have on subsequent pre-test spirometry, in-test performance, and post-test spirometry.
 XML Download