

 PDF
PDF ePub
ePub Citation
 Print
Print


INTRODUCTION
Allergic diseases, including atopic dermatitis, asthma, and allergic rhinitis, are prevalent in South Korea, affecting almost 9 million people of all ages, with total treatment expenses of approximately 600 million USD per year.1 These are multifactorial diseases caused by a variety of genetic and environmental factors.2 Multiple studies have investigated associations between allergic diseases, mainly asthma and atopic dermatitis, and various environmental and behavioral risk factors, such as mold exposure, indoor chlorinated swimming pools, indoor smoking, and frequency of indoor ventilation and cleaning.345 In particular, a rise in allergic disease in many countries has been attributed to increased exposure to air pollutants.67 Numerous studies around the world have demonstrated association between air pollutants such as NO2, SO2, and O3, as well as PM10, and the symptoms of allergic diseases.68910111213
Among ambient air pollutants, PM10 has drawn attention for a potential association with several types of allergic diseases, such as asthma, atopic dermatitis, and allergic rhinitis. While the number of studies examining the association between outdoor air pollutants, including PM10, and atopic dermatitis is limited,14 a clinical study found that exposure to PM10 was associated with atopic dermatitis.15 Regarding asthma and allergic rhinitis, epidemiological study results are mixed. PM10 is likely to contribute to exacerbating symptoms of asthma,16 but it is not clear whether PM10 increases the probability of inducing asthma.17 It is also reported that the effect of PM10 was inconsistent in a number of different regression analyses.18 As for allergic rhinitis, a number of studies indicated a positive relationship between the disease and exposure to PM10.131920 Some studies, however, reported no significant association.2122 The role of PM10 levels in the development of allergic diseases, particularly asthma and allergic rhinitis, is controversial.
While clinical studies have investigated the relationship between PM10 and allergic diseases based on the symptoms of selected study participants,151922 epidemiological studies have examined this association employing observed data, such as patient records and survey data.1316202123 Patient records are typically aggregated at a certain regional level and routinely available. Studies looking at individual outcomes from clinical or epidemiological studies often face a sampling bias that does not accommodate spatial effects of pollutants. By incorporating large-scale spatial variations in the risk factors, the dynamics between the prevalence of allergic diseases and air pollutant levels, particularly PM10 in our case, would appear differently. From the perspective of public health policy, looking at large-scale patterns is important as regional environmental factors could be related to disparities in health outcomes.24 A study in the Bronx, New York City investigated spatial correspondence between environmental risk factors and allergic diseases to identify spatially disproportionate environmental burdens associated with the diseases from a standpoint of environmental health justice.25
Moreover, few studies have considered other covariates, including socioeconomic variables and meteorological data, in measuring a spatial association between ambient air pollutants and allergic diseases,26 although there are many confounding factors in determining the etiology of allergic diseases.2728 The impacts of socioeconomic factors have not been sufficiently considered and the effects of air pollution on asthma symptoms vary depending on regional socioeconomic status.29 Socioeconomic factors are likely important in explaining differential outcomes in allergic diseases,30 and regional socioeconomic levels were associated with asthma-related hospital admissions affected by air pollution.2829
Thus, our study aims to examine spatial variability in how the level of PM10 is associated with the prevalence of 3 allergic diseases (atopic dermatitis, asthma, and allergic rhinitis) in Seoul, Korea by using inpatient and outpatient data aggregated at the sub-district level. Since there are only 25 monitoring stations measuring the level of PM10 on a daily basis in Seoul (1 per each of the 25 districts), our study employs a spatial interpolation technique to allow them to correspond with the disease prevalence data as calculated for the 424 sub-districts in the city. A series of multiple regression models are estimated to assess the impact of PM10 on the prevalence of each allergic disease, with relevant socioeconomic and meteorological variables at the regional level controlled. Geographically weighted regression (GWR) models are also run to investigate regional variation in the findings. Our approach allows for the identification of more specific areas (i.e. sub-districts instead of districts) with the highest risks of allergic diseases, which is valuable for policy design and implementation.
MATERIALS AND METHODS
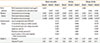
We conducted a cross-sectional study examining ecological association between PM10 and the prevalence of allergic diseases in the city of Seoul, South Korea. The numbers of patients per 10,000 inhabitants for asthma, atopic dermatitis, and allergic rhinitis in 424 sub-districts of Seoul in 2011 were calculated respectively, based on data collected by the National Health Insurance Corporation (NHIC) of South Korea. We used the definitions of 3 allergic diseases delineated by the Korean Standard Classification of Disease (KCD),31 and detailed codes for each disease are shown in Table 1. Outpatient and inpatient medical treatments due to symptoms of each allergic disease were counted for each sub-district based on a patient's dwelling address and divided by the total registered population in the corresponding sub-district.32 We counted each patient only once even if the patient had been treated multiple times under the same code. Table 2 summarizes the final disease prevalence data used for this study, the number of patients per 10,000 residents (male, female, and overall) for each disease in each of the 25 districts in Seoul.
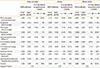
The concentrations of ambient air pollutants were measured on a daily basis at 25 monitoring stations in Seoul during 2011, as collected by the Ministry of the Environment of Korea. Measurements of 5 major air pollutants were used to calculate annual average concentration in each of the 25 districts of Seoul: SO2 (ppb), NO2 (ppb), O3 (ppb), CO (ppb), and PM10 (µg/m3). As for meteorological data, the average values of temperature, wind speed, and precipitation in 2011 were obtained from the Korea Meteorological Administration in Seoul. Meteorological data were measured at 1 observatory per each district, which is different from the air pollution monitoring station. To better control for confounding factors, including socioeconomic covariates, in our regression analysis we included the following covariates aggregated at the sub-district level: (a) average of officially assessed land value (Korean Won per m2), (b) percentage of apartments, (c) number of households relying on welfare, as a proxy of household income level, (d) population density, (e) the number of taxi and transportation businesses, and (f) the percentage of college educated household heads.
Statistical modeling based on observed and interpolated data aggregated at the sub-district level allowed us to investigate PM10 and allergic diseases for ecological association, which is defined as "the association between 2 characteristics both measured at the aggregate level rather than the individual level."33 Epidemiological studies indicate the association between disease and behavioral as well as environmental determinants at the population level rather than at the individual level.34 Although aggregate-level data are more accessible than those obtained at the individual level, interpretation is subjected to "ecological fallacy" which refers to errors resulting from inferences with the nature of individuals deduced from inference for the group or area to which those individuals belong.3536 Despite the difficulties of interpreting aggregated data at the individual level, a number of methodological improvements have been developed to overcome ecological bias.3738 When there are population risks that cannot be inferred from individual data, examining ecological association could be a useful way to reveal the possible impacts such risks could bring about.39 Also, ecological studies carried out in smaller areas are likely to be more informative when there is reasonable supposition that area characteristics are predictive of the prevalence of the target variable.40 Few studies have examined ecological associations between allergic diseases and ambient air pollutants, suggesting an important contribution from our study design.
We thus conducted statistical analyses of ecological associations between each of the 3 allergic diseases and PM10 concentration. First, we conducted an ordinary least squares (OLS) regression analysis of allergic disease prevalence using PM10 measurements, the air pollutant of primary interest, and meteorological measurements measured at the district level. The allergic disease prevalence variables were collected at the sub district level and were aggregated for this analysis. Due to a mismatch between the levels of data aggregation, mainly because of the limited number of air pollution monitoring stations, we interpolated the concentration levels of PM10 from the 25 points to the entire surface of Seoul by using the ordinary kriging method. It has been demonstrated to be more accurate than other interpolation methods for estimating air pollutants.4142 With a spherical model, we log transformed the data as a valid method for estimating levels of air pollutants while allowing "out-of-range predicted values" to be excluded.43 With the interpolated measurements of PM10 in each sub-district, another OLS regression analysis was performed to scrutinize ecological associations between PM10 and the prevalence of allergic diseases in Seoul. Various sub-district level socioeconomic factors were added to the OLS model to confirm if PM10 remains significantly associated with allergic diseases.
Next, in an attempt to assess the spatial heterogeneity in the estimated relationship between PM10 and allergic diseases, we performed GWR analysis, which has been widely applied in the public health literature.444546 Using the results from the GWR model for atopic dermatitis, we created maps to visualize the main findings of concentrations of PM10 and atopic dermatitis risks across sub-districts in Seoul.
RESULTS
Descriptive information for all the variables used in our statistical models is summarized in Table 3. The average level of PM10 remains the same after being interpolated (approximately 46.8 µg/m3), whereas its level of dispersion indicated by the standard deviation shrinks substantially (3.1 to 0.9 µg/m3). As measured at the district level, annual average precipitation was 185 cm, temperature was 12.3℃, and wind speed was 0.7 m/sec. On average, 3.6% of households relied on welfare subsidies provided by the government, 52.1% of households lived in apartments, and 47.5% of heads of household had a college education. Average land value was 3.7 million Korean Won per square meter. Approximately 38 clinics were located on average within each sub-district.
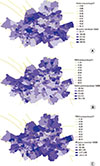
Fig. 1A-C illustrate spatial variations in prevalence of the 3 allergic disease types overlaid with the PM10 contour in Seoul. Although it appears that the areas with higher levels of PM10 were clustered in the southeastern regions of Seoul, more scattered patterns were observed for the prevalence of all 3 allergic diseases. There is a substantial dissimilarity among the patterns of the disease prevalence.
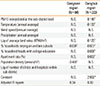
Table 4 summarizes the results of the 3 OLS models for each allergic disease: (1) the observed level of PM10 with weather factors, (2) the interpolated level of PM10 with weather factors, and (3) the interpolated level of PM10 with both weather and socioeconomic factors. PM10 measurements were positively associated with the prevalence of atopic dermatitis (P<0.01), and the size of its impact became greater when interpolated at the sub-district level. The coefficient for PM10 remained the same in the atopic dermatitis model even after controlling for various socioeconomic factors (P<0.01). It is found that the atopic dermatitis prevalence was positively associated with the apartment dwelling rate and the number of clinics within the sub-district. Atopic dermatitis was negatively associated with temperature and wind speed, as well as the rate of households relying on welfare subsidy, which serves as a proxy for the poverty rate. No significant effect of PM10 was observed on asthma and allergic rhinitis when controlling for sub-district level socioeconomic factors. The welfare poverty indicator and apartment dwelling rate were found to be significant predictors for asthma and allergic rhinitis. Model fit was substantially improved by including socioeconomic variables. The atopic dermatitis and allergic rhinitis models had better fit than the asthma model.
Table 5 shows the results of GWR on inpatient and outpatient visits for each allergic disease at the sub-district level, using the interpolated PM10 levels, along with other covariates. The GWR model allows us to present both lower and upper quantiles of all the model coefficients, indicating how the simulated coefficients were distributed and identifying sub-districts with significant associations. In the atopic dermatitis model, we found that the middle 50% of the coefficients for the PM10 variable range from 0.04 to 0.157 across sub-districts in Seoul, as compared to the traditional OLS regression which estimated the PM10 parameter to be significant (P<0.01) and equal to 0.051 for the entire city. This variability in the model parameter suggests that the association between the PM10 measurements and atopic dermatitis prevalence is not stationary at the subdistrict level.
The proportion of statistically significant GWR t-statistics for sub-districts is presented in Table 5. The interpolated PM10 variable is positively and significantly related to atopic dermatitis prevalence in about 39% of sub-districts, and is not significant in any of the remaining sub-districts. Although the PM10 variable was not significantly related to asthma prevalence in the global OLS regression model, the GWR results in Table 5 indicate that the t-statistic is negatively significant at the P<0.05 level in about 36% of sub-districts in Seoul, and positively significant in about 10%. In addition, we found a similar spatial variation within the study area for the GWR model coefficients for most of the weather and socioeconomic factors, as summarized in Table 5. A Monte-Carlo test for assessing whether spatial variation in the relationship between each independent variable and the dependent variable is statistically significant across the city of Seoul, indicates significant evidence of spatial nonstationary status (P<0.01).
Fig. 2 visualizes and identifies locations within Seoul where GWR performs relatively better in estimating predicted values of atopic dermatitis prevalence. The GWR model for atopic dermatitis appears to perform adequately. In a majority of sub-districts, the residuals of data were within ± 0.2 from the predicted mean. In some sub-districts in the western region of Seoul, our models do not adequately explain the atopic dermatitis prevalence.
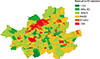
In order to explore the spatial patterns of our GWR results, we generated a map (Fig. 3) that represents the geographic distribution of statistical association of interpolated PM10 and atopic dermatitis prevalence. The darkest shades are used to depict sub-districts with a positive t-statistic larger than or equal to 2.58, the lighter shades are used to display sub-districts with a positive t-statistic greater than or equal to 1.96, and no shading represents sub-districts with a t-statistic between -1.96 and +1.96. This map illustrates not only the areas where the PM10 variable has a strong statistical influence on atopic dermatitis prevalence in the model, but also important local variation not captured by the global OLS model. In general, the PM10 measurement is positively associated with atopic dermatitis prevalence across the sub-districts in the northern region of Seoul (called "Gangbuk") but is not significant mostly in the southern region of Seoul below the Han River (called "Gangnam").
To further demonstrate the utility of a modeling approach incorporating a spatially-varying relationship between PM10 measurements and atopic dermatitis prevalence, Table 6 compares the OLS results for the atopic dermatitis model from the 2 distinct regions in Seoul, Gangnam and Gangbuk. The OLS results for these regions indicate that a majority of the variables, including the PM10 measurements, were found to be statistically significant only in Gangbuk. Most of the variables in the Gangnam region were insignificant, except for a poverty indicator. This comparison exercise demonstrates how the impacts of some explanatory factors vary spatially and thus emphasizes the limits of using a traditional OLS model, which could fail to incorporate local variations of environmental and socioeconomic effects on allergic disease prevalence.
DISCUSSION
This study examined a spatial association between the level of PM10 and the prevalence of 3 allergic diseases in Seoul, Korea by using inpatient and outpatient count data aggregated at the sub-district level and the average daily concentration of PM10 interpolated to the 424 sub-districts in the city. A series of statistical models using the data indicated that PM10 was a significant predictor of atopic dermatitis, whereas no significant effect of PM10 was observed on allergic rhinitis and asthma when socioeconomic and meteorological factors were controlled for. PM10 effects on atopic dermatitis were not consistent throughout Seoul, with statistical significance only in the Gangbuk region.
The prevalence of allergic diseases is rising dramatically in both developed and developing countries, and the development and exacerbation of allergic diseases may be attributed to rapidly increasing air pollution levels. Clinical research suggests environmental factors are important in allergic diseases, but the relative importance may vary spatially when accounting for other factors. Clinical studies may provide insufficient guidance for policy at the regional level and can be supplemented by epidemiologic studies.
To the authors' knowledge, this is the first study to assess the level of ecological association between PM10 measurements and allergic diseases in Korea using GIS-based spatial modeling techniques. Although this research does not reveal causal links between elevated PM10 and allergic diseases, the findings contribute to policy guidelines regarding regional-level environmental factors. GIS and spatial statistical techniques, such as kriging and GWR, play a critical role in ensuring the robustness of results and addressing the limitations of air pollution and disease prevalence data. The implication of the GWR models used in this study is that uniform policy interventions may not work due to significant regional variations in environmental and socioeconomic factors for allergic diseases.47
Only the prevalence of atopic dermatitis was significantly associated with the level of PM10 interpolated at the sub-district level in this study. In general, sensitization to allergens could play a major role in developing allergic diseases. The rates of sensitization to allergens in South Korea were 80.9% for asthma and 89.9% for allergic rhinitis;4849 however, while that for atopic dermatitis was only 60.0%.50 This may indicate that atopic dermatitis could be influenced more by air pollution factors, such as PM10, than the other diseases, due to its lower sensitization rate for other allergens. This finding is consistent with the relatively small associations of air pollution with the prevalence of asthma or allergic rhinitis observed in this study.
The GIS-based statistical analyses using spatially-aggregated data utilized in this study effectively uses the routine public health and environmental data in Korea, such as the National Health Insurance Corporation (NHIC) data, the Korea National Health and Nutrition Examination Survey (KNHANES) data, and various environmental monitoring data. These datasets tend to be collected repeatedly (e.g. every year or month) and at more disaggregated administrative units (e.g. sub-districts). Such data are becoming readily available to medical researchers and public health professionals, and can be widely analyzed with other administrative database for relatively low cost to better address various concerns of allergic diseases.
GIS-based spatial modeling techniques play a role in evaluating impacts of variation of air pollution impacts on allergic diseases, which could provide valuable policy guidance for environmental and public health policymakers. Identifying spatial patterns may allow officials to concentrate on high-risk areas. Targeted policies, such as enhancing accessibility to hospitals or community health centers, could effectively improve public health by mediating environmental risk factors and by efficiently allocating limited resources. Regionally-tailored strategies would better manage environmental risk factors associated with allergic diseases.15


 XML Download