

 PDF
PDF ePub
ePub Citation
 Print
Print


INTRODUCTION
Invariant natural killer T (iNKT) cells are unique CD1d-restricted T cells that act as a bridge between the innate and adaptive immune systems. Upon activation by glycolipids presented by CD1d molecules on antigen-presenting cells, iNKT cells rapidly produce large amounts of Th1 and Th2 cytokines and influence neighboring NK cells, B cells, and conventional CD4+/CD8+ T cells. In addition, iNKT cells can reciprocally affect dendritic cells (DCs).1
Recently, iNKT cells have been shown to play an important role in the pathogenesis of asthma.2 Invariant NKT cells are required for the development of ovalbumin-induced,34 α-galactosylceramide (GalCer)-induced,5 ozone-induced,6 and virus-induced airway hyper-reactivity (AHR)7 in mouse models of asthma. Non-invariant NKT cells may also play a role in the development of allergen-induced AHR in mice.8
It has been reported that iNKT cells are increased in the airways of patients with asthma9; however, some investigations have failed to demonstrate any marked increase in iNKT cells in the airways.10 Recently, we demonstrated the association of sputum iNKT cells with the development of eosinophilic airway inflammation,11 as well as the mobilization of circulating iNKT cells to the airways and lungs during asthma exacerbation in patients.12 Indeed, we revealed that circulating iNKT cells were Th2-like and related to lung function in asthma patients. 13
Agents capable of modulating the function of iNKT cells may have a therapeutic potential to control asthma. Because iNKT cells can be activated by cytokine signaling as well as TCR signaling, 14 alterations in the micro-environmental cytokine milieu may modify the function of iNKT cells in asthma.2 Some bacterial components have been reported to anergize iNKT cells in mice.15 It has been reported that bacterial flagellin B (FlaB) from Vibrio vulnificus, a ligand of Toll-like receptor (TLR),5 induces IgA responses16 and that intranasal co-administration of FlaB inhibits allergen-induced AHR and eosinophilic airway inflammation in a mouse asthma model.15 In addition, flagellin A inhibits IgE-mediated intestinal allergy in mice.17 The immunomodulatory effects of flagellin are primarily mediated via TLR5 on DCs.18 Thus, the treatment of DCs with flagellin may alter the surrounding cytokine milieu to modify the function of iNKT cells.
Indeed, we showed that TLR4, TLR5, or TLR9 ligands inhibited iNKT cells in a mouse model of α-GalCer-induced AHR.19 Additionally, Nguyen et al.20 reported that flagellin as an adjuvant can enhance tumor antigen-specific CD8+ immune responses in cancer immunotherapy. Many TLR ligands can activate human iNKT cells indirectly via DC stimulation.21 Thus, it is possible that FlaB treatment of DCs regulates the function of iNKT cells in asthmatic patients.
Recently, iNKT cells have been classified into various subsets, such as Th1-like, Th2-like, and Th17-like cells.14 Foxp3+ iNKT cells have also been described,22 although their functions are not clear yet.
In the present study, we investigated whether FlaB modulates the function of circulating iNKT cell subsets in asthmatic patients.
MATERIALS AND METHODS
Subjects
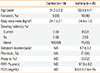
Twenty-five asthmatic patients and 10 healthy controls were included in this study. Asthma was defined by the presence of reversible airflow obstruction (increase in forced expiratory volume in 1 second [FEV1] ≥12% and ≥200 mL after bronchodilator test) or AHR in patients with typical asthmatic symptoms. AHR was designated positive if the concentration of methacholine that provoked a 20% decrease in FEV1 was lower than 25 mg/mL. Healthy controls had neither symptoms nor history of allergic diseases, including asthma, rhinoconjunctivitis, and atopic dermatitis (Table 1). All subjects agreed to participate in the study and provided written consent. The Ethical Review Board of Chonnam National University Hospital approved this study.
Purification of recombinant FlaB
A 1.5-kb fragment containing the open reading frame of Vibrio vulnificus flaB (Vv-flaB) was cloned into pTYB12-yielding pCMM250 (New England Biolabs, Ipswich, MA, USA). Recombinant FlaB was purified as previously described.15 An intein-Vv-FlaB fusion protein was induced by 0.5 mM isopropylthio-β-galactoside. To prepare the bacterial lysate for affinity column chromatography, the resultant pellet was resuspended in a lysis buffer (20 mM Tris-Cl [pH 7.5], 500 mM NaCl, 1 mM ethylenediaminetetraacetic acid [pH 8.0], 0.1% Triton X-100, 0.1% Tween 20, and 20 µM phenylmethanesulfonylfluoride) and sonicated (Vibra Cell VCX500; Sonics & Materials, Newtown, CT, USA) on an ice bed. After sonication, recombinant tag-free Vv-FlaB was purified using a chitin column and 50 mM 1,4-dithiothreitol solution in accordance with the manufacturer's protocol. The purity of recombinant Vv-FlaB was confirmed by sodium dodecylsulfate-polyacrylamide gel electrophoresis and Western blotting using rabbit anti-Vv-FlaB antibody elicited by GST-FlaB. AffinityPak™ Detoxi Gel™ LPS removing gel (Pierce Biotechnology, Rockford, IL, USA) was used to remove LPS contaminants from the recombinant protein. The LPS level in the FlaB preparation was lower than 0.48 EU/mL.
Peripheral blood mononuclear cell (PBMC) cultures and FlaB treatment
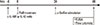
Heparinized blood was layered over an equal volume of Lymphoprep™ solution (Axis-Shield PoC AS, Oslo, Norway) and was centrifuged at 2,000 rpm for 30 minutes. PBMCs were isolated from the interface and used to measure the function of iNKT cells. PBMCs (1×10⁶ cells) were treated with 1 µg/mL FlaB for 48 hours, in which 0.1 µg/mL α-GalCer (Enzo Life Sciences, Lausen, Switzerland) was added for the latter 24 hours to stimulate iNKT cells. In some experiments, 6 hours before FlaB treatment, monoclonal antibodies (mAbs) against IL-10 (0.25 µg/mL; Biolegend, San Diego, CA, USA) or IL-12 (10 µg/mL; BD Biosciences, San Jose, CA, USA) receptors were used to block the effect of IL-10 or IL-12, respectively, with the corresponding isotype mAbs (Biolegend or BD biosciences). The intracellular cytokines of iNKT cells and Foxp3+ iNKT cells were measured using flow cytometry, and the secreted cytokines from iNKT cells were determined by using enzyme-linked immunosorbent assay (ELISA) (Fig. 1).
Co-cultures of FlaB-treated DCs and CD3+ T cells
CD14+ monocytes were sorted from PBMCs using an LS-MACS column (Miltenyi Biotec, Auburn, CA, USA) with a purity >95%. To generate DCs, the monocytes were cultured in 6-well plates (SPL Lifesciences, Pocheon, Korea) with 50 ng/mL GM-CSF (Creagene, Seongnam, Korea) and 25 ng/mL IL-4 (R&D Systems, Minneapolis, MN, USA) for 6 days at 2×10⁶ cells/2 mL in IMDM (Gibco, Grand Island, NY, USA) with 10% FBS (Gibco) and antibiotics (100 U/mL penicillin and 100 µg/mL streptomycin; Gibco), as previously described.23 The purity of the CD11c+ DCs was >85%. CD3+ T cells were sorted from CD14- cells using a LS-MACS column with a purity >90%. CD3+ T cells were frozen immediately in liquid nitrogen and were thawed before co-culture with DCs.
A total of 1×10⁵ DCs were treated with 1 µg/mL FlaB for 48 hours. In some experiments, IL-10 and IL-12 were measured in the supernatants by using ELISA. For patients with house dust mite (HDM) Dermatophagoides farinae-sensitive asthma, 5×10⁵ DCs treated with FlaB were co-cultured with an equal number of CD3+ T cells in the presence of 1 µg/mL D. farinae extract (Arthropods of Medical Importance Resource Bank, Seoul, Korea) for 6 days. Thereafter α-GalCer (0.1 µg/mL) was added to stimulate iNKT cells 24 hours before flow cytometry to determine intracellular cytokines of iNKT cells on day 6. In some experiments, IL-10R (0.25 µg/mL; BioLegend) or IL-12 (10 µg/mL; BD Biosciences) mAbs were used with the corresponding isotypes to block the effect of IL-10 or IL-12 at the beginning of the co-cultures.
Measurement of intracellular cytokines of iNKT cells
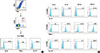
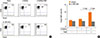
Invariant NKT cells were stained using PE-TCRvα24 (Beckman Coulter, Marseille, France) and APC-TCRvβ11 (BD Biosciences) mAbs. IgG1 mAbs (Beckman Coulter or BD Biosciences) were used as isotype controls. To detect intracellular cytokines, cells were fixed and permeabilized using Cytofix/Cytoperm kits (eBiosciences) according to the manufacturer's instructions. These cells were incubated with FITC-IL-4 (BD Biosciences), FITC-IFN-γ (BD Biosciences), FITC-IL-17 (Biolegend), or FITC-IL-10 mAbs (BD Biosciences). IgG1 isotype controls (Biolegend or BD Biosciences) were used. After gating on lymphocytes and Vα24+Vβ11+ iNKT cells, IL-4+, IFN-γ+, IL-17+, or IL-10+ cells were expressed as a percentage of Vα24+Vβ11+ iNKT cells (Fig. 2A).
Measurement of Foxp3+ iNKT cells
To quantify Foxp3+ iNKT cells, PBMCs were permeabilized using a Foxp3 staining buffer kit (eBioscience) and stained with FITC-TCRvα24 (Beckman Coulter), APC-TCRvβ11 (BD Biosciences), and PE-Foxp3 (eBioscience) mAbs. IgG2aκ (eBioscience) was used as an isotype control for Foxp3 mAb. After gating on lymphocytes and Vα24+Vβ11+ iNKT cells, Foxp3+ cells were expressed as a percentage of Vα24+Vβ11+ iNKT cells.
RESULTS
FlaB treatment inhibits IL-4 and IL-17 production by iNKT cells
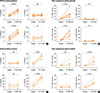
The stimulation of PBMCs from asthmatic patients and healthy controls with α-GalCer increased IL-4, IFN-γ, and IL-17 production. Because α-GalCer is a specific ligand of iNKT cells, the cytokines should be produced by iNKT cells. ELISA showed that FlaB treatment decreased the α-GalCer-stimulated production of IL-4 (P<0.01 and P<0.05, respectively) and IL-17 (P<0.01 and P<0.05, respectively) in PBMCs from asthma patients and healthy controls. IFN-γ production was decreased by FlaB treatment, although not significant (P=0.09), in PBMCs from both asthmatic patients and healthy controls (Fig. 3).
To further confirm that the cytokines were indeed produced by the iNKT cells, intracellular cytokines were measured using flow cytometry. An appropriate measurement time point for each intracellular cytokine following α-GalCer stimulation was determined. For IL-4, IFN-γ, and IL-17 cytokines, intracellular production peaked 24 hours after α-GalCer stimulation (Fig. 2B). Production of the 3 intracellular cytokines was increased in iNKT cells following α-GalCer stimulation. However, FlaB treatment suppressed intracellular production of IL-4, IFN-γ (P<0.01 and P<0.05, respectively), and IL-17 (P<0.001) from iNKT cells in both asthmatic patients and healthy controls. In terms of IL-10 production, α-GalCer stimulation did not increase, nor did FlaB treatment significantly alter IL-10 production in iNKT cells from either asthma patients or normal controls (Fig. 4).
FlaB suppresses the function of iNKT cells via an IL-10-dependent mechanism in asthmatic patients and via an IL-12-dependent mechanism in healthy controls
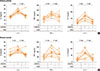
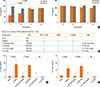
Next, we addressed the mechanism by which FlaB inhibited the function of iNKT cells. In asthmatic patients, ELISA measurements showed that the addition of IL-10R mAb alleviated the reduction of α-GalCer-stimulated production of IL-4 and IL-17 by FlaB treatment in PBMC cultures. The addition of IL-12 mAb did not alter the levels of IL-4 or IL-17 production (Fig. 5A). Moreover, flow cytometric analyses revealed that the reduction by FlaB of IL-4- and IL-17-producing iNKT cells was alleviated by treatment with IL-10R mAb, but not IL-12 mAb (Fig. 5B). These results suggest that FlaB may inhibit IL-4 and IL-17 production via an IL-10-dependent mechanism in iNKT cells from asthmatic patients.
In contrast, ELISA showed that, in PBMC cultures from healthy controls, addition of IL-12 mAb abrogated the reduction by FlaB treatment of α-GalCer-stimulated production of IL-4 and IL-17. The addition of IL-10R mAb did not alter the level of IL-4 or IL-17 production (Fig. 5C). Furthermore, flow cytometric analyses revealed that the reduction of IL-4- and IL-17-producing iNKT cells by FlaB was alleviated by treatment with IL-12 mAb, but not IL-10R mAb (Fig. 5D). These results suggest that FlaB may inhibit IL-4 and IL-17 production via an IL-12-dependent mechanism in iNKT cells from healthy controls.
FlaB-treated DCs inhibit the function of iNKT cells via IL-10 production in asthmatic patients
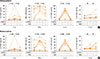
Because FlaB can activate TLR5 on DCs,18 we generated CD14+ monocyte-derived DCs from the peripheral blood of asthmatic patients and treated them with FlaB in vitro. FlaB treatment increased the production of IL-10, but not IL-12, by DCs (Fig. 6A). To determine whether FlaB-treated DCs-produced IL-10 could suppress the function of iNKT cells, we co-cultured FlaB-treated DCs and autologous CD3+ T cells in the presence of HDM extracts in HDM-sensitive asthmatic patients (Table 2 and Fig. 6B). Following the co-cultures, intracellular cytokines in iNKT cells were analyzed by using flow cytometry. Stimulation with α-GalCer increased the number of IL-4- and IL-17-producing iNKT cells. FlaB-treated DCs decreased the number of IL-4 and IL-17-producing iNKT cells. The suppressive effects were alleviated by IL-10R mAb treatment. However, IL-12 mAb treatment did not alter the suppressive effect of FlaB-treated DCs (Fig. 6C and D). These results suggest that FlaB treatment may inhibit the IL-4 and IL-17-producing capability of iNKT cells via DCs-derived IL-10 from asthmatic patients.
FlaB induces Foxp3+ iNKT cells in an IL-10-dependent manner
Recently, a regulatory Foxp3+ iNKT cell subset has been reported. 22 We addressed the possibility that FlaB-treated DC-producing IL-10 may induce Foxp3+ iNKT cells in PBMCs from asthmatic patients using the protocol described in Fig. 1. Stimulation with α-GalCer did not change the number of Foxp3+ iNKT cells, but FlaB treatment increased the number of Foxp3+ iNKT cells (P<0.05). Blocking IL-10 signaling with IL-10R mAb treatment prevented the increase of Foxp3+ iNKT cells (Fig. 7). The results suggest that FlaB treatment may induce Foxp3+ iNKT cells via DC-derived IL-10.
DISCUSSION
The present study showed for the first time that FlaB, a TLR5 ligand, inhibits circulating Th2- and Th17-like iNKT cells via DCs in an IL-10-dependent mechanism, which is associated with the induction of regulatory Foxp3+ iNKT cells, in asthmatic patients.
We showed that FlaB treatment induced IL-10 production from DCs in asthmatic patients, which is consistent with the results of other studies.1724 The capability of DCs to produce IL-10 depended on the concentrations of FlaB, as shown in Fig. 6A. FlaB-treated DCs-produced IL-10 may directly regulate iNKT cells. An IL-10 blockade alleviated the suppressive effect of FlaB on Th2- and Th17-like iNKT cells and the induction effect on Foxp3+ iNKT cells. However, because IL-10-producing DCs or IL-10-differentiated DCs are reported to induce regulatory T (Treg) cells,25262728 FlaB-treated IL-10-producing DCs may indirectly inhibit the function of iNKT cells via the induction of Treg cells.2930 Treg cells can cross-talk with iNKT cells31 and modulate their function.32 Recently, Thorburn et al.33 showed that Streptococcus pneumoniae components induce lung Treg cells, which block the activity of lung iNKT cells, in a mouse model of asthma. Additionally, TGF-α produced by Treg cells may enhance the induction of Foxp3+ iNKT cells.22 It is less likely that FlaB directly inhibits iNKT cells, because IL-10 blocking completely eliminated the suppressive effect of FlaB on iNKT cells in the present study. However, the possibility cannot be excluded, because iNKT cells express various TLRs, including TLR5.21
Invariant NKT subsets, such as Th1-like, Th2-like, Th17-like, and Foxp3+ iNKT cells, may play an important role in the pathogenesis of asthma, although this is not yet clear. We previously showed that the frequency of IL-4-producing iNKT cells was inversely correlated with the degree of lung function in asthmatic patients, suggesting the contribution of Th2-like iNKT cells in uncontrolled asthma.13 Th17-like iNKT cells play a critical role in a mouse model of ozone-induced neutrophilic asthma6 and have also been reported in humans.34 Furthermore, iNKT cells express Foxp3 in healthy individuals.2235 FlaB-induced Foxp3+ iNKT cells may suppress Th2-like and Th17-like iNKT cells. Foxp3+ iNKT cells may behave like Foxp3+ Treg cells, which exert a tolerogenic effect on immune responses.22 No Foxp3 expression was observed in IL-10+ iNKT cells.36 Our findings are in agreement with this in that IL-10+ iNKT cells were not induced by FlaB treatment, suggesting that Foxp3+ iNKT cells may be a different subset of IL-10+ iNKT cells.
Additionally, in healthy individuals, FlaB inhibited the function of Th2- and Th17-like iNKT cells. However, this suppression was IL-12 dependent, unlike that in asthmatic patients. FlaB has been reported to induce the production of IL-12 from DCs.37 It is likely that FlaB increases IL-12 production from DCs, leading to the anergy of iNKT cells.15 Recently, we showed that treatments with TLR4, TLR5, and TLR9 agonists suppress airway iNKT cells in an IL-12-dependent manner.19 However, in the present study, no increase in IL-12 following DC treatment with FlaB from healthy volunteers was detected (Fig. 6A). It may be possible that FlaB increased the production of IL-12 by other immune cells present in the PBMC preparation, such as B cells or other TLR5-positive cells, which might have suppressed iNKT cell functions via an IL-12-dependent mechanism. Human B cells have previously been reported to express TLR5, which supports this theory.38 Similarly, flow cytometric analysis showed the significant reduction of IFN-γ+ iNKT cells, but ELISA revealed a non-significant small decrease of IFN-γ production in PBMC supernatants after FlaB treatment. These finding suggest that other immune cells present in PBMCs, such as NK cells, may produce IFN-γ. For example, a recent study reported that flagellin stimulation induces the production of IFN-γ by NK cells.39
Collectively in patients with a specific asthma phenotype associated with iNKT cells, FlaB will be an effective immunomodulator for iNKT cell-targeted immunotherapy.

 XML Download