Journal List > Allergy Asthma Immunol Res > v.8(2) > 1052559

Lee, Han, Jung, Youn, Lee, Park, Lee, and Park: Association Between Obesity, Abdominal Obesity, and Adiposity and the Prevalence of Atopic Dermatitis in Young Korean Adults: the Korea National Health and Nutrition Examination Survey 2008-2010

Abstract

Purpose

Whether obesity is a risk factor for atopic dermatitis (AD) remains unclear. The aim of the present study was to investigate the association between obesity and AD in Korean young adults.

Methods

We included nationally representative data of 5,202 Korean adults aged 19-40 years, obtained from the cross-sectional Korea National Health and Nutrition Examination Survey 2008-2010.

Results

Single (unmarried) status was more frequently observed in AD patients (male, [P=0.0002] and female, [P<0.0001]). AD prevalence exhibited a U-shape trend in relation to body mass index (BMI), waist circumference (WC), and total body fat (BF) percentage, especially in young adult women. Women with BMI ≥25 kg/m2, WC ≥80 cm, and highest quartile (Q4) of total BF percentage had the highest prevalence of AD. The odds ratio (OR) for participants with both BMI ≥25 kg/m2 and WC ≥80 cm was 3.29 (95% confidence interval [CI] 1.71-3.55); therefore, having both general and abdominal obesity was considered a prominent risk factor for AD in young women. After adjustment for confounding factors, including age, smoking, alcohol drinking, exercise, vitamin D, income level, and single status, high BMI (≥30 kg/m2) (OR=4.08, 95% CI: 1.53-10.93), high WC (≥80 cm) (OR=2.05, 95% CI: 1.07-3.94), and high BF percentage (Q4) (OR=2.10, 95% CI: 1.24-3.57) were shown to be significantly associated with AD in young adult women.

Conclusions

In this large-scale nation-wide study of Korean adults, obesity was positively related to the presence of AD in women. Our findings suggest that weight management may help prevent AD.

INTRODUCTION

Atopic dermatitis (AD) is a pruritic chronic inflammatory skin disease. The prevalence of AD is gradually increasing in many countries, and the management of AD is a significant burden on patients as well as families.123 Risk factors for AD exacerbation have been identified as food and inhalant allergens, as well as stress. Identification and elimination of worsening factors are important for prevention and treatment of AD.4
Obesity has become more prevalent worldwide.56 Many chronic diseases, such as type 2 diabetes, cardiovascular, and renal diseases, are associated with obesity.78 Moreover, it has been reported that an increase in weight affect the development and clinical manifestations of asthma.9 However, controversies remain about the link between obesity and AD.10 Some studies have shown that obesity is related to AD,9111213 whereas others revealed no relation between the 2 factors.1415 In addition, the association between body fat (BF) composition or abdominal obesity and AD remains unclear. Thus, whether or not obesity is a risk factor for AD remains inconclusive. As the number of participants involved in previous studies was small, it was not sufficient to accurately investigate whether a relation between obesity and AD exists. In the present study, we examined the association between obesity and AD by analyzing large-scale population-based data from the Korea National Health and Nutrition Examination Survey (KNHANES) 2008-2011.

MATERIALS AND METHODS

Data source and participants

We analyzed data from the KNHANES 2008-2010. The KNHANES is a representative, population-based, health examination. It has been conducted with an annual rolling sampling design that have included a complex, stratified, multistage probability-cluster survey of a representative Korean population sample aged 1 year and above since 1998.16 The KNHANES is organized by the Korean Ministry of Health and Welfare and consists of a cross-sectional survey using physical examination, health interview, and nutritional evaluation. It is conducted by specially trained interviewers or examiners who are not provided with any prior information about the participants.17 The survey results are weighted to represent the non-institutionalized population nationally as well as in each province. A detailed description of the plan and operation of the survey is available on the KNHANES website (http://knhanes.cdc.go.kr/).
Overall, 9,308 (74.30%) of 12,528 subjects, 10,078 (79.22%) of 12,722 subjects, and 8,473 (77.46%) of 10,938 subjects participated in the KNHANES 2008, 2009, and 2010, respectively. In the present analysis, we limited the study population to adults aged 19-40 years. This study excluded individuals whose AD status was unclear or for whom the parameters necessary for analysis were insufficient, such as age, body mass index (BMI), waist circumference (WC), and total BF. Finally, data from 5,202 subjects were analyzed in the present study. Each participant provided written informed consent, and the study protocol was approved by the Institutional Review Board of the Korea Centers for Disease Control and Prevention. The present study was also approved by the Institutional Review Board of The Catholic University of Korea (approved No. KC15EASI0101).

Measurements

All participants were asked about their demographic variables, socioeconomic characteristics, and medical history. We examined the prevalence of AD based on the KNHANES survey question "Have you ever been diagnosed as having AD by a physician?" On the basis of the answer to the question, we divided the participants into 2 categories: the AD and non-AD groups. We also determined the prevalence of asthma based on whether or not a doctor or other health professionals had ever told the participants they had asthma.
Smoking status, alcohol consumption, and physical activity were assessed via a self-reported questionnaire. Smoking status was categorized into 2 groups: current smokers and nonsmokers. The amount of pure alcohol consumed (g/day) was calculated using the average number of alcoholic beverages consumed and the frequency of alcohol consumption. Subjects who drank ≥30 g/day were classified as heavy drinkers. Physical activity was defined using the International Physical Activity Questionnaire (IPAQ).18 The regular exercise group included subjects who exercised for at least 20 minutes at a time, at least 3 times a week.
Participants were grouped by region of residence as follows: urban (Seoul, Busan, Daegu, Incheon, Gwangju, Daejeon, Ulsan, and Gyeonggi-do) or rural (Gangwon-do, Chungcheongbuk-do, Chungcheongnam-do, Jeollabuk-do, Jeollanam-do, Gyeongsangbuk-do, Gyeongsangnam-do, and Jeju-do).
Household income was adjusted for the number of family members and was divided in terms of quartiles. We defined participants with "low income" as those whose household income fell into the lowest quartile.
Physical examinations were performed by skilled staff members, in accordance with standard procedures. Subjects wore light clothing without shoes, and with jewelry and other items removed during weighing and measuring, which were measured to the nearest 0.1 kg using an electronic scale (GL-6000-20; G-tech, Seoul, Korea; maximum 200 kg) and 0.1 cm with a portable stadiometer (Seca 225; Seca, Hamburg, Germany; max 230 cm), respectively. WC was measured during exhalation to the nearest 0.1 cm at the midpoint between the lower border of the rib cage and the highest point of the iliac crest, using a measuring tape (Seca 200; Seca). We calculated BMI as weight (kg) divided by the square of the height (m). Based on these results, we defined obesity as a BMI of ≥25 kg/m2.1920 The cutoff values for abdominal obesity were defined as a WC ≥90 cm for men and a WC≥80 cm for women.21 We divided subjects into the following 4 groups: the non-obese/normal, non-obese/high, obese/normal, and obese/high WC groups.
Body composition was analyzed with the dual-energy x-ray absorptiometry (DXA) method (QDR 4500A; Hologic Inc., Waltham, MA, USA; maximum weight, 204 kg). DXA calibrations were maintained through an internal referencing system, which periodically measures bone-and soft tissue-equivalent reference standards during the examination of the participants. The KNHANES data sets include whole-body DXA measurements of fat mass (g), muscle mass including bone mineral content (g), and percentage fat (fat mass/total mass×100).22 Data were also collected for a number of predefined anatomical regions, including the arms, legs, trunk, pelvic area, and whole body. Arm fat was defined as the sum of fat mass in both arms, and leg fat as the sum of fat mass in both legs. The trunk comprised the right and left ribs, thoracic and lumbar spines, and pelvic area. Using the DXA data, subjects were divided into 4 groups based on the quartiles of total BF percentage.

Statistical analysis

To take into account the complex sampling design using the KNHANES sampling weights, and to provide nationally representative prevalence estimates, statistical analyses were performed using the SAS survey procedure (version 9.2; SAS Institute, Inc., Cary, NC, USA). In order to minimize the effect of variations between survey years, all analyses performed in this study were adjusted for survey year. Participant characteristics were described using means and standard error (SE) or as proportions. The general and clinical characteristics of the participants with and without AD were compared using Student's t test and the chi-squared test. Multiple logistic regression analyses (including age, smoking, drinking, exercise, vitamin D, and WC) were used to examine the association of BMI, WC, and BF with the prevalence of AD. First, as the prevalence of AD decreases with age, age was considered a confounding factor. In addition, AD in adults is more likely to be associated with life-style factors such as smoking, alcohol consumption, and low level of physical activities.23 Obesity, a multifactorial disease, also is known to be associated with smoking cessation, alcohol drinking, and low physical activities.24 Furthermore, according to reports which draw attentions recently, AD in adults is linked with low serum Vitamin D concentration in Korean.25 Vitamin D deficiency is also known to be related to obesity.26 Therefore, we considered age, smoking, drinking, exercise, vitamin D, income level as well as single status to be confounding factors. Subgroups of participants were defined based on their level of obesity, abdominal obesity (based on WC) and total BF percentage quartiles. The prevalence of AD and the odd ratios (ORs) and 95% confidence intervals (CIs) were calculated across subgroups. A P value of <0.05 was considered statistically significant.

RESULTS

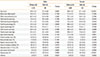
The mean age of subjects with AD was 27.31±0.45 years, and the mean BMI was 23.44±0.28 kg/m2. The mean WC and total BF percentage in participants with AD were 78.56±0.69 cm and 27.88±0.60%, respectively. A comparison of the clinical characteristics between the AD and non-AD groups is shown in Table 1. The prevalence of AD was similar in men (4.36%) and in women (4.47%). Men with AD were younger, more likely to be single, and have asthma compared to the non-AD group, but no difference was noted in the anthropometric parameters. Women with AD were younger, had higher total BF percentage and trunk fat percentage, and had a lower income level. Single (unmarried) status was significantly more frequent in patients with AD compared to subjects without AD, in both male (P=0.0002) and female (P<0.0001).
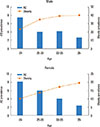
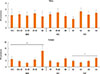
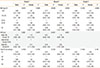
The prevalence of AD tended to decrease with age, while people with obesity increased with age in both men and women (Fig. 1). Fig. 2 shows the prevalence of AD in subgroups according to BMI, WC, and total BF percentage. In contrast to what was observed in men (BMI P for trend=0.9066; WC P for trend=0.5166; total BF percentage P for trend=0.1342), the prevalence of AD in women exhibited a U-shape trend in relation to BMI (P for trend=0.0066), WC (P for trend=0.0852), and total BF percentage (P for trend=0.0452), respectively. The most obese women, those with a BMI ≥30 kg/m2, had the highest prevalence of AD and women in the lowest BMI group (<18.5 kg/m2) showed the second highest prevalence of AD. Similarly, women with abdominal obesity (WC ≥80 cm) and the highest quartile of BF percentage showed the highest prevalence of AD, followed by the lowest WC and BF groups.
In Table 2, by using multiple logistic regression analyses, we calculated ORs and 95% CIs for AD according to BMI, WC, and total BF percentage. BMI ≥23 but <25 kg/m2, total BF percentage Q2, and WC ≥85 but <90 for men or WC ≥75 but <80 cm for women served as the reference group. Women who had a BMI >30 kg/m2 were at the greatest risk for AD. In model 1, after adjusting for age, high BMI (≥30 kg/m2), high WC (≥80 cm), and the highest quartile of total BF percentage (Q4) was significantly associated with AD in women. For obese women (BMI ≥30 kg/m2), the OR was 4.38 (95% CI, 1.69-11.34); for abdominal obese women (WC ≥80 cm), the OR was 2.12 (95% CI, 1.11-4.03); for high total BF percentage (Q4, the highest quartile), the OR was 2.12 (95% CI, 1.24-3.61). These associations were not attenuated after adjusting for age, smoking, alcohol drinking, exercise, vitamin D levels, income level, or single status (model 2). These findings were not observed in men.
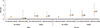
Next, we classified subjects according to their general obesity (BMI ≥25 kg/m2 in men and women) and abdominal obesity status (WC ≥90 cm in men and ≥80 cm in women). Women with general obesity (BMI ≥25 kg/m2), particularly those with abdominal obesity (WC ≥80 cm) had a significantly higher propensity for AD than those without (P=0.0097). In contrast, in men there was no significant association between obesity or abdominal obesity and AD (P=0.5668) (Fig. 3).

DISCUSSION

Based on the present cross-sectional study with a nationwide sample of the Korean population, it is suggested that obesity, including abdominal obesity, is related to AD in women, but not in men. In addition, we observed the association between AD and total BF percentage by measuring adiposity using DXA.
Obesity is a well-known risk factor for asthma.27 Until recently, several reports have suggested a relation between obesity and AD, although the conclusion has not been in agreement. Some studies showed positive correlations911282930 and others showed no relation between obesity and AD.1415313233 In AD, different manifestations are observed depending on the age group. AD persisting into adulthood tends to be more severe with recurrent flare-up.34 In a previous study, Visness et al.35 observed that childhood obesity is related to AD. Silverberg et al.36 reported that prolonged obesity in early childhood is one of the risk factors for developing AD in children. Yoo et al.37 showed that obesity was linked to atopy in Korean adolescents. Previous studies on the association between obesity and AD in adults were scarce, and to our knowledge, there is only 1 study by Zhang and Silverberg13 reported that adults (over 18 years old) with obesity (OR, 1.56; 95% CI, 1.24-1.95) have higher odds ratio of AD. However, a correlation has not been found clearly between obesity and AD in Korean adults.
In the present study, we confirmed that obesity was significantly related to AD in young Korean adult women. Although these data indicate a U-shaped association between obesity and AD, AD is especially associated with high BMI, WC, and total BF percentage in Korean young women. Moreover, we showed consistently results from general obesity (BMI), central obesity (WC), and total BF percentage in AD women. Central (abdominal) obesity (WC), as well as obesity (BMI), is an important risk factor for various disease conditions, including allergic disease.38 Silverberg et al.39 recently reported the association between central obesity (WC) and moderate to severe AD in children (4-17 years). In asthma, the relation to central obesity has been reported in adults. We showed an association between AD and central obesity in young adult women. Interestingly, general obesity (BMI ≥25 kg/m2) with abdominal obesity (WC ≥80 cm) showed synergistic effects in AD for women (odd ratio 3.29). Furthermore, excess body fat, especially abdominal body fat, has been known as a risk factor for development of chronic diseases.40 DXA directly provides the information of body adiposity.41 In the present study, we demonstrated that high total BF percentage from DXA is associated with AD in young women.
The mechanism underlying the association between obesity and AD is still largely unknown. However, some mechanisms have been proposed.28293642 One theory suggests that in obese individuals, altered leptin activity can lead to an immune imbalance, including altered leukocyte distribution and function, as well as activation and trafficking.4344454647 It also can induce pro-inflammatory immune responses.44454849 In addition, leptin activates macrophages and macrophage-derived cytokines in obese people.50 Another study showed that obesity can also alter the profile of other adipokines51 and may contribute to the pathogenesis of AD. Moreover, obesity often results in an increase in various cytokines, such as tumor necrosis factor alpha (TNF-α), IL-6, and IL-2.5253 Some studies showed an increased concentration of Th2 cytokines such as IL-4 and IL-13 in obese asthmatics, which may play a role in the interaction between obesity and bronchial asthma.54 Obesity can induce continuous inflammation leading to elevations in C-reactive protein (CRP), inflammatory cytokines, and leptin.113554555657 CRP, an inflammatory maker, is also a potential contributor to the pathogenesis of AD in obese people.
In the present study, gender differences in the relation between obesity and AD were demonstrated for the first time. In young women participants, there is a strong association between obesity and AD, which differs from the results of previous studies. This difference may be because of the differences in total BF percentage between women and men participants which can affect the relation of obesity to AD. Generally, women have a higher total BF percentage than men.58 Previous studies have shown high systemic leptin levels, low systemic adiponectin levels, and increased TNF-α concentrations especially in women.5960 Estrogen is produced by the adipose tissue, and therefore differences in estrogen levels may explain the stronger association in women who are obese compared to men. In obese people, estrogen levels are elevated. Estrogen leads to eosinophilic granulation and eosinophilic adhesion to human mucosal cells. Estrogen may enhance leukocyte survival and may also contribute to an increase in chronic inflammation in obese people.6162636465
The strengths of the present study are as follows. First, we analyzed a nationally representative large sized sample from KNHANES data. Second, this data was adjusted for confounding factors in the statistical models. Moreover, we included BF measured by the DXA method as an independent variable along with BMI and WC. However, there were some limitations in the present study. As the KNHANES was based on the self-reported questionnaire, recall bias may have occurred. Also, being a cross-sectional study, a causal relation between AD and obesity could not be confirmed. Therefore, whether AD therapy such as glucocorticoid use contributed to obesity remains unclear.
In conclusion, the present study provides evidence of a relation between obesity and AD in Korean young adult women based on the nationally representative data. In particular, high BMI, large WC, and high total BF percentage are potential risk factors for AD in young females. Therefore, controlling weight may alleviate AD symptoms in this population. Nonetheless, it remains to be seen whether weight management can improve AD in other populations, such as children and men. Therefore, prospective studies are necessary to assess relationships between obesity and the development and manifestations of AD.

Figures and Tables

Fig. 1

Trends of atopic dermatitis (AD) prevalence and obesity with age.

aair-8-107-g001
Fig. 2

A comparison of the correlation between atopic dermatitis (AD) prevalence and body compositions (body mass Index (BMI), waist circumference (WC), and total body fat (BF) percentage) according to gender and age (*P for trend <0.05).

aair-8-107-g002
Fig. 3

Odds ratio for atopic dermatitis (AD) in subgroups based on body mass index (BMI) and waist circumference (WC). The error bars represent 95% confidence intervals. Obesity was defined as BMI ≥25 kg/m2. Abdominal obesity was defined as WC ≥90 in men, and ≥80 in women, respectively.

aair-8-107-g003
Table 1

Changes in self-efficacy scores before and after falling into income poverty, Australian population with asthma 2007

aair-8-107-i001
Male Female
Without AD With AD P value Without AD With AD P value
2,152 98 2,830 132
Age (year) 29.9±0.2 27.5±0.6 0.0001 30.0±0.2 27.1±0.6 <0.0001
Body mass index (kg/m2) 24.0±0.1 23.8±0.4 0.7104 21.9±0.1 22.5±0.4 0.1886
Waist cirecumference (cm) 82.3±0.3 81.6±0.9 0.4381 73.1±0.2 74.4±1.0 0.7466
Total body fat mass (kg) 16.0±0.2 16.2±0.6 0.7080 18.0±0.1 19.2±0.7 0.0740
Total body fat percentage (%) 21.7±0.2 22.3±0.5 0.2655 31.6±0.2 32.9±0.6 0.0335
Trunk fat percentage (%) 23.3±0.2 23.7±0.7 0.5638 30.0±0.2 31.7±0.7 0.0249
Leg fat percentage (%) 40.5±0.4 42.4±1.1 0.1112 70.4±0.3 71.5±1.1 0.2768
Total muscle mass (kg) 53.0±0.2 52.2±0.7 0.2405 35.8±0.1 35.8±0.5 0.8489
Trunk muscle mass (kg) 25.4±0.1 25.1±0.4 0.4935 18.0±0.1 17.8±0.3 0.6001
Leg muscle mass (kg) 17.7±0.1 17.3±0.3 0.1325 11.4±0.0 11.5±0.2 0.8801
Current smoker (yes), (%) 51.8 (1.2) 43.6 (5.4) 0.1374 8.6 (0.7) 7.3 (2.4) 0.6144
Heavy drinker (yes), (%) 17.9 (0.9) 10.9 (3.6) 0.1087 3.7 (0.4) 6.3 (2.3) 0.1686
Regular exercise (yes), (%) 28.6 (1.2) 24.6 (4.9) 0.4365 21.0 (1.0) 22.3 (4.6) 0.7619
Area of residence (Urban), (%) 86.3 (1.7) 89.3 (3.6) 0.4570 87.8 (1.5) 90.6 (2.8) 0.3789
Education level (≥13 yr), (%) 45.9 (1.3) 39.6 (5.1) 0.2344 47.4 (1.3) 54.2 (4.3) 0.1241
Low house hold income 9.7 (1.0) 10.3 (3.4) 0.8654 8.4 (0.8) 14.1 (3.7) 0.0483
Spouse (yes), (%) 44.8 (1.7) 26.2 (4.5) 0.0002 55.6 (1.5) 30.3 (5.0) <0.0001
Asthma 2.8 (0.4) 7.2 (2.8) 0.0224 2.0 (0.3) 4.5 (2.2) 0.0955

Values are presented as mean ± SE or percentage.

Table 2

Association between BMI, WC, total BF percentage, and atopic dermatitis (AD)

aair-8-107-i002
Model 1 Model 2 Model 3
Male P Female P Male P Female P Male P Female P
BMI (kg/m2) 0.9241 0.0095 0.8106 0.0182 0.7644 0.0994
 -18.5 0.88
(0.27, 2.84)
1.61
(0.75, 3.46)
0.77
(0.24, 2.52)
1.57
(0.72, 3.46)
0.63
(0.14, 2.87)
1.47
(0.63, 3.42)
 18.5-23 1.01
(0.51, 1.98)
1.29
(0.70, 2.39)
0.92
(0.46, 1.82)
1.27
(0.69, 2.36)
0.84
(0.39, 1.83)
1.239
(0.66, 2.34)
 23-25 1 1 1 1 1 1
 25-30 1.26
(0.63, 2.50)
1.98
(0.96, 4.09)
1.27
(0.65, 2.51)
2.00
(0.96, 4.14)
1.40
(0.68, 2.90)
2.06
(0.97, 4.35)
 30- 0.95
(0.31, 2.88)
4.38
(1.69, 11.34)
0.88
(0.28, 2.76)
4.08
(1.53, 10.93)
1.15
(0.24, 5.44)
4.46
(1.29, 15.46)
WC (cm) 0.585 0.0297 0.4491 0.028
 Male -85; female -75 0.73
(0.39, 1.35)
1.19
(0.70, 2.01)
0.67
(0.36, 1.50)
1.10
(0.64, 1.89)
 Male 80-90; female 75-80 1 1 1 1
 Male 90-; female 80- 0.74
(0.36, 1.52)
2.12
(1.11, 4.03)
0.73
(0.36, 1.50)
2.05
(1.07, 3.94)
Total BF percentage 0.1803 0.1935 0.1935 0.0536 0.1465 0.149
 Q1 0.49
(0.25, 0.97)
1.37
(0.78, 2.42)
0.47
(0.23, 0.96)
1.46
(0.83, 2.56)
0.43
(0.21, 0.90)
1.49
(0.83, 2.65)
 Q2 1 1 1 1 1 1
 Q3 0.85
(0.45, 1.63)
1.42
(0.80, 2.53)
0.84
(0.44, 1.63)
1.46
(0.82, 2.61)
0.89
(0.46, 1.74)
1.43
(0.79, 2.57)
 Q4 0.97
(0.54, 1.73)
2.12
(1.24, 3.61)
0.91
(0.50, 1.64)
2.10
(1.24, 3.57)
1.05
(0.49, 2.25)
1.94
(1.09, 3.48)

We divided the groups into four categories (Q1 to Q4) based on KNHANES total BF percentage data, ranging from the lowest quartile group to the highest quartile group, respectively. Values were generated using a multiple linear regression analysis after adjusting for age (model 1); age, smoking, drinking, exercise, vitamin D, income level, and single status (model 2); age, smoking, drinking, exercise, vitamin D, income level, single status, and WC (model 3).

BMI, body mass index; WC, waist circumference; BF, body fat.

Notes

There are no financial or other issues that might lead to conflict of interest.

References

1. Odhiambo JA, Williams HC, Clayton TO, Robertson CF, Asher MI. ISAAC Phase Three Study Group. Global variations in prevalence of eczema symptoms in children from ISAAC Phase Three. J Allergy Clin Immunol. 2009; 124:1251–1258.e23.
2. Williams H, Robertson C, Stewart A, Aït-Khaled N, Anabwani G, Anderson R, et al. Worldwide variations in the prevalence of symptoms of atopic eczema in the International Study of Asthma and Allergies in Childhood. J Allergy Clin Immunol. 1999; 103:125–138.
3. Williams HC. Is the prevalence of atopic dermatitis increasing? Clin Exp Dermatol. 1992; 17:385–391.
4. Akdis CA, Akdis M, Bieber T, Bindslev-Jensen C, Boguniewicz M, Eigenmann P, et al. Diagnosis and treatment of atopic dermatitis in children and adults: European Academy of Allergology and Clinical Immunology/American Academy of Allergy, Asthma and Immunology/PRACTALL Consensus Report. Allergy. 2006; 61:969–987.
5. Bergeron C, Boulet LP, Hamid Q. Obesity, allergy and immunology. J Allergy Clin Immunol. 2005; 115:1102–1104.
6. Wyatt SB, Winters KP, Dubbert PM. Overweight and obesity: prevalence, consequences, and causes of a growing public health problem. Am J Med Sci. 2006; 331:166–174.
7. Chen Z, Yang G, Offer A, Zhou M, Smith M, Peto R, et al. Body mass index and mortality in China: a 15-year prospective study of 220 000 men. Int J Epidemiol. 2012; 41:472–481.
8. Tobias DK, Hu FB. Commentary: obesity and mortality in China: the shape of things to come. Int J Epidemiol. 2012; 41:481–483.
9. Fitzpatrick S, Joks R, Silverberg JI. Obesity is associated with increased asthma severity and exacerbations, and increased serum immunoglobulin E in inner-city adults. Clin Exp Allergy. 2012; 42:747–759.
10. Pyun BY. Natural history and risk factors of atopic dermatitis in children. Allergy Asthma Immunol Res. 2015; 7:101–105.
11. Chen Y, Rennie D, Cormier Y, Dosman J. Association between obesity and atopy in adults. Int Arch Allergy Immunol. 2010; 153:372–377.
12. Silverberg JI, Silverberg NB, Lee-Wong M. Association between atopic dermatitis and obesity in adulthood. Br J Dermatol. 2012; 166:498–504.
13. Zhang A, Silverberg JI. Association of atopic dermatitis with being overweight and obese: A systematic review and metaanalysis. J Am Acad Dermatol. 2015; 72:606–616.e4.
14. Flexeder C, Brüske I, Magnussen H, Heinrich J. Association between obesity and atopy in adults? Int Arch Allergy Immunol. 2011; 156:117–118.
15. Jarvis D, Chinn S, Potts J, Burney P. European Community Respiratory Health Survey. Association of body mass index with respiratory symptoms and atopy: results from the European Community Respiratory Health Survey. Clin Exp Allergy. 2002; 32:831–837.
16. Oh SW. Obesity and metabolic syndrome in Korea. Diabetes Metab J. 2011; 35:561–566.
17. Kim HA, Lee SY, Kwon HS, Lee SH, Jung MH, Han K, et al. Gender differences in the association of insulin resistance with metabolic risk factors among Korean adolescents: Korea National Health and Nutrition Examination Survey 2008-2010. Diabetes Res Clin Pract. 2013; 99:54–62.
18. Hagströmer M, Oja P, Sjöström M. The International Physical Activity Questionnaire (IPAQ): a study of concurrent and construct validity. Public Health Nutr. 2006; 9:755–762.
19. Oh SW, Shin SA, Yun YH, Yoo T, Huh BY. Cut-off point of BMI and obesity-related comorbidities and mortality in middle-aged Koreans. Obes Res. 2004; 12:2031–2040.
20. Yoon SJ, Kim DH, Nam GE, Yoon YJ, Han KD, Jung DW, et al. Prevalence and control of hypertension and albuminuria in South Korea: focus on obesity and abdominal obesity in the Korean National Health and Nutrition Examination Survey, 2011-2012. PLoS One. 2014; 9:e111179.
21. Grundy SM, Cleeman JI, Daniels SR, Donato KA, Eckel RH, Franklin BA, et al. Diagnosis and management of the metabolic syndrome: an American Heart Association/National Heart, Lung, and Blood Institute Scientific Statement. Circulation. 2005; 112:2735–2752.
22. Hong S, Oh HJ, Choi H, Kim JG, Lim SK, Kim EK, et al. Characteristics of body fat, body fat percentage and other body composition for Koreans from KNHANES IV. J Korean Med Sci. 2011; 26:1599–1605.
23. Silverberg JI, Greenland P. Eczema and cardiovascular risk factors in 2 US adult population studies. J Allergy Clin Immunol. 2015; 135:721–728.e6.
24. Wright SM, Aronne LJ. Causes of obesity. Abdom Imaging. 2012; 37:730–732.
25. Cheng HM, Kim S, Park GH, Chang SE, Bang S, Won CH, et al. Low vitamin D levels are associated with atopic dermatitis, but not allergic rhinitis, asthma, or IgE sensitization, in the adult Korean population. J Allergy Clin Immunol. 2014; 133:1048–1055.
26. Bell NH, Epstein S, Greene A, Shary J, Oexmann MJ, Shaw S. Evidence for alteration of the vitamin D-endocrine system in obese subjects. J Clin Invest. 1985; 76:370–373.
27. Ma J, Xiao L, Knowles SB. Obesity, insulin resistance and the prevalence of atopy and asthma in US adults. Allergy. 2010; 65:1455–1463.
28. Murray CS, Canoy D, Buchan I, Woodcock A, Simpson A, Custovic A. Body mass index in young children and allergic disease: gender differences in a longitudinal study. Clin Exp Allergy. 2011; 41:78–85.
29. Kusunoki T, Morimoto T, Nishikomori R, Heike T, Ito M, Hosoi S, et al. Obesity and the prevalence of allergic diseases in schoolchildren. Pediatr Allergy Immunol. 2008; 19:527–534.
30. Suárez-Varela MM, Alvarez LG, Kogan MD, Ferreira JC, Martínez Gimeno A, Aguinaga Ontoso I, et al. Diet and prevalence of atopic eczema in 6 to 7-year-old schoolchildren in Spain: ISAAC phase III. J Investig Allergol Clin Immunol. 2010; 20:469–475.
31. von Kries R, Hermann M, Grunert VP, von Mutius E. Is obesity a risk factor for childhood asthma? Allergy. 2001; 56:318–322.
32. Violante R, del Río Navarro BE, Berber A, Ramírez Chanona N, Baeza Bacab M, Sienra Monge JJ. Obesity risk factors in the ISAAC (International Study of Asthma and Allergies in Childhood) in Mexico City. Rev Alerg Mex. 2005; 52:141–145.
33. Vlaski E, Stavric K, Isjanovska R, Seckova L, Kimovska M. Overweight hypothesis in asthma and eczema in young adolescents. Allergol Immunopathol (Madr). 2006; 34:199–205.
34. Lammintausta K, Kalimo K, Raitala R, Forsten Y. Prognosis of atopic dermatitis. A prospective study in early adulthood. Int J Dermatol. 1991; 30:563–568.
35. Visness CM, London SJ, Daniels JL, Kaufman JS, Yeatts KB, Siega-Riz AM, et al. Association of childhood obesity with atopic and nonatopic asthma: results from the National Health and Nutrition Examination Survey 1999-2006. J Asthma. 2010; 47:822–829.
36. Silverberg JI, Kleiman E, Lev-Tov H, Silverberg NB, Durkin HG, Joks R, et al. Association between obesity and atopic dermatitis in childhood:a case-control study. J Allergy Clin Immunol. 2011; 127:1180–1186.e1.
37. Yoo S, Kim HB, Lee SY, Kim BS, Kim JH, Yu JH, et al. Association between obesity and the prevalence of allergic diseases, atopy, and bronchial hyperresponsiveness in Korean adolescents. Int Arch Allergy Immunol. 2011; 154:42–48.
38. Papoutsakis C, Priftis KN, Drakouli M, Prifti S, Konstantaki E, Chondronikola M, et al. Childhood overweight/obesity and asthma: is there a link? A systematic review of recent epidemiologic evidence? J Acad Nutr Diet. 2013; 113:77–105.
39. Silverberg JI, Becker L, Kwasny M, Menter A, Cordoro KM, Paller AS. Central obesity and high blood pressure in pediatric patients with atopic dermatitis. JAMA Dermatol. 2015; 151:144–152.
40. Must A, McKeown NM. The disease burden associated with overweight and obesity. In : De Groot LJ, Beck-Peccoz P, Chrousos G, Dungan K, Grossman A, Hershman JM, editors. Endotext. South Dartmouth (MA): MDText.com, Inc.;2000.
41. Sun Q, van Dam RM, Spiegelman D, Heymsfield SB, Willett WC, Hu FB. Comparison of dual-energy x-ray absorptiometric and anthropometric measures of adiposity in relation to adiposity-related biologic factors. Am J Epidemiol. 2010; 172:1442–1454.
42. Mai XM, Nilsson L, Axelson O, Bråbäck L, Sandin A, Kjellman NI, et al. High body mass index, asthma and allergy in Swedish schoolchildren participating in the International Study of Asthma and Allergies in Childhood: Phase II. Acta Paediatr. 2003; 92:1144–1148.
43. Santos-Alvarez J, Goberna R, Sánchez-Margalet V. Human leptin stimulates proliferation and activation of human circulating monocytes. Cell Immunol. 1999; 194:6–11.
44. Martín-Romero C, Santos-Alvarez J, Goberna R, Sánchez-Margalet V. Human leptin enhances activation and proliferation of human circulating T lymphocytes. Cell Immunol. 2000; 199:15–24.
45. Lord GM, Matarese G, Howard JK, Bloom SR, Lechler RI. Leptin inhibits the anti-CD3-driven proliferation of peripheral blood T cells but enhances the production of proinflammatory cytokines. J Leukoc Biol. 2002; 72:330–338.
46. Tian Z, Sun R, Wei H, Gao B. Impaired natural killer (NK) cell activity in leptin receptor deficient mice: leptin as a critical regulator in NK cell development and activation. Biochem Biophys Res Commun. 2002; 298:297–302.
47. Caldefie-Chezet F, Poulin A, Tridon A, Sion B, Vasson MP. Leptin: a potential regulator of polymorphonuclear neutrophil bactericidal action? J Leukoc Biol. 2001; 69:414–418.
48. Kiguchi N, Maeda T, Kobayashi Y, Fukazawa Y, Kishioka S. Leptin enhances CC-chemokine ligand expression in cultured murine macrophage. Biochem Biophys Res Commun. 2009; 384:311–315.
49. Weisberg SP, McCann D, Desai M, Rosenbaum M, Leibel RL, Ferrante AW Jr. Obesity is associated with macrophage accumulation in adipose tissue. J Clin Invest. 2003; 112:1796–1808.
50. Loffreda S, Yang SQ, Lin HZ, Karp CL, Brengman ML, Wang DJ, et al. Leptin regulates proinflammatory immune responses. FASEB J. 1998; 12:57–65.
51. Fantuzzi G. Adipose tissue, adipokines, and inflammation. J Allergy Clin Immunol. 2005; 115:911–919.
52. Hajer GR, van Haeften TW, Visseren FL. Adipose tissue dysfunction in obesity, diabetes, and vascular diseases. Eur Heart J. 2008; 29:2959–2971.
53. Tilg H, Moschen AR. Adipocytokines: mediators linking adipose tissue, inflammation and immunity. Nat Rev Immunol. 2006; 6:772–783.
54. Sutherland TJ, Cowan JO, Young S, Goulding A, Grant AM, Williamson A, et al. The association between obesity and asthma: interactions between systemic and airway inflammation. Am J Respir Crit Care Med. 2008; 178:469–475.
55. Olafsdottir IS, Gislason T, Thjodleifsson B, Olafsson I, Gislason D, Jögi R, et al. C reactive protein levels are increased in non-allergic but not allergic asthma: a multicentre epidemiological study. Thorax. 2005; 60:451–454.
56. Mai XM, Böttcher MF, Leijon I. Leptin and asthma in overweight children at 12 years of age. Pediatr Allergy Immunol. 2004; 15:523–530.
57. Wisse BE. The inflammatory syndrome: the role of adipose tissue cytokines in metabolic disorders linked to obesity. J Am Soc Nephrol. 2004; 15:2792–2800.
58. McLachlan CR, Poulton R, Car G, Cowan J, Filsell S, Greene JM, et al. Adiposity, asthma, and airway inflammation. J Allergy Clin Immunol. 2007; 119:634–639.
59. Sood A, Qualls C, Li R, Schuyler M, Beckett WS, Smith LJ, et al. Lean mass predicts asthma better than fat mass among females. Eur Respir J. 2011; 37:65–71.
60. Sutherland TJ, Goulding A, Grant AM, Cowan JO, Williamson A, Williams SM, et al. The effect of adiposity measured by dual-energy X-ray absorptiometry on lung function. Eur Respir J. 2008; 32:85–91.
61. van den Berge M, Heijink HI, van Oosterhout AJ, Postma DS. The role of female sex hormones in the development and severity of allergic and non-allergic asthma. Clin Exp Allergy. 2009; 39:1477–1481.
62. Simpson ER. Sources of estrogen and their importance. J Steroid Biochem Mol Biol. 2003; 86:225–230.
63. Nelson LR, Bulun SE. Estrogen production and action. J Am Acad Dermatol. 2001; 45:S116–S124.
64. Kirschner MA, Schneider G, Ertel NH, Worton E. Obesity, androgens, estrogens, and cancer risk. Cancer Res. 1982; 42:3281s–3285s.
65. Kirschner MA, Samojlik E, Drejka M, Szmal E, Schneider G, Ertel N. Androgen-estrogen metabolism in women with upper body versus lower body obesity. J Clin Endocrinol Metab. 1990; 70:473–479.
TOOLS
Similar articles