

 PDF
PDF ePub
ePub Citation
 Print
Print


INTRODUCTION
The paradigm of asthma management has moved on from relieving acute attacks to achieving optimum asthma control, underpinned by improved understanding of the pathophysiology of the disease and prevalent use of inhaled corticosteroids.1 The need for a simple method for quantifying asthma control status by both patients and physicians has led to the creation of the 'Asthma Control Test' (ACT), a questionnaire that is currently used worldwide.2
The ACT is a self-report questionnaire that consists of 5 assessment items covering the previous four weeks: frequency of dyspnea, use of rescue medications, effect of asthma on daily functioning, frequency of night symptoms, and overall self-assessment of asthma control. Patients assess their subjective perception of their symptoms on a five-point scale for each item and the total score ranges from 0 to 25, with a higher score indicating well-controlled status.2
Since its introduction, the ACT has been validated for various applications in many countries including Korea.3,4 There is a consensus that the ACT reflects asthma control status in ways that objective clinical measures such as pulmonary function may not evaluate.5 Although the results of pulmonary function tests, such as FEV1% predicted (FEV1) values, are considered one of the most important factors determining asthma control status, physicians are also aware of the fact that there is poor correlation between subjective reports of symptoms and pulmonary function at times.6,7 This discrepancy has caused substantial confusion in assessing asthma control status. Some patients show very good correlation between changes in ACT scores and FEV1, while some show no correlation between these 2 important clinical tools, which may mislead physicians in assessing asthma control status. This study was carried out to identify clinical characteristics of asthma patients that are associated with discrepant correlation between changes in ACT scores and FEV1 values over time.
MATERIALS AND METHODS
Study subjects
A total of 252 asthmatic patients who visited the asthma clinic at Asan Medical Center from January 2009 to May 2011 were enrolled. The data were retrospectively reviewed. The study subjects were diagnosed with asthma by allergists based on the presence of asthma symptoms and documented evidence of reversible airway obstruction or airway hyperresponsiveness. The patients visited the clinic at least twice after diagnosis, 3 months apart, with reports of ACT scores and spirometry at both visits. This study was approved by the Institutional Review Board of Asan Medical Center.
Study design
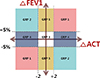
With the measures of ACT and FEV1, we calculated ΔACT and ΔFEV1 between each visit for every patient according to the following equation:

Using ΔFEV1 and ΔACT, we divided the study subjects into 5 groups as shown in Figure. Each group was defined as follows: group 1, positive correlation (FEV1 and ACT move in the same direction); group 2, paradoxical correlation (FEV1 and ACT move in opposite direction); group 3, no change (both FEV1 and ACT unchanged); group 4, ACT change without FEV1 change; and group 5, FEV1 change without ACT change. We defined 'change of FEV1' as change of at least 5% between the 2 visits and 'change of ACT' as change of at least two points between the 2 visits, as shown in Figure.
We compared these 5 groups in terms of several clinical parameters such as demographic data, pulmonary function, atopic status, and induced sputum analysis results. Rhinosinusitis medications taken by the patients such as antihistamine, decongestant and intranasal steroid were also assessed and compared.
Statistical analysis
Due to the small sample size, the Kruskal-Wallis test was used to compare continuous variables and Mann-Whitney U test was used to repeat tests for comparing 10 pairs of groups. Categorical variables were analyzed with Fisher's exact test and Chi-square test. All statistical analyses were performed with SPSS software (Version 19.0; IBM).
RESULTS
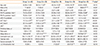
Data from 252 patients were retrieved. Patients were allocated into 1 of the 5 groups, and the patient groups were compared, as summarized in Table.
The variables that showed significantly different features for the 5 groups were age, sex, prebronchodilator FEV1 at both visits, ACT scores at both visits, atopy status, blood eosinophil count and the number of rhinosinusitis medications. The mean patient age was highest in group 2 (59.23±17.23), and the male to female ratio was lowest in group 4 (38.2%) and highest in group 5 (69.1%). Prebronchodilator FEV1 at visit 1 and 2 was highest in group 4 (85.59±15.77 and 85.84±15.74). Group 2 had the lowest proportion of patients with atopy (15.4%) and lowest blood eosinophil counts (217.40±217.85/µL). The proportion of patients using more than 2 kinds of rhinosinusitis medications was the highest (47.3%) in group 4. Body mass index, smoking status, number of pack-years, total IgE level and sputum eosinophil numbers were not significantly different between the 5 groups. Baseline and followed ACT scores were higher at around 23 in groups 3 and 5 compared with other groups.
Group 2, which showed a paradoxical correlation between FEV1 and ACT, was compared individually with every other group. Patients in group 2 had lower blood eosinophil counts, and the group contained fewer atopic patients. Although age difference was not statistically significant for all pairs tested, mean patient age was highest in group 2. In addition, we performed subgroup analysis of group 2, one that has increased FEV1 but decreased ACT and the other that has decreased FEV1 but increased ACT and we found no significant differences between these two subgroups (data not shown).
Group 4, which showed ACT change without change in lung function, comprised more women than men and showed a tendency to use more medications for rhinosinusitis. Patients in group 4 had the highest prebronchodilator FEV1. Conversely, group 5, which showed FEV1 change without ACT change, had the highest proportion of men.
DISCUSSION
This study was carried out to address why some patients show an apparent conflict between their ACT scores and lung function. Clinical characteristics were investigated in patients with a paradoxical relationship between changes in ACT and in FEV1. The results showed that elderly, non-eosinophilic, non-atopic asthma patients were more likely to show discrepant changes in FEV1 and ACT. Female patients were more likely to express greater changes in ACT scores compared with their lung function, and these patients showed a tendency to use more medications for rhinosinusitis. Despite changes in FEV1, male patients were less likely to report changes in ACT scores.
ACT has been validated in large samples of asthma patients, with good repeatability, consistency, and sensitivity to changes in disease severity.2,4 Previous studies have shown significant correlations between ACT score and clinical, functional and, albeit weakly, biological markers of asthma.8,9 On the other hand, some reports have demonstrated that ACT does not correlate with pulmonary function or with direct or indirect markers of airway inflammation.7 It is now generally accepted that ACT score is a valid tool to simply and quickly assess the level of asthma control, but pulmonary function and biomarkers of airway inflammation do not uniformly correspond with ACT.
In real-world practice, patient-reported ACT does not always correspond with physician expectations or predictions, and this is the point where we started our investigation. As far as we know, this is the first study to look for factors that may affect the discrepant ACT and lung function results.
Interestingly, patients belonging to group 2 tended to be older and were less eosinophilic and non-atopic. Elderly asthmatic patients are less aware of acute bronchoconstriction than younger asthmatics,10,11,12 and it can be inferred that impaired perception may influence their reports of the ACT. Although it is a less common phenotype, non-allergic asthma is more frequently associated with higher numbers of serum and sputum neutrophils and is characteristic of older patients.13
Although not statistically significant, group 2 had the highest ratio of smokers to non-smokers and the highest number of pack-years. In a previous study by Kleis et al.,14 smoking asthmatics showed reduced dyspnea perception during a non-specific provocative challenge with methacholine, and the results from our study are consistent with this in that smoking was related with discrepant reporting of ACT.
Consistent with results from previous studies showing that female patients express greater dyspnea than males at similar degrees of bronchoconstriction,15,16 group 4 (ACT changes without FEV1 changes) had the highest proportion of females. Since group 4 had the highest mean prebronchodilator FEV1, it could be said that these patients are more likely to report dramatic changes of ACT scores than is expected based on pulmonary function. This can be partly explained by our observation that these patients tended to be using more medications for rhinosinusitis, therefore feeling more discomfort due to the comorbidity, which could influence their self-assessment of their control status. In the same context, patients in group 5, who report only subtle ACT changes despite FEV1 changes, were predominantly male, suggesting that men tend to under-report their symptoms and are less sensitive to changes in lung function. This speculation is consistent with other studies that characterized sex differences in asthma control and symptom profiles.17
Researchers generally refer to the guideline of standardized endpoints for clinical trials and practice of asthma18 which states that about 10% of FEV1 change is relevant with patients' perception of symptom variation, but we used the cut-off of 5% and this may seem inappropriate. However, it was deliberately set this way because the standardized minimally important difference (MID) of FEV1 is not applicable at times as we witness quite a lot of discrepant ACT changes to their measured pulmonary function. We intended to see if patients recognize differently of their asthma status even with more subtle changes in their lung function.
This study has several limitations. We did not review the presence of all comorbidities that may potentially influence the perception of asthma symptoms and focused only on rhinosinusitis. Rhinosinusitis was reviewed by assessing relevant medications, but more reliable results might be obtained with a more objective tool, such as the severity scale from the ARIA guidelines.19 Since this was a retrospective review of the data, we were only able to indirectly evaluate the severity of rhinosinusitis by determining the number and types of medications taken by the patients. Also, the contents of this study would have been more copious if other factors like treatment adherence had been checked and if serial follow up data of each patient was available. The sample size was not large enough for all 5 groups to draw firm conclusions, especially group 2 which was of the most interest when we initiated this study and we reckon that further well designed studies with larger number of patients that obligate reporting of ACT scores are needed to draw more confident results.
In conclusion, when interpreting ACT scores reported by patients, caution should be taken with elderly patients because the score may underestimate their asthma severity. Moreover, when dealing with patients whose ACT scores fluctuate in an unexpected direction or to an unexpected degree compared with lung function, clinicians must carefully review the patient to look for comorbidities that may affect the patient's general well-being. Furthermore, physicians should be aware that patients may express their perception of asthma symptoms in different ways that may not accord with their lung function. Physicians must also be attentive to parameters other than ACT and FEV1 to better assess asthma control status.
 XML Download