

 PDF
PDF ePub
ePub Citation
 Print
Print


INTRODUCTION
Many academics now consider that allergic rhinitis (AR) and asthma reflect the pathology of a common pathologic process in one 'united airway'.1 Previous studies have indicated an extensive impact of upper airway conditions on the lower airways in airway allergic diseases.2 The majority of patients with asthma have rhinitis.1,3 One-third of allergic rhinitis patients suffer from clinically demonstrable asthma4 and have lower airway inflammation and bronchial hyper responsiveness (BHR).5 There is a 3-fold increased risk of developing asthma if a patient has AR.6 Nasal allergen challenge causes sputum eosinophilia and BHR in patients with allergic rhinitis and asthma.7,8 Asthmatic patients with moderate to severe allergic rhinitis may experience more severe asthma.9,10 Several studies using murine models to mimic the human condition have shown that isolated upper airway allergen provocation initiates allergic inflammation and BHR in the lower airways.11,12,13,14 This suggests that allergen provocation of the upper airways in animals and humans can exert physiological effects in the distal airways in the absence of a direct allergen challenge.
Contrary to previous results on the effects exerted by the upper airways on the lower airways, few studies have focused on the pathologic consequences in an "upstream" organ (the nose) after an isolated lower airway allergen challenge.15,16 The aim of this study was to determine, in a murine model, if an isolated lower airway allergen provocation was sufficient to induce upper airway allergic inflammation and hyperresponsiveness.
MATERIALS AND METHODS
Animals
Six-to-eight-week-old BALB/c female mice (body weight, 18-20 g) were obtained from Guangdong Laboratory Animal Center (Guangzhou, China) and were housed in a specific pathogen-free animal facility at our laboratory. The experimental procedures were approved by the Animal Ethics Committee of the First Affiliated Hospital of Guangzhou Medical University.
Ovalbumin sensitization and challenge
The mice were divided into 2 groups: ovalbumin intratracheally (i.t.)-challenged mice (OVA group) and the control group. The OVA group was actively sensitized with 3 intraperitoneal (i.p.) injections of 100-µg of ovalbumin (OVA, grade V, Sigma-Aldrich, St. Louis, MO, USA) emulsified in 1.3 mg of aluminum hydroxide gel (Sigma-Aldrich) in a total volume of 0.4 mL on days 1, 7, and 14. Fourteen days after the completion of the sensitization, an i.t. challenge was performed 3 times as shown in Fig. 1. For each challenge, the mice were anesthetized with pentobarbital sodium (90 mg/kg administered i.p.) and their limbs and cheeks were tightly attached to an operation table in a supine position; a 5-mm midline cervical incision was made to expose the trachea; the table was then positioned at a 70℃-80℃ angle, and 200 µg of OVA solved in 25-µL of warm (37℃) sterile normal saline was administered. The cervical incision was stitched with a 5.0 silk suture, and the mice were held in an erect position for 40-60 minutes before being returned to their cages. The animals recovered rapidly after surgery. This procedure was performed 3 times in a biological safety cabinet (Labculture A2; Esco Micro Pte Ltd., Singapore). The control group underwent the same procedure but received saline solution instead of OVA.
Nasal and bronchoalveolar lavages
Both groups were sacrificed on days 32, 33, and 35 (6, 24, and 72 hours after the last challenge, respectively) by means of anesthetic overdoses. A retro-orbital bleed was performed to collect blood samples, and the serum was frozen until analysis. Nasal passages were lavaged according to Hellings.17 A polyethylene catheter (Ø 0.7 mm) connected to a syringe was gently inserted into one nostril. One milliliter of phosphate-buffered saline (PBS) was slowly injected into one nasal cavity and simultaneously collected from the contralateral nostril. In this way, both nasal cavities were flushed, and ~0.7 mL of lavage fluid was obtained. The nasal lavage fluid (NLF) was centrifuged (4,000 g, 5 minutes), and the supernatant stored at -80℃ until analysis. The pellet was resuspended in 100 µL of PBS for cell counting.
The lungs were then lavaged as described previously.18 Bronchoalveolar lavage (BAL) cells were obtained by inserting a catheter into the trachea and lavaging the lungs 3 times with 0.8 mL of PBS. Approximately 2.0 mL of BAL fluid were recovered with gentle handling. The supernatant was stored at -80℃ until analysis. The cellular pellet was washed and resuspended in 100 µL of PBS. The cells were spun onto glass slides and stained using hematoxylin and eosin (H&E). Differential cell counts were carried out manually by light microscopy under blinded conditions. Two hundred cells were counted per slide.
Distribution of allergen challenge
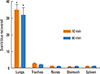
To ascertain the likely distribution of the allergen challenge fluid after intratracheal administration and to assure that the allergen fluid was unlikely to reflux into the nose, 25 µL of a 5 mg/mL solution of Evan's Blue dye (Ameresco Inc., Solon, OH, USA) in PBS were injected into the trachea of anesthetized animals. The animals were then sacrificed by means of anesthetic overdoses after 10 (six animals) or 90 minutes (six animals). The Evan's Blue dye was extracted from the whole tissue of the nares, lungs, trachea, stomach, and spleen in 3 mL of formamide (Ameresco Inc.). The optical density at 620 nm of the supernatant was assessed using a spectrophotometer, and the concentrations were calculated using a curve derived from known standards.
Measurement of nasal airways resistance and response
Nasal airways resistance (RNA) and response were measured by a method described previously.19 Briefly, each mouse was anesthetized with pentobarbital sodium (90 mg/kg administered i.p.). An 18-gauge cannula was inserted into the lower airway trachea via a tracheostomy. After incision of the frontal wall of the pharynx, a blunt 19-gauge needle was carefully inserted into the nasopharynx through the pharynx. The needle was connected to a polyethylene T-tube (inner diameter, 0.305 cm). One end of the T-tube was connected to a syringe pump (LSP02-1B; Baoding Longer Precision Pump Co., Ltd., China), which delivered an airflow (1.0 mL s-1) to the nasal passages. The other end of the T-tube was connected to a pressure transducer (TRD 4515; Buxco Electronics Inc., Sharon, CT, USA) to measure the pressure in the posterior nares during the flow delivery. The resistance of the upper airway catheter (0.215 cm H2O mL-1 s-1) was then deducted from the total resistance to yield the RNA.
For measurements of the early phase nasal reaction, 20 µL of a 5 mg/mL solution of histamine in normal saline were nebulized into the nasal cavity using a nebulizer (AG-AL1000; Aerogen, Dangan, Galway, Ireland). The particles were delivered at a constant airflow rate (1.0 mL s-1, withdraw mode) for 6 seconds by the syringe pump, and RNA was monitored 3 minutes after histamine challenge.
Assessment of lower airway responsiveness
Lower airway responsiveness was measured as previously described.18 The mice were placed in a plethysmograph chamber (PLY4111; Buxco Electronics Inc.) and connected to a ventilator (Model 683; Harvard Apparatus, Holliston, MA, USA). The lung resistance (RL) values were determined continuously following doses of normal saline and methacholine (3.12, 6.25, 12.5, 25, and 50 mg/mL) using a nebulizer.
Histology
Following the nasal and bronchoalveolar lavages, the skulls were skinned, fixed in buffered formalin (10%), and decalcified using a 14% ethylenediamine tetraacetic acid solution. Coronal sections of the skulls at the middle third between the nose-tip and orbit were made and stored in formalin as previously described.18,20 After dehydration and embedding in paraffin, each section (5 µm thick) was stained with H&E and the eosinophils on both sides of the septal mucosa were counted. The lungs were slowly inflated with 1 mL of buffered formalin (10%) and then placed entirely in buffered formalin (10%). Lung sections were stained with H&E.
ELISA of IL-5 levels
IL-5 levels were assayed in NLF, BALF, and serum using ELISA kits, according to the manufacturer's instructions (Invitrogen, Carlsbad, CA, USA). The lower limit for IL-5 detection was 3 pg/mL.
Statistical analysis
Data are expressed as means±SD. Student's t-test, one-way ANOVA, and a Mann-Whitney U-test were used to compare continuous variables as appropriate. Statistical analysis was performed using the SPSS software (SPSS for windows 17.0.1, SPSS Inc., Chicago, IL, USA). Differences with P<0.05 were considered statistically significant.
RESULTS
Distribution of Evan's blue dye
Intratracheal application of Evan's blue dye solution in anaesthetized mice resulted in deposition almost exclusively in the lungs (Fig. 2). Dye uptake in the nose was not significantly different from that measured in the spleen, which served as a negative control.
Analysis of NLF and BALF
Eosinophil counts in NLF were similar in all groups: 0.020±0.028×10², 0.012±0.023×10,2 and 0.014±0.022×10²/mL in the OVA group (n=8) on days 32, 33, and 35, respectively, and 0.018±0.026×10²/mL (P=0.645), 0.008±0.022×10²/mL (P=0.798), and 0.019±0.027×10²/mL (P=0.878), respectively, in the control group (n=8).
In the BALF of the OVA group (n=8), eosinophil counts were significantly higher on days 32, 33, and 35 (34.5±2.02×10⁴, P<0.001; 38.5±3.54×10⁴, P<0.001 and 27.4±3.91×10⁴/mL, P<0.001, respectively) compared with the control group (0.030±0.014×10⁴, 0.021±0.013×10⁴, and 0.029±0.014×10⁴/mL, respectively; n=8).
Histology of the upper and lower airways
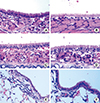
Histological analysis of airway inflammation in the nose and lungs was carried out on days 32, 33, and 35. There was no significant difference in eosinophil and neutrophil cell infiltration into the nasal mucosa between the control and OVA groups (Fig. 3A-D). However, in the lung tissues, the OVA group showed significant peribronchiolar inflammation (Fig. 3E) when compared to the control group (Fig. 3F).
RNA and nasal response
The mean RNA baseline values for inspiration were 1.784±0.06 cm H2O mL-1 s-1 on day 32 (n=8), 1.808±0.05 cm H2O mL-1 s-1 on day 33 (n=8), and 1.731±1.15 cm H2O mL-1 s-1 on day 35 (n=8) for the control group. The mean RNA baseline values for inspiration of the OVA group were 1.814±0.07 H2O mL-1 s-1 on day 32 (n=8, P=0.373), 1.763±0.06 cm H2O mL-1 s-1 on day 33 (n=8, P=0.125), and 1.825±0.09 cm H2O mL-1 s-1 on day 35 (n=8, P=0.817). There were no significant differences between the groups (Fig. 4A).
In all animals, nasal challenge with histamine aerosol increased RNA as measured 3 minutes after challenge. The mean RNA for inspiration of the control group was 3.412±0.251 cm H2O mL-1 s-1 on day 32 (n=8), 3.112±0.242 cm H2O mL-1 s-1 on day 33 (n=8), and 3.081±0.421 cm H2O mL-1 s-1 on day 35 (n=8). The mean RNA for inspiration of the OVA group was 3.224±0.201 cm H2O mL-1 s-1 on day 32 (n=8, P=0.119), 2.937±0.232 cm H2O mL-1 s-1 on day 33 (n=8, P=0.160), and 3.485±0.351 cm H2O mL-1 s-1 on day 35 (n=8, P=0.056). The mean RNA values 3 minutes after nasal challenge were not significantly different between the groups (Fig. 4B).
Lower airway responsiveness
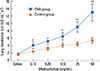
The RL values after saline challenge in the control (1.62±0.10 cm H2O mL-1 s-1, n=8) and OVA (1.77±0.16 cm H2O mL-1 s-1, n=7 groups) were not significantly different on day 33. Methacholine challenge resulted in a dose-dependent increase in lung resistance. The lower airway was significantly more responsive to methacholine in the OVA group, than in the control group. Upon exposure to 50 mg/mL of methacholine, the lung resistance was increased to 12.96±2.27 cm H2O mL-1 s-1 in the OVA group, whereas it increased to 5.42±0.71 cm H2O mL-1 s-1 in the control group (Fig. 5).
IL-5 levels in NLF, BALF, and serum
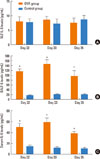
The levels of IL-5 in the BALF and serum were significantly elevated in the OVA group (n=7) compared to the control group (n=8) on days 32, 33, and 35 (Fig. 6A, B). IL-5 levels were detectable in the NLF and serum of both the OVA (8.001±1.65, 8.602±1.21 and 7.601±1.62 pg/mL, respectively; n=7) and control (7.800±1.20, 7.250±1.68, and 8.693±1.46 pg/mL, respectively; n=8) groups on days 32, 33, and 35, but there were no significant differences (P=0.785, 0.086, and 0.179, respectively) (Fig. 6C).
DISCUSSION
Previous studies reported inflammatory changes and BHR in the lower airways of isolated upper airway-challenged mice, even though the distribution of the allergen particles appeared to be only in the nares of these animals.11,12,13,14 It is now accepted that allergen challenge in the nose has implications for the lower airway, but the converse effect is not well-described perhaps because studying the influence of isolated lower airway inflammation in the nose in mice and humans is hampered by difficulty in performing a truly selective lower airway allergen challenge. Moreover, measurement of nasal resistance and responses in small animal models encountered technical difficulties in the past. Few studies have investigated the signs of allergic inflammation in the nose after lower airway allergen challenge.15,16 Li et al.16 sought to establish a lower airway inflammation mouse model using OVA sensitization and challenge and identified no upper airway inflammation. However, in Li's model, the mice were challenged through the nose, which was then rinsed with saline in an attempt to avoid nasal tissue exposure to OVA. This limits the technique, as OVA can be absorbed rapidly through the nasal mucosa of mice.21 Moreover, measurements of physiological changes in the nasal airways were absent.
In this experiment, we employed a new and relatively simple method developed in our laboratory to measure physiological changes in the nasal airways in mice. We used a mouse model that incorporated a selective method of i.t. allergen challenge to minimize undesired intranasal allergen exposure and to assess the effects of a selective lower airway allergen challenge on nasal functional and inflammatory responses. The selectivity of lower airway allergen deposition was guaranteed through the use of a direct i.t. allergen challenge (bypassing the nose surgically), hence avoiding nasal absorption of allergens (Fig. 2). Allergen reflux proximally to the nose was ruled out by injecting Evan's blue into the trachea and confirming that the subsequent levels of Evan's blue in the nose were not significantly different than those in the spleen (Fig. 2). We identified an increase in eosinophils in the lung histologic sections and elevated levels of IL-5 in the BALF from the OVA-sensitized and -challenged animals. In addition, a systemic reaction, as evidenced by increased IL-5 in the serum, was found. However, this model revealed no increase in eosinophil and neutrophil infiltration into the nasal mucosa and the absence of nasal airway hyperreactivity; IL-5 levels in the NLF were similar to those in the control group after i.t. allergen exposure. These data revealed no immunologic or physiological changes in the upper airways of exclusive lower airway-challenged mice, suggesting that allergic responses did not occur in the proximal site of direct antigen deposition. While only short-term effects were observed in this study, the long-term effects of bronchial inflammation on the nose require further investigation.
It is evident that the condition of the upper airway influences the lower airway in both human and animal models. The nasal-bronchial reflex, an altered breathing pattern, pulmonary aspiration of the nasal contents, and increased levels of systemic inflammatory factors serve as mechanisms for lower airway dysfunction.22 In allergic rhinitis patients, segmental bronchial provocation resulted in upper airway inflammation and symptoms in the absence of any direct application of allergen to the nose.15 These subjects already displayed allergic nasal inflammation and impaired nasal function at the baseline measurement. In another study, bronchial challenge induced significant post-challenge RNA increases in most rhinitis patients, while the increases were observed in only 2 of the 12 normal controls.23 The systemic induction of inflammatory mediators and activation of pre-existing nasal inflammatory cells, and the broncho-nasal reflex may have contributed to these results.23 Segmental bronchial provocation in asthmatic individuals without rhinitis has not yet been reported perhaps because the number of subjects with asthma without rhinitis is too small.24
In our animal model, the baseline nasal function was normal, and the nasal mucosa had not been exposed to allergens before i.t. challenge. We found no evidence of diffusion of the allergen solution from the lower airways to the nasal airway.
Although the nose and lungs are anatomically and physiologically closely related, there are intrinsic differences between the nasal and bronchial mucosal tissues. The nose plays a crucial role in protecting the lower airway from potentially harmful agents.25 The nose is the first site of exposure to allergens, but there is usually minimal nasal epithelial damage.26 Studies have shown that the nasal mucosa may be more resistant than the bronchi to allergen exposure.17 Thus, the nose may possess protective mechanisms that minimize remodeling and enhance epithelial regeneration.27 Recent studies have also suggested that the nasal mucosa is an important immunomodulatory site.27 Hens and Hellings25 suggested that the nose is the "gatekeeper" and "trigger" of bronchial disease. Because of its varied functions, Togias28 suggested that the nose signaled to the lower airways more intensely, through a variety of mechanisms, compared with signals from the lower airways to the nose. The 'bidirectional' relationship between nasal and bronchial inflammation is asymmetric. Our study supports this asymmetry in immunologic and physiologic signaling, at least in previously immunologically naïve mice.
Our results in a mouse model suggest that even when they are highly responsive to allergens, the lungs are either not effective in sending immunologic or physiological signals to the nose in response to new allergic stimuli, or the nose is not responsive to these signals. The concept of a single "united airway" may need to be reconsidered to have comparable directionality.


 XML Download