

 PDF
PDF ePub
ePub Citation
 Print
Print


INTRODUCTION
The prevalence of allergic diseases, such as asthma, allergic rhinitis, and atopic dermatitis, is soaring worldwide. However, allergic diseases exhibit predilection in prevalence according to age, sex and ethnicity.1 This difference in prevalence is associated with genetic predisposition as well as regional and cultural factors. Culprit allergens and allergenic sensitization patterns are also related these factors.2
Confirmation of culprit allergens in an individual patient is crucial for the diagnosis of allergic diseases. Proving the presence of allergen-specific immunoglobulin E (sIgE) in the serum can be used as a surrogate method to detect and identify the culprit allergen.3 The in vivo skin prick test (SPT) is a popular one used worldwide to identify the culprit allergen. However, this test has some limitations in clinical settings. For example, the results can be affected by anti-histamine use; therefore, SPT cannot be used to test allergic patients who cannot cease this medication. As an alternative to the SPT, in vitro assays have been developed for clinical use. The radioallergosorbent test was first introduced for the detection of IgE.4 Many commercially available immunochemical assays based on enzyme immunoassay (EIA) or fluorescent enzyme immunoassay (FEIA) are now widely used in clinical settings.5
Among these assays, the ImmunoCAP® test based on the FEIA technique is one of the most popular singlet methods for the detection of sIgE for individual allergens.6 However, the test-cost and elapse-time of this method are relatively higher than those of multiplex tests. Recently, several multiplex allergen-screening tests have been developed for clinical use. However, these systems have several limitations, such as long assay time, and modest sensitivity and specificity.578 Moreover, multiplex allergen screening panels need to be modified according to geographical regions and ethnical differences in culprit allergens. To address this issue, manufactures have to design certain panels to identify culprit allergens related to specific allergic diseases.
One of the limitations of the multiplex assays is the low detection rate for specific allergens included in panels designed for disease-specific or region-specific use. Therefore, adding new allergens does not guarantee the superiority of the determination of culprit allergens.9 A recently developed multiplex sIgE test, Allergy-Q®, can detect 43 allergen sIgEs simultaneously. This assay is based on the EIA technique using nitrocellulose membrane as the solid-phase for allergen immobilization. The system has an internal calibration setup that enables the user to adjust the concentration of sIgE in relation to measured total IgE level in patients' sera quantitatively. In this study, we compared the sIgE detection performance of Allergy-Q® EIA panel with that of ImmunoCAP® FEIA in 260 Korean patients with known allergies for 16 individual allergens, including important inhalant, food, and microorganism allergens in Korea.
MATERIALS AND METHODS
Study participants
Between January and June of 2011, patients who visited the Allergy and Asthma Clinic at Severance Hospital, Yonsei University Health System for the diagnosis of their allergic diseases were enrolled in our study, according to the clinical diagnosis based on their medical history (asthma, allergic rhinitis, atopic dermatitis, and food allergy). All the patients took allergen sIgE ImmunoCAP® tests for suspected culprit allergens. Additional sera sampling for Allergy-Q® assay was performed. Informed consent was obtained from all patients and/or their guardians. The Institutional Review Board of the Yonsei University College of Medicine approved this study (IRB no. 1-2013-0039).
Inclusion criteria were as follows: age, 1-75 years; clinically diagnosed with IgE-related allergic diseases to inhalant and/or food allergens; and absence of other chronic comorbid diseases, including autoimmunity, malignancy, chronic infection, or other immune-related diseases.
Serum preparation and allergen selection
Five milliliters of the whole blood was collected in a vacuum tube (Vacuette®; Greiner Bio-One GmbH, Kremsmünster, Austria) for serum separation. Serum was separated by centrifugation at 3,000 rpm for 5 min, aliquoted into several round-bottom tubes (5-mL BD Falcon™ tubes; BD Bioscience Discovery Labware, Bedford, MA, USA), and frozen at -80℃ for long-term storage or until further use.
Sixteen dominant allergens were selected for inter-assay comparison between Allergy-Q® EIA and ImmunoCAP® FEIA. Seven inhalant allergens (Dermatophagoides pteronyssinus, D. farinae, cat dander, dog dander, birch, mugwort, and timothy pollen), 5 food allergens (egg white, cow's milk, wheat, shrimp, and peanut) and 4 microorganism allergens (Alternaria alternata, Candida albicans, staphylococcal enterotoxin B, and Trichophyton rubrum) were included. These allergens were selected according to their clinical importance and prevalence in Korea.10111213
In vitro allergen sIgE measurements
Serum aliquots were sent to the laboratory without any patient identification. We performed allergen sIgE detection using 2 different systems simultaneously (PROTIA™ Allergy-Q®; Proteometech, Seoul, Korea and ImmunoCAP® 250; Phadia, Uppsala, Sweden). Both the Allergy-Q® EIA and ImmunoCAP® FEIA systems were operated according to the manufacturers' instructions. The sIgE detection range of Allergy-Q® EIA was 0.15-100 kU/L and that of ImmunoCAP® FEIA was 0.1-100 kU/L. However, the classified sIgE scales of the 2 systems were identical (class 0: under 0.35 kU/L, class 1: 0.35-0.7 kU/L, class 2: 0.7-3.5 kU/L, class 3: 3.5-17.5 kU/L, class 4: 17.5-50 kU/L, class 5: 50-100 kU/L, and class 6: >100 kU/L).
Statistical analysis
We analyzed the correlation of sIgE concentrations measured by the 2 methods using intra-class correlation analysis. To compare the equivalence of the 2 methods, we used Passing-Bablok (PB) regression analysis.14 Class association was evaluated by gamma analysis. Agreement of detection was evaluated by Cohen's kappa analysis. We assessed and categorized the kappa value as almost perfect (0.8-1.0), substantial (0.6-0.8), moderate (0.4-0.6), fair (0.2-0.4), and poor (below 0.2).15 We calculated 3 agreement percentages (positive, negative, and total agreement). The positive and negative agreement percentages were calculated with the proportions of agreement for the average of their positive and negative responses. The total agreement percentage was calculated following the same methodology used in a previous study: (total number of results-number of discrepancies) ×100/total number of results.8 A P value of <0.05 was considered statistically significant. For the statistical analysis, we used MedCalc 11.0 (MedCalc Software, Belgium) and SPSS 12.0 (SPSS Inc., Chicago, IL, USA) statistical software.
RESULTS
Characteristics of study participants and paired result sets
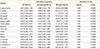
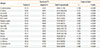
Two-hundred and sixty patients (median age, 11 years [range, 1-71 years]; 151 males and 109 females) were enrolled in this study. Table 1 lists their demographic characteristics according to allergic disease. Overall, 1,799 Allergy-Q®-ImmunoCAP®-matched result sets were obtained and analyzed. The final numbers of matched result sets for each allergen are listed in Table 2.
Inter-method comparison of sIgE concentrations
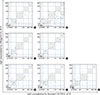
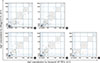
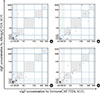
The correlation patterns and intra-class correlation coefficients (ICCs) of each allergen sIgE are presented in Figs. 1, 2, and 3. Almost all the allergen sIgE concentrations showed ICCs above 0.5, except for mugwort pollen and A. alternata sIgEs (Table 3).
Passing-Bablok regression analysis revealed that cat dander and peanut allergen sIgE measurements of Allergy-Q® were most similar to those of ImmunoCAP® FEIA (cat dander: intercept, 0.089 [95% confidence interval {CI} 0.070, 0.100] and slope, 1.112 [95% CI 0.878, 1.478]; peanut: intercept, 0.027 [95% CI 0.008, 0.039] and slope, 1.021 [95% CI 0.897, 1.314]). Some of the allergen sIgE results showed multiple differences (slope: 0.456 for D. pteronyssinus; 0.231 for D. farinae; 0.434 for birch pollen; and 2.119 for timothy pollen), (Table 3).
Association analysis in categorical classes
By applying class boundaries, the concordance of the 2 methods was stratified into classes 0-6. The results of the gamma analysis indicated that almost all the tested allergen sIgEs results had strong associations with their classes (gamma >0.9). Although the gamma values of D. pteronyssinus and D. farinae sIgEs were below 0.9, they exhibited good associations with their classes (gamma >0.8; Table 3).
Agreement analysis of qualitative results
We considered 0.35 kU/L as the cutoff value for positive results in each assay in accordance with the manufacturers' guidelines. We calculated the positive, negative, and total agreement percentages, and the kappa values between the 2 methods for each allergen sIgE detection assay (Table 4). For almost all the allergen sIgEs, we observed 86.63%-96.63% total agreement (83.62%-97.87% positive and 83.87%-92.11% negative agreement). In the kappa analysis, almost all the allergen sIgE results exhibited almost perfect (9 allergens) or substantial (7 allergens) agreement (Table 4).
DISCUSSION
The Allergy-Q® EIA system is a recently developed multiplex sIgE detection assay. The characteristics of this assay are internal calibration using 5 standard IgE level measurements and decreased sample requirement compared to multiplex assays. In this study, we performed an inter-assay comparison between the Allergy-Q® EIA system and the ImmunoCAP® FEIA system, a well-known established singleplex sIgE detection assay. We collected clinical data based on Korean ethnicity.
Serum sIgE assays provide 2 kinds of results to clinicians, qualitative information (0-6 classes) and quantitative measurements in SI units (kU/L). The former is more important in the case of drug or occupational allergens, where sIgE levels are low, although they are important culprits in specific patients.1617 In these cases, sensitivity is important. In other cases, concentration measurements of sIgE have to be accurate. For example, several food sIgE levels are used as clinical surrogates for the oral food challenge test to diagnose food allergy in childhood, such as allergies to egg, milk, and peanut.18
In our study, Allergy-Q® EIA exhibited good agreement ratio (>85% for all tested allergens) and high kappa values (>0.7 for all tested allergens), when compared toImmunoCAP® FEIA, suggesting that Allergy-Q® may be used for the quantitative measurement for sIgE. Moreover, Allergy-Q® EIA exhibited a good correlation with ImmunoCAP® FEIA for many tested allergens (>0.7 ICC for 9 allergens). In particular, the peanut sIgE level obtained using Allergy-Q® EIA showed a very good correlation with that obtained using ImmunoCAP® FEIA (ICC 0.928, PB slope 1.021). Because the ICC was high, the PB slope and intercept were close to one and zero, respectively; therefore, the 2 assays were considered almost identical. Moreover, Allergy-Q® EIA can be used as an alternative method to estimate the concentration of peanut sIgE for the diagnosis of clinical or symptomatic peanut allergy. However, egg white and cow's milk sIgE levels exhibited fair ICC values, but their PB slope was lower than 1, indicating that the sIgE level measured by Allergy-Q® was slightly lower than that measured by ImmunoCAP®.
These discrepancies between the 2 methods may have been attributed to differences in the technique and development of these assays. Both the Allergy-Q® and ImmunoCAP® assays use the same principle to detect sIgE: the indirect immunoassay technique using an allergen-absorbed solid phase. Moreover, an anti-human IgE-conjugated enzyme is used to develop the detecting signal. However, the 2 assay systems use different substrate-enzyme amplification systems (ImmunoCAP®: galactosidase and fluorescent substrate; Allergy-Q®: alkaline phosphatase and visible substrate).6 Moreover, in the Allergy-Q® assay system, the IgE reactivity of an allergen on the nitrocellulose membrane can be affected by adjacent allergens.
Furthermore, the quality of used allergens might affect performance. Although the same species of plants and mites were used in the 2 assays, the cultivating conditions, including feeding material, temperature, humidity, geographical locations, and genetic polymorphism might be different, and these factors might affect the results.1920 The extraction technique and quality control of manufacturing of allergens might also affect the results.21
Although the Allergy-Q® EIA system exhibited some discordance with ImmunoCAP® FEIA, there are several clinical advantages in Allergy-Q®. This method can provide exact IgE levels in international units (kU/L), in accordance with the WHO international Reference Preparation 75/502 for Human IgE.22 Quantitative measurement of sIgE can help clinicians select culprit allergens that need to be included or discarded in allergen- specific immunotherapy and avoidance strategy.2324 Moreover, this enables monitoring changes in sIgE levels in childhood food allergy patients during clinical course.18
The advantages of the multiplex allergen sIgE detection kits are short running time, small amount of blood sample, and more clinical information about culprit allergens. For clinical relevance, false positivity and false negativity must be minimized.25 In this study, despite minimum requirement for serum volume, the Allergy-Q® system showed a high agreement percentage with the ImmunoCAP® system for most of the allergens tested, suggesting that it could be an alternative method for allergy diagnosis.
We did not compare the assay results with skin tests in this study. Using well-standardized allergenic extracts, it had been known that the concordance rate of SPT and serum sIgE measurement ranged from 85% to 95%.26 Furthermore, differences in the condition of the allergens used in vivo or in vitro, including preparation, manufacturer, and storage conditions, can strongly affect the results. Thus, we concluded that SPT might not be an appropriate surrogate to analyze our results from the 2 different in vitro assays.
In conclusion, the Allergy-Q® EIA assay showed good sIgE detection performance compared to ImmunoCAP® FEIA for most of the allergens tested. However, careful clinical analysis will be required for several allergens for quantitative use. Moreover, we tested this system only in Koreans dwelling in the mid-latitude northern hemisphere. Careful consideration is required when applying our data to other ethnic or regional populations.


 XML Download