

 PDF
PDF ePub
ePub Citation
 Print
Print


INTRODUCTION
The prevalence of asthma has dramatically increased during the past decades as in other allergic diseases, but underlying mechanisms that account for this remarkable trend remain unclear.12 This allergy epidemic has been reported in relation to changes in environmental factors, which has generated intense interest in changes of lifestyle such as dietary patterns. One particular dietary component that has recently received much attention is folate, which functions as an essential cofactor for one-carbon transfers, primarily methyl groups, and relates to a complex network of biological processes that are vital to growth.3 Thus, it could directly influence the propensity for epigenetic modifications and might tilt the immunophenotypic balance in favor of allergic disease.
Since maternal folic acid (a synthetic form of folate) supplementation before and during pregnancy has been widely recommended to reach a protective effect on the occurrence of neural tube defects45 as well as other congenital malformations6 for many years, it has been questioned whether folic acid supplementation might be associated with the development of adverse health outcomes in the offspring. Previous findings in mice suggested that maternal dietary supplementation with methyl donors (including folic acid) leads to allergic disease in the offspring,7 and similar conditions were observed in humans.89 These results raised concern about possible adverse effects of folic acid supplementation during pregnancy on respiratory and allergic outcomes in the offspring. However, several studies have not detected any relationship.10111213 In addition, studies conducted to detect the role of impaired folate metabolism, reflected by polymorphism of the methylene-tetrahydrofolate reductase (MTHFR) C677T in the development of asthma or other atopic diseases, have reported inconsistent results.1415
Although several reviews do not support an exact effect of maternal folate status on asthma risk, the timing, course, and dose effect of folate status, and the association between MTHFR C667T polymorphisms and asthma risk are still of increasing interest.16171819 There is no adequate evidence to exclude such effects, either.161819 Therefore, we performed this comprehensive systematic review and meta-analysis of existing evidence to answer the following questions: (1) whether indirect or direct exposure to folate is associated with the development of asthma and other allergic diseases, including atopic dermatitis (AD), eczema, and sensitization; (2) whether there is a dose-dependent relationship between folate status and allergic diseases; (3) whether this relationship could be interpreted by exposure timing; and (4) whether the manifestations could be objectively measured.
MATERIALS AND METHODS
Searching and selection
Comprehensive literature search was performed using databases MEDLINE (PubMed), Cochrane Central, Web of Science, and EMBASE until August 2014. The following terms "folic" or "folate" in combination with "asthma," "wheeze," "allergy," "allergic," "AD," "eczema," "rhinitis," or "hay fever" was used as search terms to identify potential studies. The search strategies were adjusted on the basis of the characteristics of each database. Reference lists of all identified potential studies were manually screened to obtain other relevant articles. No language or initial time restriction was performed.
All trials conducted on humans involving the association of folate status and asthma or other allergic diseases were included except only abstracts or no available data. Replicative publications on the same population with the same outcomes (for example, Thuesen 201020 and Husemoen 200614) were evaluated, one of which with the largest sample size was included when performed meta-analysis.
Data extraction and management
Data was independently extracted by 2 reviewers (T.W. and H.P.Z.). For each study, the following details were extracted: study characteristics (country, study design, and sample size), folate status (reported as maternal use, personal use, objective measure, or gene polymorphism), the duration of follow-up, factors adjusted for the analysis, definition, and estimates of outcomes. To avoid confusing, variations in the definitions used for each outcome in original studies were unified. In this study, atopy was defined as any positive skin prick test (SPT), and sensitization was defined as a positive test for specific immunoglobulin E (sIgE) to at least one of the allergens tested. The Newcastle-Ottawa quality assessment scale was used to evaluate the quality of eligible studies.21 A study with score ≥6 was considered to be of sufficient quality for our meta-analysis. In cases of disagreement, consensus was achieved following discussion with a third adjudicator (G.W.).
Statistical analysis
We followed the guidelines recommended by the Meta-analysis Of Observational Studies in Epidemiology (MOOSE) Group.22 For dichotomous outcomes, the relative risk (RR) or odds ratio (OR) with 95% confidence intervals (CI) was calculated. When original data had been adjusted for potential confounding factors, adjusted estimates were pooled using the generic inverse variance method. The associations between maternal folate/folic acid status at different gestation periods (prepregnancy, early pregnancy, including the first trimester, whole pregnancy or other periods) and asthma/wheeze or other allergic outcomes were investigated. Heterogeneity was examined using the chi-square test with P<0.10 indicating significant heterogeneity, and a I-square (I2) statistic greater than 50% indicated moderate or high heterogeneity. The fixed-effects model was used for the meta-analysis if there was no significant heterogeneity (I2<50%); otherwise, the random-effects model. The Z test was used to determine the significance of the pooled estimates. Funnel plots and the Egger test were used to investigate study size effects indicating possible publication bias when outcomes were reported in at least 10 studies. Statistical analysis was conducted with Stata 11.0 (Stata Corp. LP, College Station, TX, USA), and a 2-sided P value less than 0.05 was regarded as significant.
The quality of the evidence related to the estimation of the association between maternal folic acid supplementation and asthma/wheeze or other allergic diseases in childhood or between MTHFR C667T polymorphisms and asthma risk followed the suggestions of the Grading of Recommendations Assessment, Development, and Evaluation (GRADE) Working Group by using the GradePro software (version 3.6).23
RESULTS
Trials included, study characteristics and quality of reporting
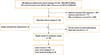
The primary search strategy initially yielded a total of 1,814 citations from MEDLINE (PubMed) (n=141), Cochrane Central (n=29), Web of Science (n=297), and EMBASE (n=1,347). After removing duplicates and scanning the titles and abstracts, 23 articles were left over. After full-text reading and reference tracing, 26 eligible studies 89101112131520242526272829303132333435363738394041 remained (Fig. 1).
The characteristics of the studies included are summarized in Tables S1, 2, 3 as supplementary data. Among these studies, 16 were cohort,891011121320242731343536373841 7 were case-control,25262829323339 and 3 were cross-sectional153040 studies. The studies were undertaken in the US, the UK, the Netherlands, Denmark, Finland, Australia, Norway, Egypt, Korea, Japan, and India. The sample size ranged from 40 to 32,077. In the cohort studies, the follow-up duration ranged from 1 to 8 years. In birth cohort studies, the follow-up duration was more than 1 year for wheeze and 3 years for asthma. No eligible studies involving the development of hay fever were found.
Among the cohort studies, 12 (n=60,560) investigated the association between maternal folate exposure and asthma/wheeze incidence,8910111213242731373841 while 4 (n=9,073) investigated the relationship between folate status at baseline and progress of concerned diseases.20343536 Of all the case-control studies, 5 (n=5,023) investigated the association between folate status and asthma/wheeze,2628293339 and the remaining 2 (n=462) evaluated the association between folate status and AD.2532
Folate and asthma
The incidences of asthma in the offspring with maternal folic acid supplementation during pregnancy (compared to no use) were pooled in 3 cohort studies.101112 There was an insignificant overall effect of maternal folic acid supplementation on the risk of asthma (RR=1.04, 95% CI=[0.94-1.16]). Also, no statistically significant differences in such relationships were observed before conception (RR=0.98, 95% CI=[0.73-1.33]), during early pregnancy (RR=0.98, 95% CI=[0.78-1.23]), or during other periods (RR=1.03, 95% CI=[0.92-1.16]) (Table 1).
Because of significant heterogeneity in measurement and outcome reporting, data about the relationship of the measurable folate level with asthma risk was not pooled. Two studies investigated the association between the measurable maternal folate level and asthma in the offspring. The cohort study by Magdelijns et al.12 showed that higher maternal intracellular folic acid levels in pregnancy tend to decrease risk of childhood asthma in a dose-dependent manner (P for trend=0.05). The case-control study by Haberg et al.26 found a trend of increasing risk of asthma for children aged 3 years across quintiles of maternal plasma folate levels in pregnancy (P for trend=0.006).
Five studies investigated the relationship of maternal folate concentration with risk of asthma. No significant association between the serum folate level and asthma onset293034 or airway inflammation features of asthma (FENO, total IgE level, or the number of positive SPT)36 was found in 3 studies. Thuesen et al.20 found a significant inverse association between serum folate levels and risk of physician-diagnosed asthma, which is similar to that of a previous report.39 Recently, van der Valk et al.34 showed that folate levels of children at birth did not predict asthma-related outcomes up to the age of 6 years.
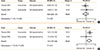
Four studies of case-control or cross-sectional design explored the association between MTHFR C677T polymorphism and asthma,15202733 but only 2 provided available effect measures.1520 No significant association was found between the MTHFR C677T CT genotype and asthma development (OR= 0.98, 95% CI=[0.82-1.17]), but the TT genotype was at risk of asthma in adults (OR=1.41, 95% CI=[1.07-1.86]) (Table 2 and Fig. 2).
Folate and wheeze
Two studies explored the relationship between maternal folic acid supplementation during pregnancy (compared to no use) and wheeze incidence in the offspring,1112 and showed the insignificant overall effect of folic acid supplementation on the risk of wheeze (RR=1.05, 95% CI=[0.95-1.15]) (Table 1).
Three cohort studies investigated the relation of maternal folic acid supplementation during early pregnancy with the occurrence of wheeze in the offspring81213 and found a significant pooled effect of maternal folic acid supplementation during early pregnancy on the incidence of offspring wheeze (RR= 1.06, 95% CI=[1.02-1.09]) (Fig. 3). No association was found between maternal folic acid supplementation during other periods and risk of wheeze in childhood (RR=1.01, 95% CI=[0.98-1.03]).
No significant dose-response relationship was observed between maternal folic acid supplementation during pregnancy and the risk of wheeze.102431 Furthermore, a recently published study did not find that early-life folate levels measured at ages 2, 4, 6, and 8 years were associated with asthma or wheeze at 6 years.35 Kiefte-de Jong et al.13 found no association between maternal MTHFR C677T polymorphism and wheeze in the offspring.
Folate and other allergic diseases
No association of maternal folic acid supplementation during early pregnancy with the occurrence of offspring AD was found (RR=1.15, 95% CI=[0.91-1.45]) (Table 1). For eczema and sensitization reflected by sIgE status in the offspring, the association also did not reach statistically significant difference (Table 1).
Magdelijns et al.12 also did not observe the relationship between maternal use of folic acid supplements during pregnancy and increased risk of AD at 2 years. A study by Oh et al.25 found that intake of antioxidants nutrients, including folic acid, was negatively associated with AD development (OR=0.37, 95% CI=[0.18-0.73]). A cohort study by Kim et al.41 found that a maternal serum folate level of ≥9.5 ng/mL during mid-pregnancy was inversely associated with AD risk at 24 months (OR=0.52, 95% CI=[0.31-0.88]). A case-control study by Shaheen et al.32 found that serum folic acid levels were lower in AD patients than in the control subjects, although this did not reach statistical significance. Kiefte-de Jong et al.13 found no association between maternal MTHFR C677T polymorphism and AD in the offspring.
Assessment of the quality of evidence for the association between folate status and the development of asthma/wheeze or other allergic diseases
Evidence from observational studies was graded from low quality in term of the relatively higher level of heterogeneity or higher risk bias compared to randomized controlled trials.42 Furthermore, we performed the analyses at consistent exposure time that would reduce unexplained heterogeneity of the results. As a result, the quality of evidence related to the estimation of association between maternal folic acid supplementation and asthma/wheeze in childhood was very low (Table 3). Likewise, although genotyping is an objective definition, the quality of evidence related to the estimation of the association between MTHFR C667T polymorphisms and asthma, atopy, or sensitization risk was graded as low (Table 4). The overall quality of evidence was not upgraded due to lack of large effects or dose-response relationships.
DISCUSSION
Along with an increasing number of studies investigating the association between folate status and allergic outcomes, conflicts in this field have been on the rise. Thus, current metaanalyses provide no evidence for the relationship of maternal folic acid supplementation during pregnancy with asthma, AD, eczema, or sensitization in the offspring except that an increased risk of wheeze in childhood related to maternal folic acid supplementation during early pregnancy was observed. In addition, our meta-analysis found no evidence for any association between MTHFR C677T polymorphism and targeted outcomes except that the TT genotype was associated with asthma.
Blatter et al.16 reviewed the relationship between folate and asthma and did not support excessive worry about the adverse effect of maternal folate supplementation during pregnancy on asthma, although there was no adequate data to exclude a weak or modest effect. Brown et al.19 summarized epidemiologic evidence from 10 large prospective cohort studies supporting or refuting the relationship between maternal folate exposure in pregnancy and asthma/allergy in the offspring. A previous meta-analysis conducted by Crider et al.18 did not support the association between folic acid supplementation in the periconceptional period or the first trimester and risk of asthma, but the sensitivity analysis of combined asthma and wheeze showed a significant association. Given a diagnosis of asthma is difficult to establish in infants and toddlers but a diagnosis of symptoms, such as wheeze, are more suitable, it seems better to evaluate the effect of maternal folic acid supplementation during pregnancy on wheeze rather than asthma. A study by Haberg et al.8 reviewed in the 2 meta-analyses reported an increased risk of wheeze between the ages of 6 and 18 months, which is consistent with the result of Bekkers' study11 in which an increased risk of wheeze was reported at age 1 year but not at later ages. Bekkers et al.11 evaluated the effects of maternal folic acid supplementation during pregnancy on wheeze or asthma, respectively, from age 1 or 3 years to 8 years and reported an increased risk association with wheeze but not asthma. Thus, we speculated that not all children with wheeze in early life has a diagnosis of asthma in later life and as time goes on, the effect of maternal folate status on respiratory health in the offspring goes down. However, both of these findings were driven by the large cohort study conducted by Haberg et al.,8 which weighted 89% of the summary estimate in the Crider's study18 and 92% in this study. To address the question of a possible causal association between maternal folic acid status in pregnancy and risk of asthma or wheeze in children, a number of additional studies or analyses should be undertaken considering the misclassification of wheeze and asthma with age factor and follow-up duration.
To better understand the possible association, timing of folate intake during pregnancy should be taken into consideration. Since most clinical trials reviewed in this article provided direct evidence that there is no association between maternal folic acid supplementation during pregnancy and asthma,101112 wheeze,111213 shortness of breath,13 AD,1213 or eczema,1112 objective measurements, including allergic sensitization and bronchial hyperresponsiveness, should be made.11 Nevertheless, studies referred to maternal folic acid supplementation at different periods during pregnancy seemed to have different results. Whitrow et al.9 reported that maternal folic acid supplementation in late pregnancy (30-34 weeks) increased the risk of childhood asthma at 3.5 years. Bekkers et al.11 assessed the risk at similar exposure time (median 33 weeks) and reported an increased risk of wheeze at age 1 year. Moreover, Haberg et al.8 found that early pregnancy (any 4-week-period during weeks 0-12 in pregnancy) increased the risk of childhood wheeze in infants up to 18 months. Because widespread DNA methylation programming occurs in the early embryo, the association between maternal folate status during early pregnancy and respiratory health in early childhood might receive more attention.
Although several studies measured direct or indirect folate exposure and investigated a dose-respond association of folate with allergic outcomes, it is not possible to do quantitative analyses due to diverse exposure assessments. Both positive132631 and negative122030 correlations were observed in current evidence. It is possible that these inconsistences reflect complex relationships between direct or indirect folate exposure and the risk of asthma/wheeze or other allergic outcomes. Recent studies showed that folate levels measured in early life did not affect asthma-related outcomes.3435 Interestingly, another study conducted by Lin et al.36 found "bell-shaped" relationships between serum folate and some inflammatory biomarkers of asthma. Likewise, nonlinear relationships were found between serum folate levels and fractional exhaled nitric oxide, total IgE, or the frequency of positive SPTs. The folate level in the second quartile was significantly associated with increased total IgE when compared to the first quartile (the lowest). However, the levels of inflammatory biomarkers in the third or fourth (the highest) quartiles were similar to those in the first quartile and had no association with folate levels. Therefore, high-quality evidence is needed to interpret this complex network. For future studies, objective measurements can be included, and plasma folate concentration might be a better biomarker. In addition, measurements should be taken into account to evaluate not only indirect folate exposure resulting from mothers during pregnancy, but also the folate status of subjects themselves. The dose, timing, and source of folate exposure should also be considered.
The MTHFR gene encodes the protein for making an enzyme called methylene tetrahydrofolate reductase that catalyzes the conversion of 5, 10-methylenetetrahydrofolate to 5-methyltetrahydrofolate, which is required for the conversion of homocysteine to methionine. MTHFR C677T polymorphism was assumed to be associated with the risk of asthma. An association was reported by Zhou et al.33 that the TT genotype significantly increases the risk of atopic asthma compared to all of the CC and CT genotypes. However, subsequent studies found no association between maternal MTHFR C677T polymorphism and asthma,27 wheeze,13 or AD13 in the offspring or mothers themselves.27 Our meta-analysis found no evidence of the association between MTHFR C677T polymorphism and targeted outcomes except that the TT genotype was associated with asthma. In addition, a previous study found a significant interaction between MTHFR C677T and folate levels.34 Because DNA genotyping is assigned at birth and as an objective measurement, utilizing such methods could help reduce measurement biases and help explore a causal association. Thus, intrinsic genetic factors that could impair folate metabolism for a long time might play an important role in the occurrence and development of asthma. However, because folate status is largely influenced by dietary intake, this hypothesis still needs to be confirmed by further studies, and interpretations of these complex relationships should be presented with caution.
Although this study has referred to almost all of the existing evidence we could acquire, limitations of this study should be noted. First, since the articles included in this study were not randomized controlled trials, some obvious or hidden confounding factors may be unavoidable more or less. Second, potential risk of bias resulting from differences in study design, outcomes assessment, measurements or follow-up performance might produce heterogeneity. Third, the dose-response relationship was not analyzed due to limited eligible studies. Fourth, although asthma or other allergic diseases are associated with both genetic and environmental effects,43 it is difficult to analyze potential interactions between MTHFR C677T polymorphism and environmental factors, such as dietary intake, due to lack of data.
In conclusion, our study indicates that maternal folic acid supplementation during early pregnancy might increase the risk of wheeze in early childhood and that the TT genotype of MTHFR C677T polymorphism impairing folic acid metabolism would be at high risk of asthma development. These results can provide additional information for recommendations regarding forced folate consumption or folic acid supplementation in pregnancy based on its well-established benefits for the prevention of congenital malformations. Further studies are needed to elucidate whether there is a critical window of susceptibility that may reduce risk of neural tube defects without increased risk of asthma or other allergic diseases.


 XML Download