

 PDF
PDF ePub
ePub Citation
 Print
Print


INTRODUCTION
Toxocara canis (T. canis) is a common helminth parasite of dogs.1 Kang et al.2 reported that the overall infection rate of intestinal parasites was 35.0% in all dogs, while those of T. canis were 1.6% in indoor dogs and 10.6% in outdoor dogs in South Korea. T. canis can also infect other animals, including mice, chickens, pigs, and cows through ingestion of embryonated eggs of T. canis in soil.345678 Hatched larvae can penetrate the intestinal mucosa and travel through the blood stream into the liver, lungs, and other organs by visceral migration.9 Although the life cycle of the parasite is completed only in dogs, the larvae of T. canis may be encapsulated and remain alive in a dormant form in the tissues of other animals, including humans.910 Rashman et al.,8 reported that the overall infection rate of intestinal parasites was 78.0% in cattle, while the infection rate of T. canis was 3.0% in cattle of Bangladesh. Some Korean researchers reported high infection rates of intestinal parasites in pigs and cattle,211121314 but there has been no report on T. canis infection in pigs or cattle of South Korea.
Toxocariasis is the clinical term applied to human infections with T. canis,15 which are usually caused by ingesting embryonated eggs from soil/water or by eating raw animal tissues containing infective larvae.916 Clinical features of toxocariasis can be classified as visceral larva migrans or ocular larva migrans according to affected organs.1 Toxocariasis is also known to be the most common cause of peripheral blood eosinophilia and eosinophilic infiltration in various organs in Korea.171819 Our previous study showed that the prevalence of toxocariasis was high in patients with eosinophilia of unknown origin.17 Toxocariasis may present with cough, dyspnea, chest discomfort resembling asthma, itchy sensation of skin, or gastrointestinal discomfort.17 The symptoms can often be subtle or absent. However, toxocariasis resulting from latent or long-term exposure to infective larvae may also be accompanied by central nervous system (CNS) involvement, such as seizure, myelitis, and encephalopathy.2021
The prevalence and clinical characteristics of toxocariasis in asymptomatic subjects have rarely been reported in Korea. Most of the previous studies have included a relatively small number of participants without radiologic evaluation.222324 The clinical implications and significance of the current immunologic diagnosis of toxocariasis have not been fully evaluated. Thus, the objective of this study was to evaluate Toxocara-seropositive rates in asymptomatic Korean adults and clinical implications of the current diagnosis of toxocariasis.
MATERIALS AND METHODS
Participants
The study population consisted of subjects who underwent low-dose chest computed tomography (CT) as part of a comprehensive health checkup examination between March 2012 and December 2013. We prospectively collected potential participants who were voluntarily taking screening examinations including blood tests, stool examinations, abdominal sonography, and low-dose chest CT at Center for Health Promotion of Samsung Medical Center in Seoul, Korea. All who consented to the study were enrolled in the study. Physician interviewers requested voluntary participation in this study, and written, fully informed consent was obtained from each participant before the study began. The study protocol was approved by the Institutional Review Board of Samsung Medical Center in Seoul, Korea.
Methods
During face-to-face interviews, we obtained information on the clinical data of the participants, including age, gender, residence in the urban area (7 main cities: Seoul, Incheon, Daejeon, Daegu, Busan, Ulsan, and Gwangju), and history of raw food intake, including raw liver and raw meat. The amount of raw liver intake in the past year was graded as none, small (less than 10 mouthfuls), moderate (less than 20 mouthfuls), or large (more than 20 mouthfuls). Radiologic findings suggesting involvement of organs, including the lungs and liver (by low-dose chest CT and hepatic ultrasonography), and laboratory findings suggesting parasitic infestation (stool examinations, peripheral blood eosinophil counts, Toxocara-specific IgG levels, and serum IgE levels) were reviewed by the trained staff. Eosinophilia was defined as more than 500 cells/µL or 10% of leukocytes in peripheral blood. Serum samples for total IgE and serologic measurements were collected and stored at -20℃ until needed. The serum total IgE level was measured using the ImmunoCAP250 (Pharmacia and Upjohn Diagnostics AB, Uppsala, Sweden). The upper normal limit of serum total IgE was 200 U/mL.
A serologic diagnosis of Toxocara infection was established by measuring specific IgG antibody to T. canis with a Toxocara ELISA kit (Bordier Affinity Products, Crissier, Switzerland) as previously described.17 The result was considered positive when the absorbance of the sample was higher than the absorbance of the weak positive control. A standardized Toxocara value was presented as a Toxocara ratio, which was defined as the participant's Toxocara IgG optical density (OD) over a weak positive control OD. Toxocara seronegativity was defined when a participant's Toxocara OD was less than that of a weak positive control OD. Participants were divided into 3 groups according to Toxocara grade: those who had Toxocara OD less than that of the weak positive control OD (negative group), those who had Toxocara OD between the weak and strong positive control ODs (weak positive group), and those who had Toxocara OD greater than the strong positive control OD (strong positive group).
Statistical analysis
Categorical variables are summarized as percentages with 95% confidence intervals (CI). Continuous variables are summarized as medians with interquartile range or 95% CI unless indicated otherwise. We performed univariate and multivariate regression analyses to evaluate variable factors associated with Toxocara seropositivity or Toxocara grade. We initially searched for individual parameters-age, sex, residence, history of raw food intake in the past year, history of raw liver intake, history of raw meat intake, amount of raw liver intake, history of pet raising, serum hyperIgEaemia, peripheral blood eosinophilia, any lung nodule including solid nodule, ground-glass opacity, nodule with a surrounding halo, and consolidation, on chest CT, and hypoechoic liver involvement suggesting parasitic infestation.25 We calculated a crude model and models adjusted for age, sex, and all variables, which were associated with Toxocara seropositivity or Toxocara grade with P values <0.10 in univariate analysis. Multicollinearity was tested using the variance inflation factor. There was a significant correlation between history of raw food intake and the amount of raw liver intake, so that the model was not adjusted for the amount of raw liver intake. The multinominal outcome for analysis was Toxocara grade; the negative group was the base reference category. Two-sided P values <0.05 were considered statistically significant. All data was analyzed using Stata version 13.0 (StataCorp, College Station, USA).
RESULTS
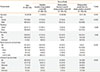
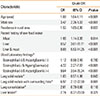
During the study period, 633 (400 men and 233 women) of the 697 people were voluntarily recruited. Their median age (interquartile range) was 51 (49-58) years. Table 1 presents the demographic characteristics of the study population, and Table 2 presents differences in variables according to Toxocara seropositivity and Toxocara grade. Among the 633 participants, 324 (51.2%) had positive results in the Toxocara ELISA (67.0% for men and 24.0% for women). The Toxocara-seropositive rates were 8.3%, 38.9%, 55.8%, and 58.7% of age groups of <40, 40-49, 50-59, and ≥60 years, respectively. The Toxocara-seropositive rates in urban and rural areas were 45.9% and 56.8%, respectively. By the residence area, the Toxocara-seropositive rates were 44.4% (115 out of 259) in Seoul; 45.6% (41 out of 90) in Daegu, Busan, Ulsan, and Gyeongsang-do; 54.2% (109 out of 201) in Incheon and Gyeonggi-do; 67.7% (21 out or 31) in Gwangju and Jeolla-do; 69.6% (32 out of 46) in Daejeon and Chungcheong-do; and 75% (3 out of 4) in Gangwon-do.
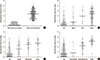
The prevalence of Toxocara seropositivity was significantly higher in participants with history of raw liver intake and those with a large amount of raw liver intake. Compared to participants without Toxocara seropositivity, those with Toxocara seropositivity had higher prevalences of blood eosinophilia, serum hyperIgEaemia, the solid lung nodule with surrounding halo, and the liver lesion. The recent history of raw food intake , amount of raw liver intake, peripheral blood eosinophilia, and serum HyperIgEaemia were positively associated with Toxocara grade (Fig. 1). The frequencies of factors suggesting current toxocariasis, including peripheral blood eosinophilia, serum hyperIgEaemia, and lung/liver involvement, became higher as Toxocara grade increased from weak positivity to strong positivity (Table 2).
The median standardized Toxocara values according to the variables are shown in Fig. 2. The median standardized Toxocara values were higher in participants with history of raw liver intake, those with a large amount of raw liver intake, and those with peripheral blood eosinophilia and serum hyperIgEaemia.
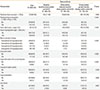
Table 3A shows the results of univariate analysis using logistic regression. Pet raising was not related to Toxocara seropositivity (OR, 1.19; 95% CI, 0.83-1.72; P=0.345). In the multivariateadjusted model, old age (OR, 1.08; 95% CI, 1.04-1.11; P<0.001), male sex (OR, 3.47; 95% CI, 2.26-5.33; P<0.001), and rural residence (OR, 1.55; 95% CI, 1.05-2.30; P=0.027) were significantly associated with Toxocara seropositivity (Table 3B). OR for Toxocara seropositivity in participants with history of both raw liver and meat intake was 8.88 (95% CI, 5.53-14.25; P<0.001) compared to those without raw food intake. OR for Toxocara seropositivity in participants with eosinophilia and hyperIgEaemia was 9.64 (95% CI, 3.54-26.24; P<0.001) compared to those with normal eosinophil count and IgE level. OR for Toxocara seropositivity was 6.97 (95% CI, 2.12-22.90; P<0.001) in participants with the solid nodule with surrounding halo on low-dose chest CT compared to those without the lesion.
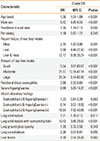
Univariate analysis using multinominal logistic regression demonstrated that the presence of eosinophilia and hyperIgEaemia, the solid lung nodule with consolidation, the solid lung nodule with surrounding halo, and the liver lesion were significantly associated with high Toxocara grade (Table 4A). Adjustment for age, sex, residence, and recent history of raw food intake eliminated the association of the solid lung nodule and the liver lesion with Toxocara grade (Table 4B).
DISCUSSION
Although toxocariasis occurs worldwide, the prevalence of Toxocara seropositivity in the general population varies from country to country.26 In Western countries, toxocariasis is generally regarded as a disease of children who come in contact with soil contaminated with Toxocara eggs.27 However, in Eastern countries, recent studies suggested that toxocariasis may be a food-mediated infectious disease that affects adults who consume raw food.161722
From this study in asymptomatic Korean adults, we identified 3 major findings. First, the prevalence of Toxocara seropositivity was high according to the current cutoff value based on Toxocara ELISA. Second, the history of raw liver intake significantly increased the risk of toxocariasis in a dose-dependent manner. Third, findings suggesting active toxocariasis were more frequently seen in the Toxocara-strong positive group categorized by using the strong positive cutoff value compared to the current cutoff value.
Toxocara-seropositive rates were 51.2% in this study and 57.3% (86 of 150 healthy people) in our previous study.16 Multivariate analysis indicated that old age, male sex, rural residence, and presence of a history of raw liver intake were significantly associated with Toxocara seropositivity. The Toxocaraseropositive rate increased with age. As age increases, people may have more chances to ingest raw food and to have past, current, and recurrent toxocariasis. There was a male preponderance. The reason for this may be the cultural background in Korea where men ingest more raw food than women. The history of raw liver intake was reported to be 59.9% in males vs 17.7% in females. Therefore, this study suggests that old males who live in rural areas with frequent raw-liver eating habits are at higher risk of toxocariasis.
We observed that Toxocara-seroprevalence rates varied from 44.4% to 75.0% according to residential areas. Several researchers reported that Toxocara-seroprevalence rates in the general population in Korea vary from 5.0% to 11.3% as asassessed by using a self-made ELISA kit.232829 This discrepancy may have resulted from differences in diagnostic ELISA kits with different sensitivity and from differences in study populations. Because the definite tissue confirmation of toxocariasis is extremely difficult, toxocariasis is usually diagnosed by measuring IgG antibody to Toxocara, although the currently used cutoff value cannot clearly discriminate the current active infection from remote or past infections.11530 We used commercial ELISA kits from Bordier with a sensitivity of 86% and a specificity of 91%.17 The participants in our study are different from those of other studies in that they visited our hospital voluntarily with main concern about good health. They are usually in a high socioeconomic status that offers more chances to encounter expensive raw food. Cross-reactions with other helminth antigens may be another explanation for the higher prevalence in our study.30 Further studies are necessary to accumulate more evidence to set the cutoff value for Toxocara infection based on ELISA.
Clinically, increased blood eosinophil counts and elevated serum IgE levels, as well as the solid lung nodule with halo on chest CT, suggest active Toxocara infection. These findings were more frequently seen in participants with a strong-positive titer of antibody to Toxocara, implying the association of the activity of Toxocara infection with the titer of IgG antibody to Toxocara. The association between liver lesions and Toxocara seropositivity/Toxocara grade was no longer statistically significant after multivariate adjustment. This may be due to the small number of liver lesions detected in this study. Because Toxocara larvae could migrate to the liver in the early stage of infection, most larvae could be trapped and destroyed within the liver, and toxocariasis of the liver may induce few symptoms. Because our study was conducted on asymptomatic subjects with varying time intervals from raw food intake, liver lesions could have been overlooked. According to animal studies, larvae can reach the liver in 2 days, the lung in 3 days, and the CNS in 7 days after oral ingestion.31 In clinical settings, it is not possible to assess exact time for organ involvement after oral ingestion in human toxocariasis because we cannot determine the exact date of raw food ingestion in individual participants and because serologic tests are performed at different time points after ingestion.
The major strengths of our study include detailed information on many of potential confounders and the use of a relatively large sample size with all participants undergoing general health checkups, including low-dose chest CT. However, our study has several limitations. First, our study participants were recruited from a health promotion center of a tertiary care hospital. There may have been selection bias due to inclusion of relatively wealthy participants with main concern about good health, and thus our participants may not represent the general Korean population. Second, recall biases could have been present in the recall data regarding the participants' history of raw food intake. Third, diagnoses of toxocariasis were made by detecting antibody (sensitivity 86%, specificity 91%) without pathological verification because tissue confirmation is not usually possible in clinical settings. In this study, all individuals underwent stool examination with negative results. However, common parasites other than Toxocara were not assessed by using ELISA, although cross-reactions among helminthic infections may be negligible.32 Therefore, false positivity in ELISA could not be avoided. Moreover, since IgG antibody to Toxocara remains elevated for several months to years following single or repeated infections,3334 the current cutoff value for Toxocara seropositivity may not have indicated active toxocariasis. Finally, this is a cross-sectional study, so it was not possible to examine the relationship between Toxocara seropositivity and associated factors. Prospective studies should be conducted to validate our results.
In summary, the prevalence of toxocariasis in the asymptomatic Korean population was high as assessed with the current cutoff value. Factors associated with Toxocara seropositivity were raw liver intake, serum hyperIgEaemia without peripheral blood eosinophilia, and the solid lung nodule with surrounding halo. When our participants were divided into 3 groups according to the cutoff values based on weak-positive and strong-positive control ODs, the prevalence for peripheral blood eosinophilia with serum hyperIgEaemia and the solid lung nodule with surrounding halo became higher as Toxocara grade increased.
There remain questions as to how active Toxocara infection should be defined and how it can be distinguished from remote or past infections. To estimate the level of exposure and detect early infection, we may use low cutoff values to capture any exposure, even if this exposure does not lead to active toxocariasis. On the other hand, it may be better by using high cutoff values that will be more correlated with higher likelihoods of active toxocariasis. Therefore, further studies are needed to determine a useful cutoff value for current toxocariasis based on Toxocara ELISA.


 XML Download