

 PDF
PDF ePub
ePub Citation
 Print
Print


INTRODUCTION
Chronic rhinosinusitis (CRS) is a common disease that affects 4%-10% of the global population, which is generally defined as an inflammatory condition of paranasal sinuses and nasal passages that persists for a minimum of 12 weeks. According to the presence of visible polyp tissue within the middle meatus, CRS is classified into 2 subgroups: chronic rhinosinusitis without nasal polyps (CRSsNP) and chronic rhinosinusitis with nasal polyps (CRSwNP).1,2 Whereas CRSsNP is considered an inflammatory condition associated with a Th1-immune response, CRSwNP is characterized by a Th2-skewed eosinophilic inflammation.2 CRSwNP reflects a complex interplay between environmental factors (bacteria, viruses, fungi, etc.) and the host response. Infection and atopic response have been suggested to be main factors contributing to the development of CRSwNP.3 Although a number of hypotheses have been proposed regarding the pathogenesis of CRSwNP, precise molecular mechanisms underlying the inflammatory pattern in CRSwNP patients have not yet been completely understood.
The importance of the atopic response in CRSwNP is still controversial. Some authors proposed that atopy may be associated with an enhanced Th2 response and tissue eosinophilia, which has been frequently observed in a Western population.4 However, recently a large subset of CRSwNP patients observed in some east Asian countries (e.g., China, Japan, and Korea) did not demonstrate significant eosinophilia.4,5 In these CRSwNP patients, an enhanced Th1/Th17 response and neutrophilia were commonly observed, which is likely to be associated with nonatopic factors.6,7,8,9,10 We previously reported that only a minor part of polyp samples from western China were IL-5+ and expressed Staphylococcus aureus enterotoxin (SAE)-specific IgE, and showed differences in the colonization of polyps with either predominantly Gram-positive or Gram-negative bacteria in IL-5- versus IL-5+ samples.11 We have also observed differences in inflammatory patterns between CRSwNP patients in the coastal region and central China.12 To further evaluate the effect of atopy on the pathogenesis of CRSwNP in underdeveloped western China, we specially included a cohort of atopic and nonatopic CRSwNP patients in Tibet and Sichuan, and characterized their inflammatory profiles in this study.
MATERIALS AND METHODS
Patient profile
This study was approved by the ethics committee of the People's Hospital of Tibet Autonomous Region and West China Hospital, and all patients gave written informed consent for collection and use of surgically obtained tissues. Seventy CRSwNP patients were enrolled from the Departments of Oto-Rhino-Laryngology of these 2 hospitals during routine endonasal sinus surgery. The diagnosis of CRSwNP was based on history, clinical examination, nasal endoscopy, and computed tomography scan, which was in accordance with the EPOS guidelines.1 This study included CRSwNP patients who had been treated with adequate medical treatment for at least 3 months without a satisfactory results. Exclusions criteria are as follows: CRSwNP patients (1) with immunodeficiencies, cystic fibrosis, bronchiectasis, chronic obstructive pulmonary disease, diabetes mellitus, neoplasia, or fungal rhinosinusitis, (2) during pregnancy or lactation, (3) with upper airway infections within 1 month, and (4) with asthma in acute exacerbation.
The severity of individual nasal symptoms was graded on the visual analog scale (VAS), wherein 0 cm represented 'no complaints whatsoever' and 10 cm represented 'the worst imaginable complaints.' The atopic status of the patients was evaluated by the skin-prick test (SPT) and/or the Unicap system (ThermoFisher Scientific Inc., Uppsala, Sweden) to a panel of aeroallergens (pollens, dust mites, pets, molds, and cockroaches, etc.). The diagnosis of asthma was established by a physician on the basis of disease history and airway responsiveness testing. None of the subjects had used oral or nasal corticosteroids or antibiotics within 4 weeks before surgery. Similarly, inferior turbinate tissues were collected from 26 healthy nonatopic control subjects, presenting for septoplasty due to anatomical variations at the same department.
Samples were processed immediately for the evaluation of specific cytokine/IgE levels and tissue culture. Freshly obtained tissue samples were also snap-frozen in liquid nitrogen and stored at -80℃ until further assessment. Additionally, we estimated complete peripheral blood cell count with differential by automated analysis; the absolute numbers of eosinophils, neutrophils, basophils, and monocytes were calculated.
Assessment of inflammatory cells in nasal tissues
Fresh samples were fixed in formalin (Kelon, Chengdu, China) and embedded in paraffin wax, prior to sectioning at 4- to 5-µm thickness. Cut sections were air-fixed onto microscope glass slides and air-dried overnight at 37℃, followed by deparaffinization, hydration, and staining for specific inflammatory cells or mediators. For the evaluation of eosinophils, air-dried sections were stained with hematoxylin-eosin for 60 minutes at room temperature. Following staining, the sections were washed in 2 changes of acidified water, dehydrated in 3 changes of 100% ethanol, and mounted in Permount TM Mounting Medium (Bioss, Beijing, China), before analysis by light microscopy.
CD4+ (indicating T cells), CD20+ (indicating immature B cells), CD68+ (indicating macrophages), CD138+ (indicating plasma cells or mature B cells), MPO+ (indicating neutrophils), and tryptase+ (indicating mast cells) cells were evaluated by immunohistochemistry. Briefly, air-dried sections were incubated with 1% anti-human CD4 antibody (AF-379-NA, R&D Systems, Minneapolis, MN, USA) or 1% mouse monoclonal antibodies CD20 (clone L26; Dako, Carpinteria, CA, USA), CD68 (clone EBM11; Dako), CD138 (clone MI15; Dako), MPO (clone 2C7; Serotec, Oxford, UK), and mast cell tryptase (clone AA1; Dako), for 45 minutes at 30℃. At the end of the incubation, all samples were washed with Tris-buffered saline (TBS) for 10 minutes and incubated for another 45 minutes at 30℃ with EnVision™ (Dako), using an Autostainer (Dako). The samples were counterstained with Mayer's hematoxylin stain and mounted as above.
All the stained sections were examined by light microscopy at 400× magnification using an Olympus CX-40 microscope (Olympus, Tokyo, Japan), by 2 independent observers blinded to the experimental and clinical data. As described elsewhere,13 the observers evaluated 10 random fields in each section and graded the number of positively stained cells (indicating by brown cells) for individual cell markers on a scale of 0 to 4: 0=no positively-stained cells, 1=<5 positively stained cells/field, 2=6-10 positively stained cells/field, 3=11-20 positively stained cells/field, and 4=>21 positively stained cells/field. The mean of total scores in the 10 fields evaluated for each sample was used as the final score for each sample.
Assessment of mRNA levels of transcription factors
The mRNA levels of the transcription factors GATA-3, T-bet, FOXP3, and RORc were determined by means of real-time PCR as described elsewhere.11 Snap frozen tissue samples were placed in liquid nitrogen and thoroughly ground with a mortar and pestle and homogenized with Lysis Buffer (QIAGEN GmbH, Hilden, Germany). Total RNA was purified using the RNeasy kit (QIAGEN GmbH) following the manufacturer's instructions. A weight of 0.5 µg of total RNA was reverse-transcribed to generate cDNA with the PrimeScript RT Reagent Kit (Takara Biotechnology, Dalian, China) as instructed by the supplier. Then, cDNA equivalent to 40 ng of total RNA was used to perform quantitative PCR. Amplification reactions were performed on an iCycler iQ Real-Time PCR Detection System (BioRad Laboratories, Hercules CA, USA) by using their specific primer sequences. PCRs processed with the SYBR Premix Ex Taq II kit (Takara Biotechnology), and PCR protocol consists of 1 cycle at 95℃ for 10 seconds followed by 40 cycles at 95℃ for 5 seconds and at 60℃ for 45 seconds. The expression of the 3 house keeping genes actin beta, hydroxymethylbilane synthase, and elongation factor 1 was used to normalize transcription and amplification variations among samples after validation with geNorm software (Ghent University, Ghent, Belgium).
The relative expression unit of each gene per 20 ng of cDNA sample was determined by using the qBase program (version 1.3.5; Ghent University), which consists of a collection of Microsoft excel sheets that automatically analyze real-time quantitative PCR data, combining the ΔCT relative quantification model with PCR efficiency correction and multiple reference gene normalization.
Assessment of cytokines and IgE levels in tissue homogenates
As described elsewhere,12 freshly obtained polyp and turbinate tissue specimens were processed and assayed for cytokines and SAE-specific IgE (SAE-IgE) or total IgE (TIgE) levels. Briefly, the samples were homogenized and centrifuged at 3,000 g for 10 minutes at 4℃, the supernatants were stored at -80℃ until analysis. The samples were assayed for IL-1β, sIL-2Rα, IL-5, IL-6, IL-8, IL-17, IL-10, IFN-γ, TNF-α, and TGF-β1 using commercially available Quantikine enzyme-linked immunosorbent assay (ELISA) kits obtained from R&D Systems and MPO using commercially available ELISA kit obtained from Oxis International (Tampa, FL, USA). The levels of ECP, SAE-IgE in tissue, and total IgE in both serum and tissue were measured using the Unicap system. Specific IgE was determined for a mixture of SEA, SEC, and toxic shock syndrome toxin 1, because this mixture was found to be more sensitive and specific than individual enterotoxins (cutoff value=0.1 kU/L); E-meloma antibody was used as the negative control at concentrations of up to 1,000 kU/L.13
Assessment of anti-IgE-induced synthesis of cytokines and PGD2 from cultured polyp tissue
Freshly obtained nasal polyp samples from nonatopic (n=10) and atopic polyp tissues (n=11) were washed and suspended in 10 mL of sterile Roswell Park Memorial Institute 1640 (RPMI 1640) tissue culture medium (Sigma-Aldrich, Bornem, Belgium), supplemented with 2 mM L-glutamine (Invitrogen, Merelbeke, Belgium), antibiotics (50 IU/mL penicillin and 50 mg/mL streptomycin) (Invitrogen) and 0.1% bovine serum albumin (BSA; Sigma-Aldrich). The tissue was cut finely into smaller pieces, and the suspension passed through a fine wire/nylon mesh (pore size, 40 µm) to obtain tissue fragments approximately ≤0.9 mm3 in size. The fragments were weighed and resuspended in fresh culture medium at a concentration of 0.04 g tissue/mL. Prior to preincubation for 1 hour at 37℃ in a 5% CO2/air atmosphere in the presence of 1 µg/mL human myeloma IgE (Calbiochem, VWR International, Leuven, Belgium). At the end of incubation, the tissue fragments were washed 3 times by suspension and sedimentation in fresh culture medium, and resuspended at 0.04 g tissue/mL culture medium. A 0.5 mL aliquot of each suspension was dispensed into a separate well of a 48-well tissue culture plate (BD Falcon, VWR, Leuven, Belgium) and incubated in the absence (negative control) or presence of 10 µg/mL solution of ε-chain-specific anti-human IgE antibody (Dako Belgium N.V., Heverlee, Belgium) for 30 minutes (immediate response) and 24 hours (late response) as described elsewhere.11
At the end of incubation, 500 µL of culture medium were collected from each well and stored at -20℃ until analysis for the cytokines IL-1β, IFN-γ, IL-2, IL-5, IL-8, IL-6, IL-10, and IL-17A, using commercially available ELISA kits as mentioned above. Each sample was also assayed for PGD2 using ELISA kits obtained from Cayman Chemicals (Ann Arbor, MI, USA).
Statistical analysis
All statistical analyses were performed using the SPSS version 12.0 software (SPSS, Inc, Chicago, IL, USA). Data were expressed as box-and-whisker plots and median interquartile range (IQR). Baseline variables were analyzed using a 1-way ANOVA test and Fisher's exact text or the likelihood ratio. The Kruskal-Wallis test was used to assess the significance of intergroup variability using paired comparisons, and the Mann-Whitney U 2-tailed test was used to assess significance for between-group comparisons. P values of less than 0.05 were considered statistically significant.
RESULTS
Patient characteristics of atopic and nonatopic CRSwNP
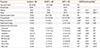
This study enrolled 70 CRSwNP patients with an average age of 35.5±13.4 years. Patients were diagnosed with CRSwNP according to the European position paper on rhinosinusitis and nasal polyps. Patients with different endoscopic scores were included in the study. Comorbid asthma or aspirin intolerance was diagnosed on the basis of patient history. According to the presence of circulating IgE directed against common aeroallergens, the patients were classified as atopic (n=32) or nonatopic subgroups (n=38). The 2 subgroups were similar with regard to demographic characteristics, and both subgroups of CRSwNP shared a significantly higher total symptom score. Only 8 patients had a history of asthma and 3 had a history of aspirin-sensitive disease in the atopic CRSwNP subgroup, whereas nonatopic CRSsNP patients showed a lower symptom score for itchy nose and runny nose (Table 1). The results of blood analysis were listed in Table 2. None of the patients received oral/topical corticosteroids or antibiotics within 4 weeks before surgery.
The distribution of inflammatory cells in atopic and nonatopic CRSwNP
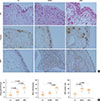
First, we examined the distribution of inflammatory cells (eosinophils, mast cells, neutrophils, etc.) in atopic and nonatopic polyp tissues. As shown in Fig. 1, we observed enhanced infiltration of eosinophils, mast cells, and neutrophils in polyp tissues. Most eosinophils, mast cells, and neutrophils were localized in the lamina propria of polyp tissues. Semiquantitative analysis of histological staining performed by 2 independent observers blinded to clinical data showed significantly more eosinophils and mast cells in atopic CRSwNP than in nonatopic CRSwNP (P<0.05), whereas neutrophils were significantly increased in nonatopic CRSwNP than in atopic CRSwNP (P<0.05).
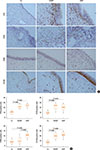
Furthermore, we evaluated the distribution of T cells, B cells, and macrophages in atopic and nonatopic polyp tissues. As shown in Fig. 2, we observed enhanced infiltration of CD4, CD20, CD138, and CD68 in polyp tissues. CD4+ T cells were the most predominant cell population, and CD20+ B cells were the second predominant cell population in polyp tissues, whereas CD138+ plasma cells (mature B cells) and CD68+ macrophage were less frequently observed in polyp tissues. CD4+ T cells were mainly localized subepithelially, whereas CD20+ B cells were extensively distributed in the lamina propria of polyp tissues. Semiquantitative analysis of histological stains performed by 2 independent observers blinded to clinical data showed significantly more macrophages in atopic CRSwNP than in nonatopic CRSwNP (P<0.05). No significant differences in accumulated T cells or B cells in polyp tissues were observed between the atopic and nonatopic CRSwNP patients.
The mRNA levels of the transcription factors GATA-3, T-bet, RORc, and FOXP3 in atopic and nonatopic CRSwNP
Since T cells were the most predominantly observed cell population in polyp tissues, we next examined the mRNA expression of several subtypes of T cell-related transcription factors in polyp tissues and normal controls. As shown in Fig. 3, both T-bet and GATA-3 mRNA levels were significantly increased in polyp tissues compared to normal controls, whereas the FOXP3 mRNA level was significantly decreased in polyp tissues compared to normal controls (P<0.05). No significant differences were observed in RORc mRNA expression in polyp tissues compared to normal controls. Moreover, we found the GATA-3 mRNA level was significantly increased in atopic polyp tissues compared to nonatopic polyp tissues (P<0.05). No significant differences were observed in T-bet, FOXP3, and RORc mRNA expressions between the atopic and nonatopic polyp tissues.
The levels of inflammatory mediators in atopic and nonatopic CRSwNP
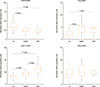
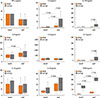
To confirm the aforementioned histological and mRNA data, we next examined the levels of inflammatory mediators in atopic and nonatopic CRSwNP. As shown in Fig. 4, we found the levels of IL-5, IFN-γ, IL-1β, IL-6, IL-8, IL-2sR, and TNF-α were significantly increased in polyp tissues compared to normal controls, whereas the TGF-β1 level was significantly decreased in polyp tissues compared to normal controls (P<0.05). No significant differences were observed in IL-2, IL-10, and IL-17A levels in polyp tissues compared to normal controls. Moreover, we found the levels of IL-5, IL-1β, and TNF-α were significantly increased in atopic polyp tissues compared to nonatopic polyp tissues (P<0.05). No significant differences were observed in IFN-γ, IL-6, IL-8, and IL-2sR levels between the atopic and nonatopic polyp tissues.
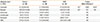
In addition, we examined the levels of TIgE, SIgE, ECP, and MPO in polyp tissues and normal controls. As shown in Fig. 5 and Table 3, we found the levels of TIgE, ECP, and MPO were significantly increased in polyp tissues compared to normal controls (P<0.05). No significant differences were observed in the SAE-IgE level in polyp tissues compared to normal controls. We also found that the levels of TIgE, SAE-IgE, and ECP were significantly increased in atopic polyp tissues compared to nonatopic polyp tissues (P<0.05). However, no significant differences were observed in the MPO level between the atopic and nonatopic polyp tissues.
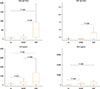
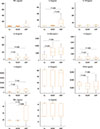
The levels of inflammatory mediators in the supernatant of anti-IgE-stimulated polyp tissues
To test the release of inflammatory mediators in the supernatant of anti-IgE-stimulated polyp tissues, we set up an experimental model to stimulate nonatopic/atopic polyp tissues and control nasal tissues. As shown in Fig. 6, 24 hours after culture in medium alone, the spontaneous release of IL-5, IL-6, and PGD2 was significantly higher in atopic polyp tissues compared to nonatopic polyp tissues (P<0.05). No significant differences in the spontaneous release of IFN-γ, IL-17A, IL-1β, IL-2, IL-8, and IL-10 were observed between the 2 subgroups of polyp tissues. Twenty-four hours after addition of anti-IgE (10 µg/mL), stimulation with anti-IgE significantly increased the production of IL-5, IL-2, IL-10, and IL-17A in both atopic and nonatopic polyp tissues (P<0.05). No significant differences were observed in IFN-γ, IL-6, IL-8, or IL-1β production between the atopic and nonatopic polyp tissues. When the levels of inflammatory mediators were compared between the stimulated atopic and nonatopic subgroups, we found that the levels of IL-5, IL-2, IL-10, IL-17A, and PGD2 were significantly increased in atopic polyp tissues compared to nonatopic polyp tissues (P<0.05). However, no significant differences were observed in IFN-γ, IL-6, IL-8, or IL-1β production between the atopic and nonatopic polyp tissues.
DISCUSSION
In this study, we characterized the inflammatory profile in atopic and nonatopic CRSwNP patients in the 2 specialized regions Sichuan and Tibet located in western China with less industrialization. We observed significant down-regulation of FOXP3 mRNA and TGF-β1 production, as well as significant up-regulation of GATA-3 and T-bet mRNAs, enhanced accumulation of inflammatory cells (eosinophils, neutrophils, mast cells, macrophages, etc.), and elevated cytokine production (IL-5, IFN-γ, IL-1β, IL-6, IL-8, IL-2sR, TNF-α, etc.). More interestingly, in agreement with previous studies,14,15,16 we found that atopic CRSwNP patients were characterized by increased eosinophil accumulation and enhanced eosinophilic inflammation (elevated IL-5, ECP, and total IgE), and significantly increased GATA-3 mRNA level, suggesting nonatopic and atopic CRSwNP patients have distinctly different immunological patterns.
Up to now, the pathophysiology of CRSwNP has not yet been fully understood.16 CRSwNP is recently considered a heterogeneous disorder compromising a spectrum of disease entity. Although CRSwNP has generally been demonstrated to be a Th2-skewed eosinophilic inflammatory condition in the Western population, recent studies shown a Th17-skewed neutrophilic inflammatory condition in some CRSwNP patients in Asian countries (China, Japan, and Korea),6,7,8,9,10 indicating a regional difference in the pathogenesis of CRSwNP. Moreover, the inflammatory patterns of CRSwNP vary not only among different countries but also among different locations in the same countries.11 Sichuan and Tibet are located in the underdeveloped western China with less industrialization and at a lower economic level. Previously, we have observed differences in inflammatory patterns between the coastal region and central China,11,12,18 and suggested that this difference in inflammatory patterns may be linked to differences in the bacterial infection of the airways. Interestingly, we observed T-bet, a key transcription factor for Th1 differentiation, is elevated in both atopic and nonatopic polyps, suggesting specifically enhanced adaptive immunity against bacterial infection in this cohort. In this study, we focused the role of atopy in addition to bacterial infection in the pathogenesis of CRSwNP in the underdeveloped region in western China. As a result, we found GATA-3 was significantly increased in atopic nasal polyps compared to the nonatopic counterparts. It is well known that GATA-3 is a key transcription factor controlling Th2 differentiation and Th2 cytokine production. IL-4 plays an important role in the initiation of Th2 inflammatory responses and IgE production. IL-5 is pivotal for the recruitment and survival of eosinophils. Thus, increased GATA-3 and IL-5 in atopic nasal polyps may provide a plausible explanation for how atopy promotes local IgE production and tissue eosinophilia.
The role of atopy in the pathogenesis and symptom expression of CRSwNP has been discussed for many years, yet observations regarding the potential role of allergy as a causative factor in CRSwNP and CRSsNP have been controversial.19 More than 50% of individuals with AR have clinical or radiographical evidence of CRSwNP, and conversely 25%-58% of individuals with CRSwNP have aeroallergen sensitization.20 Taken together, these studies support the concept that CRSwNP could be an atopic disease driven by IgE sensitization to aeroallergens. However, mechanisms by which aeroallergens produce CRSwNP are not inherently obvious, and the presence of allergy in CRSwNP patients may merely reflect the coincidental occurrence of 2 relatively common clinical conditions. On the other hand, several studies have shown that atopic and nonatopic CRSwNP patients possess different inflammatory mechanisms. For example, Hamilos et al.14 reported that atopic and nonatopic CRSwNP subgroups show distinct cytokine profiles with the most distinguishing cytokines of the atopic subgroup being IL-4 and IL-5 and that of the nonatopic subgroup being IFN-γ. Recently, Peric et al.15 reported that atopy does not modify the symptoms or the endoscopic/CT findings of CRSwNP, but they found significantly enhanced eosinophilia and higher concentrations of IL-4, IL-5, and IL-6 in nasal secretions of atopic CRSwNP patients than in those of nonatopic patietns. Scavuzzo et al.16 also found that atopic CRSwNP patients show significantly higher concentrations of total IgE and IL-8 than nonatopic CRSwNP patients. Consistent with the above-mentioned findings, we found significantly enhanced tissue eosinophilia, GATA-3 mRNA expression, and elevated IL-5, ECP, and total IgE in atopic CRSwNP patients compared to nonatopic CRSwNP patients in this Chinese cohort, showing an eosinophilic inflammation pattern in the atopic CRSwNP population. These findings suggest that atopy still remains the major factor for the etiology of CRSwNP and show the different levels of eosinophilic inflammatory mediators (IL-5, ECP, and total IgE) between atopic and non-atopic patients in western China.
Although correlative data are strong and suggest an important role of atopy in the pathogenesis of CRSwNP, this association must be further evaluated and clarified. Recent studies showed that local IgE production may play a critical role in driving inflammation in atopic CRSwNP patients with enhanced tissue eosinophila.21 For example, Bachert et al.22 reported that total and antigen-specific IgEs in polyp tissues are related to local eosinophilic inflammation in the Western population, irrespective of systemic allergen sensitization (atopy). These findings were further confirmed by Matsuwaki et al.23 in Japanese CRSwNP patients. In this study, we found that the levels of TIgE, SAE-IgE, and ECP were significantly increased in atopic polyp tissues compared to nonatopic polyp tissues, which is somewhat different from results of Bachert et al.22 indicating that there are significant associations between increased levels of total IgE, specific IgE, and eosinophilic inflammation in polyp tissues, which may be related to the pathophysiology of CRSwNP.
Recently, several studies provided the evidence for local class switching to IgE, production of IgE, and IgE localization to the surface of mast cells in CRSwNP in Chinese and Japanese populations.24,25 More interestingly, Cao et al.25 showed that local IgE induced by common aeroallergens may mediate mast cell activation and contribute to subsequent eosinophilic inflammation in Chinese CRSwNP. To further investigate whether and how local IgE production severs as an important predicator of atopic, eosinophilic inflammation, we test the release of inflammatory mediators in the supernatant of anti-IgE-stimulated polyp tissues by establishing a stimulation model. As expected, we found that stimulation with anti-IgE significantly increases the production of IL-5, IL-2, IL-10, and IL-17A in both atopic and nonatopic polyp tissues and that the levels of IL-5, IL-2, IL-10, IL-17A, and PGD2 are significantly increased in atopic polyp tissues compared to nonatopic polyp tissues. These findings provide a plausible explanation for IgE-mediated inflammatory responses in polyp tissues upon exposure to aeroallergens and offer the rationale for developing intervention strategies for atopic CRSwNP by targeting IgE-mediated inflammatory responses. Our data indicate that atopy may play a role in the pathogenesis of CRSwNP, putatively by enhancing local IgE production, eosinophil recruitment, and Th2-skewed response.
In summary, we confirmed that atopic and nonatopic CRSwNP patients possessed the differential patterns of inflammatory response in polyp tissues and showed the evidence that the levels of key cytokines are more significantly increased in atopic polyp tissues compared to nonatopic polyp tissues in response to anti-IgE stimulation. These findings offer the rationale for developing intervention strategies by targeting eosinophilic inflammatory responses in atopic CRSwNP.

 XML Download