

 PDF
PDF ePub
ePub Citation
 Print
Print


INTRODUCTION
Allergic rhinitis (AR) is a chronic upper airway disease of increasing prevalence and remains an important healthcare problem. The condition can have a major detrimental impact on quality-of-life and social productivity.1 Clinical practice guidelines for the management of AR recommend clear goals, including the prevention of allergy, reduction in allergen exposure, and effective pharmacological treatment.2
Based on Allergic Rhinitis and its Impact on Asthma (ARIA) guidelines revised in 2010 for pharmacological treatment, intranasal glucocorticosteroids (INCSs) are strongly recommended for the treatment of adults with AR on the basis of reliable evidence. However, only conditional recommendations exist for its use in preference to oral H1-antihistamines (OAHs) for both seasonal AR (SAR) and perennial AR (PAR) on the basis of low- to moderate-quality evidence. ARIA guidelines also emphasize the need to respect patient preferences.2 ARIA guidelines do not recommend a combination of INCSs and OAHs for the treatment of AR, although such combinations are often prescribed in clinical practice.
Ciclesonide is a corticosteroid agent normally administered as an aqueous nasal spray and has been validated as providing therapeutic relief for AR.3,4 Ciclesonide is a prodrug that is enzymatically hydrolyzed to its pharmacologically active metabolite, C21-desisobutyryl-CIC, with an associated 100-fold higher corticosteroid receptor-binding affinity than that of the inactive parent compound.5,6 Ciclesonide was approved by the U.S. Food and Drug Administration (U.S. FDA) for the treatment of SAR and PAR in 2006.7
Although a series of studies comparing the efficacy of intranasal spray to that of OAH have shown modest benefits for INCS, the quality of evidence to date has not been strong enough to justify a definitive recommendation of INCSs over OAHs according to ARIA guidelines.8 In the current study, we thus aimed to comparatively assess the efficacy and safety of ciclesonide nasal spray monotherapy to that of levocetirizine monotherapy as well as combination treatment in patients with AR.
MATERIALS AND METHODS
Patients
We recruited subjects aged≥18 years, who had exhibited signs and symptoms of AR for longer than 1 year. In accordance with ARIA guidelines, only subjects with moderate to severe SAR or PAR were included. All subjects tested were positive for skin allergy tests (skin prick test) or serological allergy tests, including for multiple allergen simultaneous tests (MAST), to 1 or more specified allergens less than 1 year prior to screening. The administration of drugs for AR before the screening visit and during the wash-out period of 1 to 3 weeks was not permitted. Subjects were required to write diaries recording self-assessments of their AR symptoms. Subjects were also required to have a mean reflective total nasal symptom score (rTNSS) ≥6 for 4 days or longer during the week prior to the baseline visit or a mean rTNSS ≥6 for 7 days prior to the baseline visit.
Subjects with active asthma requiring treatment with inhaled or systemic corticosteroids and/or routine use of beta-agonists or any other medications were excluded. Additional exclusion criteria were: nasal pathologies, including nasal polyps or bronchial anomalies; chronic obstructive pulmonary disease; clinically significant renal disease (serum creatinine levels greater than 1.5 mg/dL for men or 1.4 mg/dL for women), liver disease (ALT or AST >[3X UNL]) within 2 months before the screening visit; intranasal biopsy revealing ulcers, trauma, surgery, atrophic rhinitis or drug-derived rhinitis within 2 months before screening; respiratory infections within 2 weeks before or during screening; usage of systemic steroids within 2 months of screening or local steroids (hydrocortisone >1%) within 4 weeks of screening or antibiotic treatment within 2 weeks of screening; a possibility of receiving medications like systemic corticosteroids or high-dose steroids, beta-agonists or other investigational drugs that were not permitted in the protocol during the study period; known or suspected hypersensitivity to ciclesonide or hydroxyzine; and genetic disorders such as galactose intolerance, Lapp lactase deficiency or glucose-galactose malabsorption.
Study design and treatment
This was an open-label, 3-arm, parallel-group randomized study (NCT01430260). Subjects were randomly assigned to the following 4 groups: (1) the study group receiving 200 µg ciclesonide (Omnaris®, Nycomed GmbH, Singen, Germany) nasal spray (cidesonide group, n=88) and the control groups receiving 5 mg levocetirizine (Xyzal®, UCB Farchim SA, Bulle, Switzerland) (levocetrizine group, n=89) or 200 µg ciclesonide nasal spray +5 mg levocetirizine at a ratio of 1:1:1 (combination treatment group, n=83). Randomization was achieved through the application of a block randomization method at each study center (2 block sizes were combined for randomization), with random numbers generated using the SAS® Software Package. Subjects who were eligible for participation in the study received a randomly-generated number (4 digits) in accordance with the study enrollment order. The study investigators prescribed the investigational products in accordance with the randomization, and study pharmacists distributed the investigational products using identical randomization methods.
In the study group, 200 µg ciclesonide nasal spray was administered once daily in the mornings. The control groups received either 5 mg levocetirizine once daily in the morning, or 200 µg ciclesonide nasal spray in combination with 5 mg levocetirizine taken orally once daily in the morning. Subject dropout rates were determined by the investigators via interviews with subjects and via the investigators' judgment upon each visit. The subjects were required to visit the trial site a total of 3 times during the 3-5 weeks of the study.
Efficacy assessments
The primary endpoint was the change from baseline in the mean value of patient-reported rTNSS (morning and evening) averaged over the 2-week treatment period. Patient diaries were used to record rTNSS by evaluating symptom severity over the 12 hours prior to the recording of the score. The rTNSS was calculated as the sum of 4 nasal symptoms: rhinorrhea, nasal itching, nasal congestion, and sneezing, each of which was rated on a scale of 0 (no signs/symptoms evident) to 3 (signs/symptoms causing significant discomfort that interfered with daily activities) for the full analysis set (FAS) population.
Major secondary endpoints were efficacy parameters involving changes in reflective total ocular symptom score (rTOSS), each item of the rTNSS, physician-assessed overall nasal signs and symptoms severity (PANS) and the rhinoconjunctivitis quality-of-life questionnaire (RQLQ) with standardized activities, compared between values at baseline and over the 2-week treatment period. The rTOSS was calculated as the sum of 3 ocular symptoms: itchy eyes, red eyes, and watery eyes, each rated on a scale of 0 (no signs/symptoms evident) to 3 (signs/symptoms causing significant discomfort that interfered with daily activities). PANS values were obtained from the investigators' assessments of nasal signs (discoloration, swelling, discharge and postnasal drip) and symptoms (rhinorrhea, itching, nasal congestion and sneezing). RQLQ was obtained via patient self-assessment of the 28 listed items.
Safety assessment
The frequency and percentage of adverse events (AEs), as well as serious AEs and those that caused dropouts were analyzed for correlations with treatment types, body organs affected, and preferred terms. Vital signs were analyzed using descriptive statistics for differences in data obtained at the baseline and termination visits among the treatment groups. A comparative physical examination assessment was conducted using data from the baseline and the termination visits, which was summarized for each subject. In particular, subjects who were assessed to be normal at the baseline visit, but abnormal at the termination visit were carefully reviewed for fulfillment of AE criteria.
Statistical methods
The FAS population was used for analysis of all efficacy endpoints. Subjects who did not receive the investigational products after randomization or did not undergo scheduled efficacy assessments at baseline or thereafter were excluded from further analysis. The Safety Analysis Set consisted of all subjects who received the investigational products at least once after study enrollment.
For a comparative assessment of the efficacy of: 1) 200 µg ciclesonide nasal spray administered alone once daily, 2) levocetirizine administered alone at a dose of 5 mg once daily, and 3) ciclesonide nasal spray in combination with levocetirizine in patients with AR, a number of statistical methods were employed.
The null and alternative hypotheses (H0 and H1, respectively) for this study aimed to assess statistical significance for mean of the population for change from baseline in rTNSS. The letter µ was used to denote the mean value of a given population. The study's hypotheses were as follows:
H0: µ ciclesonide=µ levocetirizine=µ ciclesonide+levocetirizine
H1: The 3 population means are not equal.
In order to assess these hypotheses, statistical analysis was undertaken in 2 parts. First, Analysis of Variance (ANOVA) was conducted to compare the change between the 3 groups in mean rTNSS in the mornings and evenings before and after treatment. Second, rejection of the null hypothesis was followed up with multiple comparison analyses using Fisher's Least Significant Difference (LSD).
The same methods were employed to compare the secondary efficacy endpoints of changes in rTOSS, each item of the rTNSS, PANS, and RQLQ. Exploratory analysis for the correlation of rTNSS and PANS was conducted using Pearson's correlation analysis.
A detailed description of the statistical method was provided in the statistical analysis plan. The criterion for statistical significance was P<0.05. Continuous data outputs are presented using descriptive statistics (subject number, mean, standard deviation, minimum, median, maximum, and quartiles), while categorical data are presented using frequency and percentage. Where applicable, a 95% confidence interval is presented.
RESULTS
Patient disposition and baseline characteristics
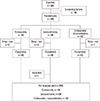
A total of 349 patients were screened for study participation. Of these 349 patients, 260 (74.5%) were randomized to the study group (ciclesonide group, n=88) and the control groups receiving, levocetirizine (levocetrizine group, n=89) or ciclesonide combined with levocetirizine (combination treatment group, n=83) (Fig. 1).
Two subjects were excluded from efficacy analysis but included for safety analysis. Of these 2 patients, one from the combination treatment group dropped out of the study due to absence in the follow-up period; the other from the levocetirizine group was unable to locate their patient diary. Patient diaries were the source data that carried all relevant information; if there was no patient diary, then there was no efficacy data either.
Another patient from the levocetirizine group experienced a randomization error and was inadvertently dosed with ciclesonide. This subject's data were analyzed as belonging to the levocetirizine group when assessing efficacy, but as the ciclesonide group when assessing safety.
A total of 13 study sites were used, and the number of study patients ranged from 12 to 32 per site.
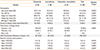
Demographic and other baseline characteristics were similar in all treatment groups, while the distribution of seasonal and perennial AR was at a 3:7 ratio. Mean baseline rTNSS, rTOSS, PANS, and RQLQ scores were similar across the 3 treatment groups (Table 1).
Efficacy
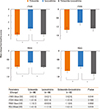
The efficacy analysis was performed using the FAS with a total of 258 patients. After 2 weeks of treatment, the ciclesonide group showed significantly improved rTNSS, PANS, and RQLQ in comparison to the levocetirizine group (Fig. 2). A similar degree of improvement was seen in the combination treatment group (Fig. 2). Values of rTOSS scores improved from the baseline in the ciclesonide group, but no superiority over the levocetirizine group was observed. For all efficacy parameters, levocetirizine did not provide any additional benefit when given in combination with ciclesonide, compared to ciclesonide alone.
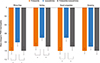
In comparison to the change in mean individual symptoms, the mean rTNSS for rhinorrhea, itching, and nasal congestion were decreased significantly in the ciclesonide group compared to the levocetirizine group (P=0.0388, P=0.0429, and P=0.0202 respectively). Differences in the sneezing score were not observed as a result of any of the treatments (P=0.4014, Fig. 3).
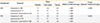
Subgroup analysis of SAR and PAR revealed a greater improvement in rTNSS in the ciclesonide and combination treatment groups than in the levocetirizine group for both types. However, decreases in the mean rTNSS values varied with AR types (Table 2).
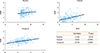
PANS was well correlated with rTNSS for baseline and termination visits and the percent change from baseline over 2 weeks (Fig. 4).
Safety
The durations of drug exposure were 15.9, 16.1, and 16.0 days for the ciclesonide, levocetirizine, and combination treatment groups, respectively. Mean drug compliance for the ciclesonide, levocetirizine, and combination treatment groups were 97.7%, 91.7%, and 93.4%, respectively. Drug compliance was relatively higher for ciclesonide than for levocetirizine (P<0.0001, data not shown).
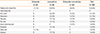
Safety analysis was performed on 260 subjects (89 in the ciclesonide group, 88 in the levocetirizine group, and 83 in the combination treatment group). The overall incidence of treatment-emergent AEs (TEAEs) was low and comparable between the treatment groups. A total of 32 (12.3%) patients reported 45 TEAEs with 11 (12.4%) patients in the ciclesonide group, 12 (13.6%) patients in the levocetirizine group, and 9 (10.8%) patients in the combination treatment group. Four nasal AEs, which could not be ruled out as TEAEs, were reported in the ciclesonide group (1 nasal pain), the levocetirizine group (1 epistaxis, 1 dry nose), and the combination treatment group (1 dry nose). No serious AEs were reported in any treatment group for the duration of the study (Table 3).
DISCUSSION
The efficacy and safety of ciclesonide intranasal spray for 2-52 weeks has previously been evaluated in 4 Phase III, randomized, placebo-controlled trials in adults and children with SAR and PAR.7,8,9,10 Here, we report the results of our Phase IV open-label randomized study evaluating the efficacy and safety of intranasal ciclesonide monotherapy in comparison to oral levocetirizine monotherapy and levocetirizine in combination with ciclesonide. Ciclesonide monotherapy caused statistically significant improvements in rTNSS, PANS, and RQLQ over levocetirizine monotherapy. Significant improvements were also seen in patients who had nasal symptoms, including runny nose, itchy nose, and congestion. Ciclesonide combined with levocetirizine treatment also resulted in better treatment results over levocetirizine monotherapy as assessed by rTNSS, PANS and RQLQ, but no additional benefits were observed as a result of the addition of the OAH. TEAEs were observed with low frequency and not significantly different among the 3 study groups.
This is the first randomized study conducted with a large population of moderate to severe AR patients in order to demonstrate the superior efficacy and comparable safety of ciclesonide over levocetirizine. Although ARIA guidelines recommend INCSs over OAHs for both adult SAR and PAR, it has remained a conditional recommendation based on low-quality evidence for SAR and evidence of moderate quality for PAR.2 The existence of conditional ARIA recommendations underlines the need for better clinical decision aids based on high-quality evidence.
The GRADE approach summarizes randomized trials in terms of their quality of evidence, with increasing quality associated with strong effects, dose-response relationships, and minimal confounding factors. It also penalizes study designs with inherent risks, inconsistencies, indirectness, imprecision, and publication bias.2 Our study design involved a randomized trial with substantial sample sizes in all 3 groups, although it was open-label. This study can be classified as having a moderate quality according to the GRADE approach. Benninger et al.11 conducted a comprehensive meta-analysis of 54 randomized trials involving more than 14,000 patients and reported that INCSs produce the greatest improvements over other pharmacological treatments, including OAHs for SAR. In addition, it is concluded that INCSs are effective for the treatment of PAR, although OAHs may be equally effective for some patients.12 Nevertheless, current ARIA guidelines conditionally recommend INCSs versus OAHs because INCS treatment has low- to moderate-quality evidence. Our study fulfills the definition of moderate quality for AR studies, including SAR and PAR. In our study, the addition of levocetirizine to ciclesonide did not result in further benefits over ciclesonide monotherapy, although the combination treatment did demonstrate an improvement of AR parameters over those of levocetirizine alone. To date, evidence has not been provided to support the contention that a combination of INCSs and OAHs is better than INCS treatment alone.12
Chung et al.13 reported more than 60% of patients with SAR showed persistent symptoms, while 33% of patients with PAR had intermittent symptoms, suggesting a lack of association between the SAR/PAR/PAR+SAR classification and the ARIA classification for the Korean population, as discussed in previous reports.14,15 The current study has shown that ciclesonide treatment provides greater improvement of nasal symptoms over levocetirizine treatment and that rTNSS and PANS scores at baseline and termination visits were very closely correlated, as were changes in rTNSS and PANS scores after treatment. Moreover, rTNSS is currently the most preferred tool for measuring the control of AR nasal symptoms in subject self-assessment reports during clinical trials.11 These reports focused on patients' subjective symptoms. Our results also support the notion that PANS is an effective tool to support or replace rTNSS in clinical trials and medical practice, especially for patients with poor compliance in self-assessment. Further studies are required to validate this notion.
We acknowledge limitations to our study. First, the treatment protocol involved a relatively short duration of 14 days, especially for PAR. Some studies with INCSs have included treatment durations of up to 5-6 weeks, revealing important data, such as reductions in treatment effects that arise after an extended period of time. However, these studies were conducted on SAR patients, with seasonal pollen counts also decreasing over the duration of the study. Second, this study has used several tools to measure disease severity, including rTNSS, rTOSS, PANS, and RQLQ, rather than tools to show treatment effect. Although most clinical studies evaluating pharmacological treatment effects in AR have utilized disease severity assessment tools, recent review articles recommend the use of more comprehensive assessment tools, such as Control of Allergic Rhinitis and Asthma Test (CARAT), Radioallergosorbent Test (RAST), Allergic Rhinitis Control Test (ARCT), and State of the Impact of Allergic Rhinitis on Asthma Control (SACRA). This is because treatment effects are more accurately assessed using tools for disease control rather than those designed to assess disease severity. 16,17 However, we believe that the multiple disease severity tools we employed are sufficiently balanced to objectively reflect the effects of treatment. In addition, rTNSS still remains one of the standard parameters requested by the FDA.
In conclusion, we report that INCS ciclesonide spray was more effective in reducing the nasal symptoms of AR than the OAH levocetirizine for the treatment of moderate to severe AR in adult subjects. A combination of levocetirizine and ciclesonide did not provide additional benefits to ciclesonide monotherapy. Additional studies of longer duration may provide further insights into the long-term effects of treatment.
 XML Download