

 PDF
PDF ePub
ePub Citation
 Print
Print


INTRODUCTION
Although the prevalence of allergic rhinitis (AR) has increased over the past few decades, the majority of the epidemiological surveys have been conducted mainly in Europe and North America, and to a lesser extent in the developed Asian countries such as, Japan, Korea, and Singapore. These surveys have demonstrated that there is considerable variation in the prevalence of AR in these regions and ranges from 11.8% to 46%.1,2 By comparison, there are fewer published data on the prevalence of AR in other developing countries around the world.3
Presently, data from only a few surveys are available on the prevalence of AR in Mainland China, which is undergoing a rapid economic and cultural development. In 1998, the International Study on Asthma and Allergy in Childhood (ISAAC) revealed that the prevalence of allergic rhinoconjunctivitis symptoms and other allergic symptoms among children aged 13-14 years in 5 major cities (Beijing, Chongqing, Guangzhou, Shanghai, and Urumqi) varied from 5% to 10%, which was lower than those in the USA and Europe, as well as in Hong Kong with a prevalence of 24%.4 A population-based, cross-sectional study employing validated questionnaires-based telephone interviews in over 38,000 adults in 11 major cities on Mainland China has recently reported that the age-and gender-adjusted self-reported prevalence of AR was highly variable across the cities and ranged from the lowest prevalence of 8.7% in Beijing in east China to the highest prevalence of 24.1% in Urumqi in west China.5 However, another study in 3-6 years old children in Wuhan city in central China has suggested that use of only questionnaires may lead to overestimation of the true prevalence of AR.6 We reported that the prevalence of AR in these children based on only a diagnostic criterion of nasal symptoms was 27.1%, whereas the adjusted prevalence based on both the diagnostic criterion of nasal symptoms and positive skin prick test (SPT) results was 10.8%. Indeed, an earlier review of several population-based studies has shown that the proportion of rhinitis cases attributable to atopy was lower than the overall proportion of rhinitis cases identified in these studies, suggesting that inclusion of IgE-mediated tests is likely to provide a more accurate estimate of prevalence than epidemiological data alone.7
The prevalence of AR has not yet been investigated in urban and rural areas in China. Because the majority of the population (about 800 millions) of Mainland China live in rural areas, where the overall lifestyle, socioeconomic status and education are much different from urban areas, the purpose of the present study was primarily to compare the prevalence of AR between urban and rural areas estimated on the basis of data obtained using a combination of validated questionnaires and SPTs.
MATERIALS AND METHODS
Study sites
There are 6,262 villages in the rural area of Baoding and 2,657 communities in the urban area of Beijing according to national census data files. In order to obtain a representative sample, 1 community, called Fang Zhuang, in the urban region of Beijing and one village, named Xin Zhuang, in the rural region of Baoding were randomly recruited for the present study using the random number table. Both regions are located in Hebei province in China; with Baoding being located about 140 km to the southwest of Beijing, and at same altitude and with similar climatic conditions as Beijing. Although traditions and customs are similar in Beijing and Baoding, the level of economic development and urbanization is much lower in Baoding than in Beijing. In particular, the per capita gross national product (Per Capita GNP) of Baoding, well-known for agriculture and tourism, reached US$ 2,090 in 2008, whereas for Beijing, a commercial, industrial, and administrative center of China, the Per Capita GNP was US$ 9,075 in the same year. Although 31.76% and 83.6% of Baoding and Beijing, respectively, are urbanized, all the subjects investigated from Baoding were living in a rural area.
Study design
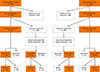
This was a population-based cross-sectional survey, carried out from April 2008 to August 2008 in 2 phases. In the first phase, a questionnaire was completed during a face-to-face interview by consenting adult residents in the 2 study areas. In the second phase, equal sets of randomly selected self-reporting AR-positive and AR-negative subjects who had completed the questionnaire from each study area were invited to visit a local testing center and undergo SPTs using a panel of standardized allergens. The study protocol (shown in Figure) was approved by the Ethics Review Committee of Beijing Institute of Otolaryngology and written informed consent was obtained from each participant prior to entry into the study.
Face-to-face interview
Face-to-face interviews were conducted by 10 specifically trained interviewers, either during the weekday from 17:30 to 21:00 or during the weekend from 9:00 to 22:00. All participants were enrolled from the population register of the local government. We interviewed only permanent residents aged ≥18 years old, who lived continuously in the rural or urban study areas for over 1 year and at the same time had their household cards in the care of the local public security bureau. Face to face interviews were conducted in the community service center in Fang Zhuang or in the village committee office in Xin Zhuang, and only subjects who could complete the face-to-face questionnaire by themselves were considered eligible for entry into the study.
Questionnaire design
The study questionnaire-comprising 15 questions regarding nasal symptoms, duration and severity, self-reported allergens, self-reported diagnoses of concomitant allergic diseases (including chronic sinusitis, asthma and atopic dermatitis), and family history of allergic disease-was derived from the well-documented and validated questionnaires employed in the ISAAC and the European Community Respiratory Health Survey (ECRHS) studies as we have previously described.9
The criteria used to diagnose AR from the questionnaires were consistent with those of the ARIA, and subjects were classified positive if they had typical symptoms, such as sneezing, runny, blocked, or itchy nose within the last 12 months, unrelated to suffering from upper respiratory infections.5 AR subjects were further classified into intermittent or persistent subtypes based on the self-reported duration of symptoms. Intermittent AR was defined as AR with nasal symptoms lasting less than 4 days/week or less than 4 weeks/year, whereas persistent AR was defined as AR with nasal symptoms lasting more than 4 days/week and more than 4 weeks within the last 12 months. Similarly, the severity of AR was classified as mild or moderate-severe on the basis of symptoms as well as the quality of life of the subject. Mild AR was defined as AR with normal sleep, no impairment of daily activities, sport, or leisure, normal work and school, and no troublesome symptoms. Moderate-severe AR was defined as AR with 1 or more items of abnormal sleep, impairment of daily activities, sport or leisure, abnormal work and school, and troublesome symptoms.8
SPTs
Prior to testing, all eligible participants were instructed to abstain from taking any antihistamines for at least 72 hours before the examination. SPTs were performed using the Allergopharma (Allergopharma, Reinbeck, Germany) employing a panel of 20 standardized allergen extracts (100,000 BU for Phazet and 10 HEP for Soluprick) that were used regularly in our department. The panel comprised extracts of mixed animal hair, trees (Tree I, Tree II, pine and Locust black), weeds (humulus, chenopodium album, mugwort, ragweed, and English plantain), cereals, dandelion, Blattella Germanica, mites (Dermatophagoides pteronyssinus and Dermatophagoides farinae), and fungi (Curvularia lunata, Candida albicans, Penicillium notatum, Alternaria tenuis, and Aspergillus fumigatus). Histamine (10 mg/mL) and saline were used as positive and negative controls, respectively.
The skin reaction to each allergen was observed after 15 minutes and the size of the reaction was evaluated by tracing and measuring the perimeter of the wheal developed in response to any specific allergen. The largest and smallest diameters (at the widest point and at the midpoint at perpendicular to it, respectively) of each wheal were measured and calculated as the mean wheal diameter. SPT reactivity was graded as the allergen: histamine wheal ratio (AHWR), as described by Aas & Belin.9 A positive skin reaction to allergens was defined as an AHWR >0.5.
Confirmable prevalence of AR
Confirmable AR in the 2 study areas was defined as positivity of both the self-reported AR and SPT to at least 1 aeroallergen. As only a proportion of the subjects among the urban or rural population agreed to undergo SPTs, it was not possible to directly calculate the positive rates of SPTs in total population. Thus, the confirmable prevalence of AR in the population was calculated by multiplying self-reported prevalence by the percentage of subjects with positive SPTs in self-reported AR populations.
Statistical analysis
All data were assessed by 2 independent investigators, using SPSS 11.5 for Windows (SPSS Inc., Chicago, IL, USA) Statistical Package for Social Sciences. The t and χ2 and t tests was used to assess the target population characteristics and any difference in the prevalence of AR between the 2 areas. Multivariate logistic regression was performed using the Enter method, a stepwise regression model, to assess the relationship of AR with the potential risk factors, such as area, age, gender, yearly income, and educational level. Subjects with missing values were excluded from the regression model. All tests were based on 2-tailed tests using a significance level of P<0.05.
RESULTS
Sociodemographic characteristics
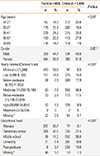
Among 1,732 adult residents in the rural area, 674 were migrant workers or students and therefore not considered permanent residents. Thus, a total of 1,058 eligible residents were interviewed face-to-face, and 803 (75.9%) of these individuals completed the study questionnaires. Similarly, 1,840 permanent adult residents in the urban community attended the face-to-face interview, of whom 1,499 (81.5%) completed the AR study questionnaires. Table 1 shows the sociodemographic characteristics of the 2 studygroups and indicated that both groups were significantly different with regard to age (mean age=41.4 years for the rural group vs 40.7 years for the urban group) and gender (female=55.3% in the rural group vs 51.0% in the urban group).
The individual household income per year, calculated in Chinese Yuan (CNY), for the urban and rural dwellers was classified according 1 of the 7 scales: minimum (<5,946 CNY), low (5,946-8,103 CNY), below-moderate (8,103-11,052 CNY), moderate (11,052-15,199 CNY), above-moderate (15,199-20,699 CNY), high (20,699-34,834 CNY), and maximum income (>34,834 CNY) as recommended by "The 2008 Statistics Yearbook in China" published by National Bureau of Statistics of China. Most of the rural respondents belonged to minimum income household (473 subjects; 58.9%) and low income (151 subjects; 18.8%) households, whereas the majority of the urban respondents belonged to moderate (553 subjects; 36.9%) and below moderate (269 subjects; 17.9%) households. Similarly, data on the education background of the interviewees was classified as illiteracy, elementary school, middle school, university, and post-graduate. While under 50% of the rural respondents (365 subjects, 45.5%) were educated only to the elementary school level and around one-third (287 subjects; 35.7%) were illiterate, over 70% of the urban respondents (1,067 subjectssubjects, 71.2%) were educated to the middle school level or above (Table 1). The overall mean annual salary and education in the 2 areas were significantly different between the rural and urban subjects (P<0.01 for each) (Table 1).
Prevalence of self-reported AR and potential risk factors
Overall, 153 subjects (19.1%, SE=0.0139) were self-reported AR patients in 803 rural participants. After adjustment for the age and gender structure of the population, the age-adjusted prevalence of self-reported AR was 19.1%, and gender-adjusted prevalence was 18.9%. Among the 1,499 urban respondents, 203 (13.5%, SE=0.0088) reported AR. Both the age-and gender-adjusted prevalence of self-reported AR were still 13.5%. Ninety of these 153 rural subjects (58.8%) were shown to be intermittent AR suffers, and 63 (41.2%) persistent AR sufferers. Additionally, 87 (56.9%) of the 153 subjects were shown to suffer from moderate/severe AR (Table 2). A total of 119 of the 203 urban subjects (58.6%) were diagnosed with intermittent AR sufferers and 84 (41.4%) persistent AR sufferers. Overall, 102 (50.2%) of these 203 were moderate/severe AR suffers (Table 2). A comparison of self-reported AR prevalence between the rural and urban areas indicated the prevalence to be significantly higher in the rural area.
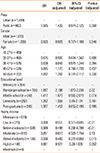
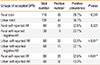
Multivariate logistic regression analysis of potential risk factors for AR in the 2 areas further showed that the educational level of elementary school increased the risk of having AR (OR=1.557, adjusted OR=2.198, 95% CI=1.072-2.236), but there was no significant association between AR and higher educational levels, such as middle school, university, and postgraduate. In contrast, low, below-moderate, and above-moderate yearly incomes significantly decreased the risk for AR (OR=0.608, adjusted OR=0.551, 95% CI=0.377-0.805; OR=0.589, adjusted OR=0.495, 95% CI=0.306-0.799; OR=0.598, adjusted OR=0.489, 95% CI=0.275-0.868, respectively) compared to minimum yearly income. Moderate and high yearly income neither increased nor decreased the risk for AR (Table 3).
Self-reported symptoms, allergens and treatment
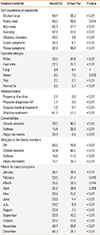
In the self-reported AR subjects from the rural area, sneezing was the most commonly reported AR symptom (57.7%), followed by blocked nose (54.1%), runny nose (50.0%), itchy nose (42.7%), ocular symptoms (36.8%), and throat symptoms (32.3%). Self-awareness of olfactory disorders (20.0%) was less common. In contrast, in the self-reported AR subjects from the urban area, runny nose was the most commonly reported symptom (55.5%) and olfactory disorders (3.6%) the least common reported symptom (Table 4). Self-awareness of symptoms, including blocked nose, itchy nose olfactory disorders, and ocular symptoms, was significantly different between the rural and urban areas (P<0.01).
The most commonly reported allergens were pollen and dust mite in the urban and rural regions, respectively (Table 4).
In the past 12 months, 2.1% of the self-reported AR subjects in the rural area presented at the clinic for their nasal complaints, among whom only 14 (1.5%) were diagnosed with AR by physicians, and 12 patients (1.5%) received surgical and/or medical treatment. Less than half of these subjects (41.7%) receiving treatment reported that their symptoms improved after the treatment. In the urban community, 5.9% of the self-reported subjects attended the clinic for a nasal problem, of whom 58 (3.9%) were diagnosed with AR by physicians. Overall, 76 (5.1%) of these subjects received treatment, of whom 37 reported no improvement or worsening of symptoms after the treatment (Table 4).
Nasal symptoms of the rural self-reporting AR respondents in the rural area were most common in November (49.7%) and December (48.3%), and generally decreased from June (23.5%) to September (20.8%). Urban participants' nasal symptoms were most common in November (33.6%), and decreased substantially from June (4.4%) to August (7.7%) (Table 4). These differences were statistically significant between the rural and urban subjects from May to December and January (P<0.01).
Self-reported comorbidities of chronic sinusitis, asthma and atopic dermatitis
Chronic sinusitis was the most frequently mentioned comorbidity in the self-reported AR subjects in the urban area (40.2%), whereas atopic dermatitis was the most frequent comorbidity in the self-reported AR subjects in the rural area (33.3%). Furthermore, for allergies in the family members of participants, AR (40.5%) was most frequently found in the rural self-reporting AR individuals, followed by chronic sinusitis, asthma, and atopic dermatitis; however, chronic sinusitis (40.3%) was most frequently found in the urban self-reporting AR individuals, followed by atopic dermatitis, AR, and asthma (Table 4).
Confirmable prevalence of AR
The rural and urban subjects self-reporting AR and an equal number of randomly selected subjects reporting negative AR were asked to undergo SPTs, and 118 rural subjects and 128 urban subjects agreed to SPTs (Table 5). Table 5 shows that the positive rate of SPTs in self-reporting AR subjects was significantly different between the rural and urban areas (32.5% in the rural subjects vs 53.3% in the urban subjects, P<0.01). According to the positive rate of SPTs in self-reporting AR between 2 areas, we were able to deduce that the prevalence of confirmable AR in subjects with both positive self-reporting AR and positive SPTs were 6.2% in rural area and 7.2% in urban area, respectively. Although this was not significantly different (P=0.376) between rural and urban area, the confirmable prevalence of AR was markedly lower in both the rural and urban areas than estimated on the basis of self-reported AR alone (19.1% and 13.5%, respectively).
DISCUSSION
To our knowledge, this is the first epidemiological survey using a combination of a questionnaire-based self-reported AR and positive SPTs (i.e., confirmable prevalence of AR) to determine the prevalence of AR in adults in both rural and urban areas in Mainland China. The assessment of the potential risk factors for AR in the 2 areas showed that only attaining the elementary school education was associated with a significantly increased risk of AR, whereas low, below-moderate, and above-moderate yearly incomes were associated with significant protective factors for AR.
The prevalence of self-reported AR in adults is much lower in our country than in many Westernized nations, such as Australia (up to 41.3%), Europe (up to 41%), and the USA (30.2%),3,10,11 as well as in other developed/developing countries, such as Colombia (32%),12 Japan (35.5%),3 and Nigeria (29.6%).13 It is likely that these differences in the prevalence of AR among different countries could be attributed to multiple conventional and nonconventional risk factors, including differences in genetic predisposition to allergic disease, environmental factors (geographical, climatic, and air quality), allergen exposure (time, dose, number, and types of allergens), industrialization, and lifestyles (dwellings, exotic foods, pets, furnishings, etc.).1,3
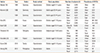
Increasing evidence suggests that urbanization of an area has generally been associated with increased prevalence of respiratory allergic disease, including AR and asthma in both adults and children.3,14,15,16,17,18 Indeed, a population-based study in Mongolia demonstrated that the prevalence of allergic sensitization was progressively increased from 13.6% in villages, to 25.3% in rural towns, to 31.0% in the city,18 suggesting that the degree of socioeconomic development and urbanization may directly influence the prevalence rate of allergic sensitization. The findings of a higher prevalence of self-reported AR in the rural area than in the urban area investigated in the present study are similar to those in Korea, the Philippines, and Turkey; however, the higher prevalence of AR in urban areas was reported in Europe and Africa as well as West Germany after reunification (Table 6).18,19,20,21,22,23,24,25 This difference in the rural and urban areas in the present study may be due to several factors. In particular, interview response rates was lower in the rural area (75.9%) than in the urban area (81.5%), which possibly led to underreporting and underdiagnosis of AR in the rural area. Indeed, a recent study by Liu and colleagues14 investigating the prevalence of chronic disease among the elderly in the urban and rural areas of Beijing has suggested that chronic disease in the rural area of Beijing was likely to be underdiagnosed and underreported partially as a result of limited availability of local health services, rural poverty, the lack of effective insurance coverage after the collapse of the rural Cooperative Medical System, and sharp increases in charges under the new fee-for-service system.
Since the 2 study cohorts in the present study were similar in terms of ethnicity (Han Chinese) and both were surveyed concurrently using the same instruments, it is likely that the prevalence of AR in the 2 areas was influenced by environmental and/or sociodemographic factors. While Rona and colleagues26 have reported that a low socio-economic status may be associated with an increase in the severity of asthma. In this regard, our results indirectly support Rona's findings.26 Our study has demonstrated that the economic status of residents of the urban and rural areas was significantly different and that compared to minimum yearly income, low, below-moderate, and above-moderate yearly incomes were protective factors for AR and decreases in prevalence. Moreover, evidence suggests that in individuals at a low socioeconomic status, poor housing conditions (involving increased exposure to dampness, mould, and generally poorer indoor air quality),27,28 lower intake of fruits and vegetables, and higher consumption of unsaturated fat29 are associated with an increased risk of atopic diseases. Although a lower prevalence of atopic diseases in rural areas has been associated with the "hygiene hypothesis",30 epidemiological evidence emerging from Germany following reunification of East and West Germany clearly suggests that the prevalence rates of self-reported AR and asthma-related respiratory symptoms in the eastern part of Germany tend to increase to West-German levels20 and that increases in the prevalence of allergic diseases in East Germany are likely to be a result of increased sensitization to aeroallergens rather than the study area.19 Our findings of similar confirmable prevalence of AR of 6.2% and 7.2% in the rural and urban areas, respectively, based on a positive self-reported AR and positive SPT results, are in accord with findings from studies in Germany after reunification. Moreover, in China it is also likely that the indoor air pollution is a more important determinant of allergic sensitization in rural areas than in urban areas, especially for low economic status subjects, because of the presence of a larger number of locally bred and raised pets, such as dogs and cats, as well as combustion of more organic fuels in rural areas.
In the present study, more than 80% of the rural respondents only received primary education, while over 70% of the urban interviewees received middle school or higher education. In this regard, it is possible that the interviewee's poor educational background could possibly influence their understanding of AR, so they mistakenly self-report infectious rhinitis or vasomotor rhinitis as AR. The results of our study indicating that the educational level of elementary school increased the risk of AR also support our inference. Since health education, awareness, and media promotion of asthma and AR have been increased over the past few years on Mainland China, it is possible that the prevalence of AR may have been overestimated in individuals with poor educational background, considering that 45.5% of the rural participants only received elementary school education in the present study. Indeed, a questionnaire study aimed at investigating the prevalence of self-reported asthma and AR in adults after reunification of Germany showed that while the prevalence of asthma and AR remained stable in West Germany, it appeared to significantly increased in East Germany, approaching the levels in West Germany.20 We speculated that the apparent increase was primarily due to heightened awareness of atopic diseases among the public and health care providers. In another survey from Turkey, researchers found that the risk of progression to asthma and atopic diseases was higher in families in which the paternal educational level was low and that the sensitivity and awareness of these disorders may cause the prevalence to appear higher than it was.24 A cross-sectional survey among otolaryngologists in Mainland China has recently demonstrated that while most of the otolaryngologists (61%) diagnosed AR based on medical history and nasal examination, only 35% of the otolaryngologists used skin prick tests or specific IgE serum tests.31 It is thought that the diagnosis and management of AR in China was suboptimal and that Chinese otolaryngologists needed continuous education for proper understanding of AR and non-AR. Therefore, these results suggest that in view of this suboptimal understanding of the disease on the part of both patients and clinicians, the possibility of misestimating the true prevalence of AR in China is high.
Moreover, our study showed that among the self-reporting AR subjects, only 32.5% in the rural area were found to have positive SPT results, while 53.3% in the urban area had positive SPT result. Consequently, the prevalence of confirmable AR was found to be much lower at 6.2% in the rural area and 7.2% in the urban area, with no significant difference between the 2 areas. This relationship between positive SPTs and self-reported AR in our study is consistent with that in a study by Zacharasiewcz and colleagues,7 who showed that the attributable fraction of IgE-mediated allergy in patients with a diagnosis of AR by questionnaires was slightly over 50%, indicating an overestimation of the true prevalence of AR.
Furthermore, this result clearly demonstrates that in the present study, the self-reported prevalence of AR was overestimated for several reasons, of which a low educational level and poor understanding of differentiation between AR and non-AR are likely to feature prominently in our study cohort. Collectively, these studies suggest that overestimation of AR prevalence in the positively self-reporting subjects with negative SPT results may be attributed to the presence of other forms of rhinitis, such as infectious rhinitis, idiopathic rhinitis, non-AR with eosinophilia syndrome, and chronic rhinosinusitis.32 Indeed, our study has also shown that the positive rates of SPT are lower in self-reporting negative AR subjects than in self-reporting AR subjects in the 2 areas (23.7% vs 32.5% in the rural area and 22.1% vs 53.3% in the urban area; Table 5), which is consistent with the SPT results of Kong's study involving children with and without rhinitis symptoms10 and Mpairwe's study33 involving women with and without a history of asthma. Considering seasonality of AR, our study has demonstrated that the nasal symptoms reported by rural subjects peak during the winter months of November to January, whereas they do not in urban subjects. While it is possible that symptoms in rural subjects may be predominantly associated with specific allergens/air pollutants during this period, symptoms in urban subjects are likely be related to a larger variety of allergens/air pollutants present throughout the year, with no specific seasonality being demonstrated. However, it is possible that although subjects from both rural and urban areas have a similar cognitive degree of the presence or absence of nasal symptoms, they cannot easily differentiate the forms of rhinitis.
Although earlier assessment of data from the European Community Respiratory Health Survey I showed that a panel of 7 out of 9 most common aeroallergens, including Dermatophagoides pteronyssinus, cat, grass, birch, olive pollen, Alternaria, and Cladosporium, allows identification of almost all sensitized subjects in an previous epidemiologic study,34 subsequent analysis has suggested that the estimation of the prevalence of AR may actually have been underestimated because some important allergens had not been tested.6 In the study, 20 standardized extracts were selected for SPT, in order to avoid underestimation of the confirmable prevalence of AR. However, with respect to the concept of entropy which means local production of IgE in nasal mucosa in up to 40% of non-AR patients,35 the prevalence of AR may also be underestimated by the confirmable tests of SPTs.
In conclusion, it is clear that factors for a similar prevalence of confirmable AR and a higher prevalence of self-reported AR in rural and urban areas are multiple and complex and that there is not a single explanation or hypothesis yet. As the first study to be conducted specifically for the assessment of adult AR prevalence in urban and rural areas in Mainland China, this research may provide the basis for further explorations.
Presently, the study has limitations in that the sample size is small and only a limited number of risk factors were evaluated. Furthermore, it is likely that the self-reporting nature of the study contributed to some selection bias, and despite the best efforts of the investigators to persuade the study subjects to undergo SPTs for the confirmation of atopic sensitization, many subjects did not agree to. Thus, future studies would need to investigate larger cohorts using standardised survey forms, more specific allergy tests, and a larger number of risk factors, including endotoxins, parasites, air pollution, and diet, in an attempt to better understand the prevalence, difference, and relationship of confirmable and self-reporting AR in urban and rural areas in Mainland China.

 XML Download