

 PDF
PDF ePub
ePub Citation
 Print
Print


INTRODUCTION
Bronchial asthma is defined as a chronic inflammatory disorder of the airways which is characterized by persistent airway hyperresponsiveness and intermittent reversible airway obstruction caused by hypersensitivity to various stimulants.1 Clinically, asthma is a complex disease caused by multiple genetic and environmental factors and is diagnosed by airflow obstruction responses to a bronchodilator. Pathologically, structural changes in the airways include bronchial mucosal damage, increased mucus secretion, submucosal hypertrophy, eosinophilic inflammation, and, occasionally, bronchial wall thickening caused by lymphocytes or plasma cell infiltration.2 These forms of chronic inflammation ultimately cause airway remodeling,3 accompanied by mucosal hyperplasia, hypertrophy of the basement membrane, and smooth muscle hypertrophy.
The mouse is the most common species used to study physiological mechanisms and cellular components causing airway inflammation in allergic asthmatic patients. Pulmonary function tests are necessary to diagnose and evaluate treatment responses. Although the most commonly used pulmonary function test is spirometry, this test is difficult to perform, and its accuracy is not accepted. For these reasons, radiological studies are performed to evaluate pulmonary function. Various radiological studies have been developed, and radiological findings, such as airway remodeling, air trapping, and centrilobular nodules suggestive of small airway disease, can be obtained by multi-detector computed tomography (MDCT). Ongoing studies are being conducted to develop new radiological imaging techniques for the evaluation of lung perfusion and ventilation.
Recently, many imaging techniques have been developed to examine small specimens, including micro-computed tomography (micro-CT). In previous animal studies, conventional histological analysis has some limitations; for example, serial cutting of multiple thin slices from a tissue specimen is slow and expensive and, once sliced, the intact volume is lost, and subsequent examinations are difficult or impossible. Moreover, histological analysis does not provide 3-dimensional views of the lung.4 In contrast, micro-CT is non-invasive, allows for the generation of high spatial resolution images and provides 3-dimensional views of the lung. Increases in computer speed and memory have enabled micro-CT systems to generate high spatial resolution images from small specimens.5-7 Lim et al.7 reported that the fine anatomical structures and pathological lesions of the lung were more accurately demonstrated on micro-CT than on thin-slice MDCT in inflated and fixed lung specimens. In animal studies, micro-CT can evaluate quantitative changes in the lung as a variable; the cost, time, and number of animals are reduced. In a recent study, micro-CT has been shown to be an innovative tool for assessing lung cancer, emphysema, and pulmonary fibrosis in a mouse model; however, studies concerning airway measurement using micro-CT in a mouse allergy model have not yet been reported.
This study was attempted to evaluate airway changes in ovalbumin-induced asthma model mice and controls using postmortem micro-CT images and pathological findings and to examine between the 2 variables.
MATERIALS AND METHODS
Creation of a mouse asthma model
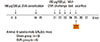
Six-week-old male BALB/c mice were purchased from Charles River Technology Inc., Seoul, Korea. To avoid differences in sensitization between male and female mice, only male mice were used. OVA (100 µg; Sigma, St. Louis, MO, USA), 0.2 g of emulsifying aluminium hydroxide, and 2 mL of distilled phosphate-buffered saline (D-PBS) were mixed in a total volume of 200 µL, and then the mixture was injected intraperitoneally into each mouse on days 0 and 14. On days 21-23, 75 µg of OVA mixed with 1 mL of D-PBS in a total volume of 50 µL was instilled intranasally (experimental group, n=6). As controls, D-PBS was injected intraperitoneally on days 0 and 14, and then intranasally instilled on days 21-23 (control group, n=6). During intranasal instillation, mice were administered intraperitoneally with a mixture containing 5 mL of ketamin, 4 mL Rumpun, and 4 mL of D-PBS in a total volume of 50 µL to supress hyperactive sneezing and reactions. On day 24, both the experimental and control groups inhaled methacholine (A2251 acetyl-methylcholine chloride 98%; Sigma) for 3 minutes to stimulate the airway. The flow chart of this experiment is shown in Fig. 1.
This hospital, was approved the animal ethics committee and research steering committee of our university.
Micro-CT imaging acquisition
Micro-CT images were acquired in a microfocus tube (focal spot size, 5 µm; energy range, 20-100 keV) and a micro-CT unit using a rotation acquisition protocol (Skyscan 1076; skyscan, Aartselaar, Belgium). CT was performed using the following parameters: pixel size, 35 µm; source voltage, 40 kVp, and source current, 240 µA. The X-ray detector comprised a 12-bit water-cooled charge-coupled device high-resolution (4,000×2,300-pixel) camera and an X-ray scintillator.
Metacholine inhalation on day 24, and micro-CT was conducted on day 25. Since the mouse's diaphragm moved during respiration, anesthetics (mixture containing 5 mL of Ketamin, 1 mL of Rumpun, and 4 mL of D-PBS) were injected intraperitoneally (lethal dose, 250 µL) to iliminate motion artifacts. After respiratory arrest, 300 µL of lidocaine HCl (20 mg/mL; Huons, Seoul, Korea) was injected. Then, after 10 minutes of cardiac arrest, each mouse was placed in the supine position, and CT was performed.
Micro-CT images were acquired in increments of 0.5° between projections for a total rotation angle of 360° without cardiac or respiratory synchronization. The exposure time for each view was 0.316 seconds, and a 0.5-mm aluminum energy filter was used. Voxel (volume pixel) size was 35×35×35 µm. The imaging acquisition time of each mouse was 30 seconds.
Image processing and analysis
About 700 BMP (Bit MaP) modality images were obtained when the whole lung was scanned. To save scanning time and image numbers, however, scanning was performed exclusively below the main bronchus level for airway measurements, and we acquired 300 BMP images. Acquired BMP images were converted to the Digital Imaging and Communications in Medicine (DICOM) format to yield 3-dimensional reconstruction images, and the Lucion (Lucion 1.5; MeviSYS, Seoul, Korea) program was used for 3-dimensional reconstruction.
In order to measure the bronchial lumen area on Micro-CT images, we chose the most circular-shaped main bronchus lumen area after the third bronchial branch level. Three main bronchial lumen areas on both sides of each mouse were measured just at the distal main bronchus of the fourth to sixth distal branch level; thus, a total of 72 bronchial lumen areas were. A Lucion's smart pen (semi-automated) and a curve pen (manual) were used to measure bronchial lumen area.
Bronchial wall thickness was obtained by measuring a diameter which was perpendicular to the longitudinal axis of the main bronchus on curved multiplanar reformation (MPR) images because the bronchial wall was surrounded by many bronchial vessels. Four sections (2 levels on either side) of the bronchus after the third bronchial branch from each mouse were measured, thus a total of 48 bronchial walls were evaluated.
Measurements were made by a single radiologist with 12 years of radiological experience.
Histopathologic analysis
After micro-CT scanning, lung tissue was immediately extracted, and 1 mL of D-PBS was injected into the bronchus to prevent air space collapse. The extracted lung tissue was immersed in 4% paraformaldehyde solution for fixation at 4℃ for 1 day, and was subsequently embedded in paraffin. For histopathological analysis, paraffin-embedded lung tissue was sectioned at a thickness of 4 µm, and was then stained with hematoxylin and eosin (H&E).
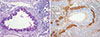
To confirm mucus-producing goblet cells and hypertrophied submucosal smooth muscles in the lung tissue which were detected on H&E-stained slides, periodic acid-Schiff (PAS) staining and smooth muscle actin (SMA) staining were also performed.
Histologic slides were obtained from the lesions that were matched with CT images, and maintaining of lung volume and anatomic position during fixation enabled us to know section levels. Bronchial wall thickness was determined-2 each, left and right-using an optical microscope at a magnification power of 100; thus a total of 48 sections were determined. On pathology slides, the airway wall thickness was measured by calculating the distance from the inner side of the epithelial cell layer to the most outer side of the smooth muscle layer with the arrowhead within the microscope.
Statistic analysis
The paired t-test was used to compare the bronchial lumen diameter and bronchial wall thickness the experimental and control groups, and a P value of <0.001 was considered significant. Concordance between micro-CT and pathological results was examined using Pearson correlation coefficients, and a P value of <0.05 was considered significant. All statistical analyses were conducted using the Stata software (ver. 9.0; Stata; College Station, TX, USA).
RESULTS
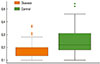
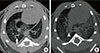
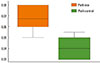
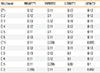
Bronchial lumen area on micro-CT images ranged from 0.10 to 0.37 mm2 (mean area, 0.196 ± 0.072 mm2) in the experimental group and 0.07 to 0.54 mm2 (mean area, 0.243±0.116 mm2) in the control group; the difference statistically significant (P=0.0077) (Table 1) (Figs. 2, 3A and B).
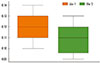
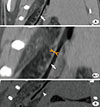
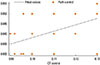
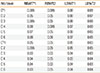
Bronchial wall thickness on micro-CT images ranged from 0.10 to 0.14 mm (mean thickness, 0.119±0.01 mm) in the experimental group and from 0.09 to 0.13 mm (mean thickness, 0.108±0.013 mm) in the control group and the difference was statistically significant (P=0.0005) (Table 2) (Figs. 4, 5).
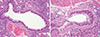
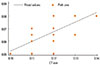
Bronchial wall thickness, as measured in pathological specimens, ranged from 0.05 to 0.08 mm (mean thickness, 0.066±0.011 mm) in the experimental group and from 0.03 to 0.055 mm (mean thickness, 0.041±0.009 mm) in the control group, and the difference was statistically significant (P<0.0001) (Table 3) (Figs. 6, 7A and B).
On histopathological examination, the epithelial layer was thicker in the experimental group than in the control group. Hyperplasia of mucus-containing goblet cells and submucosal smooth muscles was observed (Fig. 8A and B).
DISCUSSION
Since its introduction in the 1970s, CT has become an important tool in clinical diagnosis. However, CT images are difficult to evaluate in small animals because of the limitation to spatial resolution. Recently, several imaging techniques have been developed for animal models, including micro-CT using an isotropic voxel size ≥100 µm.
Conventional X-ray scanners of micro-CT comprise a tungsten-anode X-ray tube with small focal spots and a high-resolution X-ray detector. Reconstructed images are converted using a back projection approach after obtaining X-ray projection images using a cone beam. Micro-CT imaging systems are divided into 2 categories: systems for in vitro and in vivo images. Systems for in vitro images are optimized for spatial resolution, similar to histological examination, and the X-ray source and detector are fixed while the samples rotate. Systems for in vivo images use a coupled X-ray source and a detector rotating around samples. Due to the limitation to X-ray radiation doses, the spatial resolution of systems for in vivo images is inferior to that of systems for in vitro images. Although some downgrading of spatial resolution occurs, images are adjusted to time points that where animals can tolerate. The spatial resolution of micro-CT is determined by several factors, including the unique resolution of the X-ray detector, geometric magnification, focal spot size, the stability of rotation mechanism, and reconstruction filtering algorithm.
Recently, micro-CT scanners have been developed for living animals. Micro-CT imaging in living animals is a challenging problem because cardiac and pulmonary motions are usually achieved by cardiac and respiratory gating. In addition, experience with temporal and spatial scales is also required because scanning times and radiation exposure doses can adversely affect living animals. According to a previous report, rodents developed pericarditis and myocarditis when they received a radiation of >20 Gy and when a scanning time of >60 minutes increased the mortality rate. In our study, each animal was exposed to 0.1-0.5 Gy for image acquisition. According Cody et al.8 quantified the number and volume of lung tumors by using respiratory-gated micro-CT in a k-ras mouse model and compared them to those obtained by necropsy. As a result, lung tumor volumes on respiratory-gated micro-CT scans were both reproducible and accurate, and micro-CT may become a powerful tool in murine lung cancer research in vivo. Cavanaugh et al.9 also used in vivo respiratory-gated micro-CT in a small-animal oncology model.
It is a difficult to obtain adequate micro-CT images from the lung in animal models. This may be because motion artifacts occur frequently because of the mouse's respiratory and cardiac movement and spatial resolution insufficient to analyze anatomical structures. However, studies concerning emphysema or parenchymal changes in micro-CT in animal models have recently been reported.10,11 Froese et al.10 reported the usefulness of micro-CT in a mouse model of emphysema as an innovative tool for assessing decreased lung density, which correlated with the extent of airspace enlargement as assessed by histopathology. Lee et al.11 demonstrated that in vivo and postmortem micro-CT findings correlate well with pathological findings in a mouse model of bleomycin-induced lung fibrosis. The confidence levels for the quantification of fibrosis-related findings were significantly higher in postmortem micro CT than in in vivo CT.
In this study, the in vivo experiment was initially performed, but adequate images were not obtained because of delayed imaging acquisition times due to respiratory gating, administration of anesthetics, and increased artifacts. Thus, the experiment was converted to a postmortem design that entailed the sacrificing of the mice just before image scanning. While the equipment and research methods of micro-CT are currently being developed, stabilization of anesthesia, shortening of scanning time, and development of respiratory/cardiac gating are required to evaluate the lung parenchyma or airway of small animals in vivo.
Many radiological findings of asthmatic patients have been reported, and the common abnormal findings in high-resolution computed tomography (HRCT) in asthmatic patients include thickening of the bronchial wall, narrowing of the bronchial lumen, areas of decreased attenuation and vascularity on inspiratory CT scans, air trapping on expiratory CT scans, and mucus stasis in bronchioles.13-16 Various studies have reported that the most typical finding is thickening of the bronchial wall. The bronchi are thickened by a combination of submucosal edema due to inflammation, smooth muscle hypertrophy, and peribronchial fibrosis.17 Kasahara et al.18 demonstrated a strong positive correlation between the thickness of the epithelial reticular basement membrane, as measured in bronchoscopic biopsy specimens, and whole airway wall thickness, as measured by HRCT scanning in asthmatic patients. The thickness of the submucosa increases simultaneously with whole airway wall thickness. Fibrosis, smooth muscle hypertrophy, and inflammatory hypertrophy correlate with reversible or irreversible airway wall thickness after treatment.13,19
In this study, submucosal epithelial cell hyperplasia and smooth muscle hypertrophy were prominent compared to the thickening of the basement membrane. These results are different from those of previous studies in asthmatic patients. The reason for this may be that the duration of disease was longer in the asthmatic patients, while it was shorter in our asthma model mice.
Previous studies in asthmatic patients reported histopathological findings through bronchoscopic biopsy. However, in our animal study, various sizes of bronchi were acquired, and peribronchial cellular infiltration was observed in the whole lung tissue, including smooth muscle layers, when measured by both micro-CT and histopathological examination, bronchial wall thickness was thicker in the experimental group than in the control group. These results indicate that asthma model mice have more constrictive bronchial lumens than control mice because of airway hyperresponsiveness to various stimuli. The reasons for this are as follows.
First, bronchial wall thickness on micro-CT images included airway mucosa, fibrosis, and inflammatory cell infiltration outside the smooth muscle layer, while bronchial wall thickness in histopathological specimens only included the smooth muscle layer. Second, cellular atrophy may have occurred during tissue fixation and paraffin-embedding processes.
Airway obstruction are measured as a ratio of the lumen diameter to the total airway diameter in the randomly selected airway. In our study, we attempted to measure airway wall thickness, but mice had too small airway wall thickness. Thus, instead of airway wall thickness, we measured the lumen area to evaluate airway obstruction.
Further studies are required to confirm our results. Changes in radiological and histopathologic findings should be studied using animal models of acute and chronic asthma.
CONCLUSIONS
On micro-CT images, bronchial lumen area was smaller and bronchial wall thickness was thicker in the experimental group than in the control group, which significantly correlated with pathological findings. The thickened airway wall on micro-CT images was due to mucosal epithelial hyperplasia and smooth muscle hypertrophy histopathologically. Micro-CT may be a good modality for analyzing small animal airways.
 XML Download