

 PDF
PDF ePub
ePub Citation
 Print
Print


INTRODUCTION
Asthma is a common respiratory disease characterized by reversible airway obstruction, bronchial hyperresponsiveness, and respiratory symptoms resulting from chronic airway inflammation. Recently, it has been focusing on heterogeneity of asthma, which is asthma consists of multiple phenotypes.1 Various factors, including cytokines, genes, and other environmental exposures, are involved in the development of the disease, and allergic inflammation, among many factors, is still important in the pathogenesis of asthma.2
Eosinophils are involved in allergic inflammation in asthma via several processes, including adhesion to endothelial cells, transendothelial migration, and chemotaxis through monocyte chemoattractant proteins (MCPs).3,4 The three MCPs (MCP-1, -2, and -3; MIM# 158105, MIM# 602283, and MIM# 158106, respectively) share 51%-78% amino acid homology and activate monocytes via the chemotactic cytokine (CC) β chemokine receptor (CCR) 2. MCP-3 activates both CCR1 and CCR3, while MCP-2 activates CCR5.3,4
MCP-1, -2, and -3 mRNAs are expressed in airway smooth muscle cells following stimulation with the cytokines interleukin-1 beta (IL-1β), tumor necrosis factor alpha (TNF-α), and interferon gamma (IFN-γ). Moreover, MCP-1 mRNA expression is associated with an increase in the release of MCP-1 and MCP-2 proteins.5 The level of MCP-1 is higher in the bronchoalveolar lavage fluid of subject with asthma than in non-asthmatics.6 The mean serum MCP-1 level is significantly higher in asthma than in control,7 and this higher level of serum MCP-1 is observed during the asymptomatic phase and declines after treatment.7 Furthermore, MCP-1 might play an important role in allergic responses via induction of mast cell activation and release of leukotriene C4 into the airway, which directly induces airway hyperresponsiveness.8 MCP-3 may play an important role in macrophage recruitment in children with upper respiratory viral infections.3 RANTES and MCP-3 mRNA was significantly elevated in bronchial mucosa of atopic asthma, and associated with significantly increased numbers of bronchial mucosal eosinophils.9 The expressions of MCP-3 in bronchial mucosa were also observed together with eosinophilic cytokines such as IL-5 GM-CSF, and IL-13 in both atopic and nonatopic asthma.10
All three human MCP genes are located on chromosome 17q 11.2-q12. The frequency of the MCP1-2518G>A G polymorphism in the gene regulatory region of MCP-1 is significantly higher in asthma and correlated with increased eosinophil levels in Caucasian asthmatic children.11 On the other hand, there is lack of study for the association between MCP-2 and MCP-3 gene polymorphisms with asthma.
Because asthma is a complex and heterogeneous respiratory disease, the factors involved in the development of asthma, including cytokines, genes, and other environmental exposures, likely interact. Predisposition to complex disease imparted by individual genes may act independently or interact with other genes that exist in the same biological pathway to produce variable effects.12 MCP genes may contribute to the development of asthma or other allergic phenotypes through receptor-ligand interactions. MCP gene structure and function have been characterized, in addition to sequencing; however, little is known about interactions among MCP genes in asthma. In this study, we evaluated the association between the polymorphisms of MCP genes and asthma, and further gene - gene interactions among MCP gene polymorphisms in patients with asthma.
MATERIALS AND METHODS
Subjects
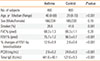
Four hundred asthmatics and Four hundred normal controls were enrolled in this study. The institutional review board of the Soonchunhyang University Bucheon Hospitals approved the study. All asthmatics had current symptoms, such as wheezing, dyspnea, or cough, and met the criteria for asthma as determined by the American Thoracic Society.13 Each patient showed airway reversibility as documented by an inhalant bronchodilator-induced improvement of forced expiratory (FEV1) of >15%14 and/or airway hyperresponsiveness as provocative concentration of methacholine required to cause a 20% decrease in FEV1 (PC20) of <8 mg/mL.14 Normal subjects were recruited from the general population, based on the following criteria: a negative screening questionnaire for respiratory symptoms,15 a predicted FEV1 >75%, PC20 ≥8 mg/mL, total serum IgE <300 IU/mL, and a normal chest X-ray. The clinical characteristics of all asthmatic and control subjects are presented in Table 1.
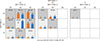
Genotyping by single base extension and electrophoresis
Single-base extension reaction was used to genotype polymorphic sites. SNaPshot ddNTP Primer Extension Kit (Applied Biosystems, Foster City, CA, USA) was used for primer extension reactions according to the manufacturer's recommendations. The primer extension reactions were cleaned by the addition of 1 U of shrimp alkaline phosphatase and incubation at 37℃ for 1 hour, followed by 15 minutes at 72℃ for enzyme inactivation. DNA samples, containing extension products, and GeneScan 120 Liz size standard solution were added to Hi-Di formamide (Applied Biosystems), as recommended by the manufacturer. The mixture was incubated at 95℃ for 5 minutes, cooled on ice for 5 minutes, and electrophoresed using the ABI Prism 3100 Genetic Analyzer. Data were analyzed using ABI Prism GeneScan 3.5.1 and Genotyper 3.6 software (Applied Biosystems).
Hardy-Weinberg equilibrium, linkage disequilibrium, haplotypes, and association analyses between asthma and normal control.
A total of 7 SNPs in MCP-1, -2, and -3 genes (2 SNPs in MCP-1 gene, 1 in MCP-2, and 4 in MCP-3) were included in the analysis. Testing for Hardy-Weinberg equilibrium16 and the calculation of D' for identification of linkage disequilibrium were performed using PDA 1.0.17 Haplotypes were inferred using EM-algorithm (PHASE 2.0.2)18 in 2 ways; with separate 3 genes for each and all at once.
Continuous variables, such as serum total IgE levels, and PC20 methacholine levels were log transformed to approximate normal distributions. Chi-square tests were used for comparisons of categorical variables, Student's t-test for continuous variables. The differences in the log-transformed values among genotypes were examined using a logistic regression model. All single SNPs and haplotypes (frequency >0.05) were analyzed for their association with asthma, using logistic regression models with adjustment of age and sex. Statistical significance was defined at the standard 5% level. These analyses were performed using software R (www.r-project.org).
Tests for gene - gene interactions
To find gene - gene interaction model, we used the multifactor dimensionality reduction (MDR) analysis (MDR, v.10.0). Cross-validation is a measure of the number of times a particular set of loci is identified in each of the subjects. The threshold ratio is defined as the ratio of the number of affected individuals to that of unaffected individuals. The subjects are at high risk only when the threshold ratio exceeds 1.0. When the final best model was selected, a model for high- and low-risk genotype combinations was formed using an adjusted threshold that was equal to the ratio of cases and controls in a model that maximizes the cross-validation consistency (CVC).19,20 Accuracy is defined as the proportion of subjects that are grouped correctly according to their case-control status. When the CVC was maximal for 1 model and accuracy was maximal for another, the model with fewest loci/factors was selected.19,20,21 To test the universal null hypothesis of no association of the independent and additive main effects, we further used permutation tests with software MDRpt.22 To estimate the contribution of associated genotype combination, we calculated the odds ratio of each genotype combination in best model using odds ratio based MDR (ORMDR, v.1.2).23
Interaction information, and interaction graph
Interaction information analysis used for validation of MDR results.20,24,25,26 Interaction information was measured among 2 given loci and subject's status (asthma or control) using Shannon entropy.27 Let H(X) be the Shannon entropy of X. The information gain (IG) was derived as follows:
, where I (A;B) denotes the dependency of correlation between A and B, and I(A; B|C) denotes the interaction of A and B given C. When the difference between these 2 parameters, IG (ABC), is positive, it is defined as synergy or evidence of an attribute interaction, whereas when interaction information is negative, it is defined as redundant or evidence of an independency.20,24,25 An interaction graph was drawn up based on interactions information with software Orange.28
RESULTS
Hardy-Weinberg equilbrium, linkage analyses
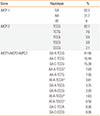
The genotype distributions of all 7 single nucleotide polymorphisms (SNPs) were in Hardy-Weinberg equilibrium (data not shown). MCP1-2518G>A had complete linkage (|D'|=1.0) with MCP1-2076A>T and with three SNPs (MCP3-420T>C, MCP3+136C>G, and MCP3+563C>T) of the MCP-3 gene in both asthma and normal control. The remaining SNP, MCP3+984G>A, also showed strong linkage with MCP1-2518G>A. MCP1-2076A>T also had complete linkage with MCP2+46A>C, MCP3+563C>T, and MCP3+984G>A in both asthma and normal control (Table 2).
Haplotypes distribution and association analyses
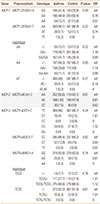
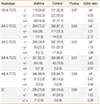
We constructed haplotypes with 2 SNPs of MCP-1 gene, and 4 SNPs of MCP-3 genes. Only 3 haplotypes were existed among 4 theoretical haplotypes in MCP-1 gene. Haplotype GA and AA comprised 94.0% of all haplotype in MCP-1 gene. Only 5 haplotypes were also found among 16 theoretical possible haplotypes in MCP-3 gene (Table 3). Haplotype TCCG comprised 82.7% of all haplotypes in MCP-3 gene and the each proportion of the other haplotypes was less than 10% (Table 3). There was no SNP that showed significant association with asthma. There was no haplotype that associated with asthma, either (Table 4). We tried to make haplotypes simultaneously with all 7 SNPs in 3 MCP genes because 3 MCP genes are located in same chromosome 17, then 12 haplotypes were constructed (Table 3). The haplotypes that contains TCCG of MCP-3 gene haplotype (GA-A-TCCG, AA-C-TCCG, GA-C-TCCG, and AA-A-TCCG) comprised 81.1% of all haplotypes. There was no haplotype among 12 that significantly associated with asthma (Table 5).
Gene - gene interaction models and information analyses
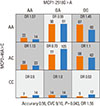
The combination that composed of MCP1-2518G>A, MCP2+46A>C, and MCP3+563C>T was the best model to predict the asthma. (accuracy=0.58, CVC=10/10, P=0.035, OR=1.96; Table 6, Fig. 1) The next best model was a 2-loci combination composed of MCP1-2518G>A and MCP2+46A>C (accuracy=0.56, CVC=9/10, P=0.043, OR=1.56; Table 6; Fig. 2). Only 14 genotype combinations were found among 27 theoretically possible combinations in the 3-loci best model. High-risk and low-risk genotype combinations for asthma and odds ratios (OR) of each genotype combination are designated in Fig. 1. More high-risk genotype combinations for asthma were observed in subjects with the CC alleles of MCP3+563C>T, AA or AC alleles of MCP2+46A>C, and AA or GG alleles of MCP1-2518G>A. Of the 14 combinations, 6 genotype combinations had an OR >1.0. The combination of AA-AA-CC (in order of MCP1-2518G>A, MCP2+46A>C, and MCP3+563C>T) was the best genotype combination, and the OR was 3.67 (95% CI, 1.18-13.04). The combination of GA-AC-CT (in order of MCP1-2518G>A, MCP2+46A>C, and MCP3+563C>T) was the second highest risk combination and the OR was 3.0 (95% CI, 0.97-11.0; Fig. 1).
To confirm the influence of strong linkages among some SNPs on the process of detecting for gene - gene interactions, additional analyses were carried out with the extra-combination of haplotypes that bears the allele A of MCP1-2518G>A, A of MCP2+46A>C, and C of MCP3+563C>T. This combination was composed of 4 haplotypes that constructed with all 7 SNPs of 3 genes, including AA-A-TCCG, AT-A-TCCG, AT-A-TCCA, and AT-A-TGCG (Table 3 and 5). There was no association between the extra-combination of haplotypes and asthma (Table 5).
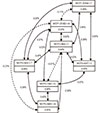
The interaction information analysis revealed that MCP1-2518G>A and MCP2+46A>C had positive synergy and provided more information (0.82% extra information for the subject's status) than its single effect (main effect, 0.52% vs 0.64%, respectively, MCP1-2518G>A versus MCP2+46A>C) for a subject's status (asthma or normal). MCP3+136C>G and MCP3+984G>A also showed positive synergy and provided 0.43% extra information for the subject's status than its single main effect (Fig. 3). More high-risk genotype combinations for asthma were observed in cases bearing the AA or GG alleles of MCP1-2518G>A or AA or AC alleles of MCP2+46A>C, similar to the 3-loci model (Fig. 2). The other SNP combinations had lesser synergistic effects than their single main effects.
DISCUSSION
Many studies suggest that MCPs are involved in asthma,5,6,7,8,9,10,11,29 thus, we attempted to find an association of SNPs of three MCP genes with asthma. No single SNP of MCP-1 or MCP-2 gene was associated with asthma. Our results accorded those of a previous study indicating that no association existed between MCP-3 gene SNPs and asthma.30 Haplotype constructions were performed with all 7 SNPs of 3 MCP genes, as well as separately, because 3 MCP genes are located in same chromosome 17. There was no haplotype that associated with asthma in MCP-1 and MCP-3 genes either.
A gene - gene interaction is often described as "epistasis," which is defined as a nonindependence of effect. In other words, when the effect of one locus is not predictable unless the value of another locus is known, these effects are referred to as "epistatic."31 Many of the important biological consequences of gene interactions depend on specific locus-to-locus interactions, rather than on some average level of interaction.31 Therefore, we hypothesized that a single locus can affect another locus, even this locus does not show the efficiency on the expression of phenotype alone, and attempted to find the gene - gene interaction among SNPs of three MCP genes in asthma.
Gene - gene interactions were tested using 2 different methods in this study. We constructed a gene - gene interaction model using a MDR method. The combination of three MCP gene SNPs (MCP1-2518G>A, MCP2+46A>C, and MCP3+563C>T) was found to comprise the best model. Using this model, we could determine which genotype combinations contributed more to asthma. Of the 14 genotype combinations indicated in the best three-loci model, nine genotype combinations were classified as high-risk for asthma, and these combinations included the CC genotype of MCP3+563C>T and the AA or AC genotype of MCP2+46A>C with MCP1-2518G>A more so than others. Among nine genotype combinations, the combination of AA-AA-CC (in order of MCP1-2518G>A, MCP2+46A>C, and MCP3+563C>T, OR 3.67) and GA-AC-CT (in order of MCP1-2518G>A, MCP2+46A>C, and MCP3+563C>T, OR 3.0) had higher odds ratios to asthma (Fig. 1), which suggests that subjects with these genotype combinations may be at higher risk for asthma.
We analyzed for linkage disequilibrium separately with asthma and normal control. But there is no difference in linkage disequilibrium among 3 SNPs in which was detected as a best model between asthma and control. These 3 SNPs showed strong linkage (|D'|=1.0) in both asthma and control. This suggests that linkage disequilibria did not affect the MDR analysis. In addition to this, to confirm whether these strong linkage disequilibria were influence on the process of detection of epistatic models, we made the extra-combination with 4 haplotypes (AA-A-TCCG, AT-A-TCCG, AT-A-TCCA, and AT-A-TGCG) that bears the allele A of MCP1-2518G>A, A of MCP2+46A>C, and C of MCP3+563C>T. No significant association between the extra-combination and asthma indicates that linkage disequilibria did not affect the process of detecting gene - gene interactions.
To validate the MDR results, we used the measure of interaction information to provide a statistical interpretation of the gene - gene interaction models.20,24,25 Two combinations (MCP1-2518G>A, MCP2+46A>C and MCP3+136C>G, MCP3+984G>A) showed a greater positive synergistic effect on a subject's status (asthma or normal) than an individual contribution. Interestingly, the combination of MCP1-2518G>A and MCP2+46A>C was already determined to be the best two-loci model in the MDR analysis, although it was not the best model (Table 4). The high-risk genotype combination of this 2-loci model was similar to that in the best three-loci model. The combination of AA in MCP1-2518G>A and AA or AC in MCP2+46A>C, or the combination of GG in MCP1-2518G>A and AA or AC in MCP2+46A>C composed the high-risk asthma group, with an OR > 1.0 (Fig. 2). MCP1-2518G>A was reported associated with asthma.11,32 Furthermore, it was also reported to be associated with various kinds of inflammatory disease such as bronchiolitis obliterans, sarcoidosis, HIV infection, and metabolic syndrome in many races.33,34,35,36 However, the MCP1-2518G>A polymorphism is not a risk factor for near-fatal asthma and shows genetic heterogeneity in different races with respect to regulation of MCP-1 expression.32 Nevertheless, MCP1-2518G>A is still one of the important candidate polymorphisms, and MCP genes are important in the development of asthma.
We cannot conclude which model is better between two-loci (MCP1-2518G>A and MCP2+46A>C) and three-loci (MCP1-2518G>A, MCP2+46A>C, and MCP3+563C>T). Regardless which model is best, in terms of epistasis,31 the effect of some SNPs of MCP genes may not be disclosed if the effects of other SNPs are not considered. MCP1-2518G>A and MCP2+46A>C combination gave us most the information regarding a patient's status, and this combination was included in the best three-loci model. We could not measure the attributable information gain (IG) among three loci with the current method. Moreover, neither an appropriate method to reveal gene - gene interactions among three different loci nor a knockout animal model of several MCP gene loci exists to validate our findings biologically.
In summary, gene - gene interactions among SNPs of 3 MCP genes in asthma revealed novel findings. Our findings on the epistatic influence of the SNPs of three MCP genes suggest that these variants may be possible markers for asthma. Furthermore, they provide important evidence for understanding the genetic background of allergic diseases and may aid in the development of a possible genetic marker to predict the development of asthma.


 XML Download