

 PDF
PDF ePub
ePub Citation
 Print
Print


INTRODUCTION
Anaphylaxis is a possibly fatal allergic reaction with a rapid onset.1 It is the most severe form of allergic reactions and should be considered a medical emergency. The exact incidence of anaphylaxis from all triggers is unknown and is increasing according to recently published data.2,3,4,5 Data from Siriraj Hospital (Thailand) found that the annual occurrence of anaphylaxis increased from 9.16 per 100,000 admitted patients in 1999 to 55.45 per 100,000 admitted patients in 2004.6 In this series, drugs were the most common cause of anaphylaxis followed by food. Seafood (especially shrimp) is the most common cause of food-induced anaphylaxis in Thai children.6
The diagnosis of anaphylaxis is based primarily on clinical history.1 In some circumstances, the inability to confirm a clinical diagnosis was due to an unusual presentation that likely contributes to the under-recognition and under-treatment of anaphylaxis.2
Currently, products of mast cell activation (such as total tryptase) can be measured in clinical laboratories as markers of anaphylaxis; however, these tests have clinical relevance limitations.7 Even in optimally timed samples, serum total tryptase levels are seldom elevated in patients with food-induced anaphylaxis.8 Nevertheless, food is the most common trigger of anaphylaxis in most age groups.9 The proportion of food-induced anaphylaxis was 15-57% of patients with anaphylaxis presenting to the emergency department.10
The development of a laboratory test with improved sensitivity and specificity is required to support the clinical diagnosis of anaphylaxis. Consecutive measurements of total serum tryptase during an anaphylaxis episode and after the complete resolution of the anaphylaxis are reported to be better than a single specimen at the peak level.11,12 However, the role of a consecutive measurement approach to verify food-induced anaphylaxis has not been fully investigated.
This study investigates the utility of consecutive total tryptase measurements for the confirmation of shrimp-induced anaphylaxis in children.
MATERIALS AND METHODS
Subjects
The study was approved by the Institutional Review Board, Siriraj Hospital, Mahidol University, Thailand. Informed consent was obtained from parents or patients over the age of 18.
Patients over 5 years of age who came to the pediatric allergy clinic of Siriraj Hospital with a history of shrimp allergy were asked to participate in this study. Patients who had underlying diseases such as cardiovascular, chronic renal, lung and liver diseases were excluded; in addition, patients with a history of a severe anaphylactic reaction from seafood were also excluded from this study due to an ethical issue. Patients were asymptomatic on the days of skin tests and food challenges.
Skin-test procedure
Skin prick tests (SPT) were performed on all patients with a commercial shrimp extract (Center Laboratory, Port Washington, NY, USA). Histamine phosphate (10 mg/mL) and glycerinated saline were used as positive and negative control, respectively.13 SPTs were performed using single use metal lancets on the back of the patients. Antihistamines were discontinued ≥7 days prior to skin tests. The size of wheal and flare reactions were recorded in millimeters (mm). The mean wheal diameter (MWD) was calculated from the sum of the largest measurement across the wheal and the wheal measurement perpendicular to the former and divided by two. SPT was considered positive if the MWD was ≥3 mm compared to negative control.
Food-challenged procedure
Food challenge to shrimp was performed in patients with SPT positive to a commercial shrimp extract. An open food challenge test was done according to a previously reported protocol.13 Increased doses of lyophilized shrimp in capsules were given to patients every 15 min until the cumulative dose (15.5 g) was reached; however, young patients who could not swallow capsules were allowed to skip this process. To identify oral-mucosa reactions, 2 g of cooked shrimp was wiped on the inner lips and placed in the mouth without chewing and spat out after 5 min. Fifteen min later, increased doses of cooked shrimp were given to patients every 15 min until the cumulative dose (63 g) was reached. Vital signs and symptoms were recorded every 15 min. Food challenges were considered positive if there were symptoms or signs of allergic reaction.
Blood samples were collected before the challenge test (baseline tryptase) and 60 min after the onset of allergic symptoms or after test completion (peak tryptase). For the comparative analysis of total tryptase data, we divided patients into 3 groups according to the challenge's results: patients who developed anaphylaxis (anaphylaxis group), patients who had mild allergic reactions (mild reaction group) and patients who had a negative challenge (control group).
Definition of anaphylaxis
In this study, anaphylaxis was defined according to recent criteria.1 Anaphylaxis was diagnosed in a patient when 2 or more of the following clinical criteria occurred after exposure to a likely allergen: 1) skin or mucosal tissue involvement 2) respiratory compromise 3) reduced blood pressure or associated symptoms or 4) gastrointestinal symptoms.
The definition of mild allergic reaction was an acute allergic reaction that could not fulfill the diagnostic criteria of anaphylaxis.
Serum tryptase measurement
After centrifugation at 1,500 g for 10 min, sera were frozen at -80℃ until testing. Total tryptase levels were measured by UniCAP Tryptase fluoroenzyme immunoassay according to the manufacturer's instructions (Pharmacia, Uppsala, Sweden). According to the manufacturer, the 95 upper percentile of the total tryptase level in healthy children and adults was 11.4 µg/L.14
Delta-tryptase and tryptase ratio values represented the change in serum tryptase levels induced by an acute allergic reaction. Delta-tryptase values for each individual were calculated from the peak minus baseline tryptase levels. The tryptase ratio values of each individual were calculated from the peak tryptase divided by baseline tryptase levels.
Data collection and analysis
Data were expressed as individual values or the mean±SD for groups. Median and range were used for non-normally distributed data. Data of 3 groups (anaphylaxis, mild reaction and control group) were initially analyzed by a Kruskal-Wallis test and pairwise comparisons utilized a Mann-Whitney U-test. Differences in total tryptase values before and after a challenge test in each group were analyzed by a Wilcoxon signed-rank test. Differences were considered significant at a P value of ≤0.05. For the peak tryptase, sensitivity and specificity to diagnose anaphylaxis were determined using the manufacturer's recommended cut-off (≤11.4 µg/L) and alternate cut-off according to a receiver-operating characteristics (ROC) curve analysis. A ROC curve analysis helped determine an optimal diagnostic cut-off for a change from baseline tryptase (delta-tryptase and tryptase ratio); subsequently, this approach was compared to peak tryptase by an examination of the areas under the respective ROC curves. We calculated the likelihood ratio (LR) to determine the validity of a diagnostic test. The positive LR was the sensitivity divided by (1-specificity). The negative LR was the (1-sensitivity) divided by specificity. A high LR >10 or a low LR <0.1 had a significant impact on likelihood.
RESULTS
Demographic data
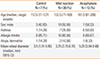
Thirty-nine patients were included in this study. After an open shrimp challenge, anaphylaxis were documented in 12/39 patients (30.8%, anaphylaxis group) and mild allergic reactions were documented in 20/39 patients (51.3%, mild reaction group). Seven patients had no symptoms after exposure to both species of shrimp (17.9%, control group). All patients with positive challenges developed symptoms during the challenge or immediately after the test completion; in addition, neither biphasic nor persistent anaphylaxis was observed. All of the patients in the mild reaction group had cutaneous involvement only. The most common symptom of the anaphylaxis group was the cutaneous system (100%) followed by the gastrointestinal (83.3%) and respiratory system (58.3%). None of the patients had cardiovascular symptoms. All patients in the anaphylaxis group indicated moderate severity in accordance to the anaphylaxis grading system of Brown.15
Table 1 summarizes the demographic data and allergic comorbidities of the 3 groups. There was no significant difference in the data among the 3 groups.
The median of MWD of commercial shrimp extract was 3.5 mm (IQR 3 mm, 95% CI 1.91-5.95 mm) for the control group, 3.25 mm (IQR 4.25 mm, 95% CI 3.15-6.70 mm) for the mild reaction group and 5.25 mm (IQR 5.5 mm, 95% CI 3.94-9.48) for the anaphylaxis group. There was no statistically significant difference in MWD among the 3 groups.
Consecutive total tryptase measurement
The median of the baseline total tryptase was 1.92 µg/L (IQR 1.83 µg/L, 95% CI 1.08-3.76 µg/L) for the control group, 1.58 µg/L (IQR 0.84 µg/L, 95% CI 1.30-2.22 µg/L) for the mild reaction group and 1.24 µg/L (IQR 0.91 µg/L, 95% CI 0.84-2.84 µg/L) for the anaphylaxis group. The median of baseline total tryptase values were not significantly different among the 3 groups.
The median of peak total tryptase was 2.02 µg/L (IQR 1.73 µg/L, 95% CI 1.14-3.87 µg/L) for the control group, 1.78 µg/L (IQR 0.93 µg/L, 95% CI 1.49-2.60 µg/L) for the mild reaction group and 2.77 µg/L (IQR 9.7 µg/L, 95% CI 2.09-9.23 µg/L) for the anaphylaxis group. Only 3 patients in the anaphylaxis group had a peak tryptase level above the manufacturer's cut off (11.4 µg/L).14 The median of peak total tryptase values were not significantly different among the 3 groups.
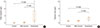
Fig. 1 shows the comparison of the median tryptase values between the baseline and peak tryptase of the 3 groups. The peak tryptase levels were significantly elevated compared to the baseline levels in the anaphylaxis group (2.77 vs 1.24 µg/L, P<0.05) and in the mild reaction group (1.78 vs 1.58 µg/L, P<0.05). There was no significant change of peak and baseline tryptase in the control group (2.02 vs 1.92 µg/L).
Delta-tryptase and tryptase ratio values among the 3 groups
The delta-tryptase and tryptase ratio were calculated. The median of the delta-tryptase was 0.07 µg/L (IQR 0.11 µg/L, 95% CI 0.03-0.14 µg/L) for the control group, 0.16 µg/L (IQR 0.28 µg/L, 95% CI 0.11-0.45 µg/L) for the mild reaction group and 1.42 µg/L (IQR 7.28 µg/L, 95% CI 0.95-6.69 µg/L) for the anaphylaxis group.
The median of the tryptase ratio was 1.02 (IQR 0.03, 95% CI 1.00-1.07) for the control group, 1.10 (IQR 0.27, 95% CI 1.05-1.31) for the mild reaction group and 2.22 (IQR 1.34, 95% CI 1.72-4.02) for the anaphylaxis group.
Fig. 2 shows the change in the total tryptase using the delta-tryptase and tryptase ratio among the 3 groups. The delta-tryptase values in the anaphylaxis group were significantly higher than in the mild reaction and control groups (1.42 vs 0.16 µg/L, P<0.001 and 1.42 vs 0.07 µg/L, P<0.001, respectively; Fig. 2A). Similarly, the tryptase ratio values in the anaphylaxis group were significantly higher than in the mild reaction and control groups (2.22 vs 1.02, P<0.001 and 2.22 vs 1.02, P<0.001, respectively; Fig. 2B).
ROC curve analysis
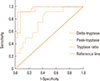
ROC curve analysis for tryptase measurements are presented in Fig. 3. ROC established the best cutoff of the peak tryptase at 2.99 µg/L whereas the manufacturer's cut-off was 11.4 µg/L. The delta-tryptase and tryptase ratio values performed significantly better than the peak tryptase values (P=0.009 using the delta-tryptase and P=0.015 using the tryptase ratio). The best cut-off to confirm anaphylaxis was ≥0.8 µg/L for the delta-tryptase and ≥1.5 for the tryptase ratio. There was no significant sensitivity and specificity difference to confirm the diagnosis of anaphylaxis between these 2 values. Table 2 summarizes the sensitivity, specificity, positive and negative LR of the peak tryptase, delta-tryptase and tryptase ratio using the best cut-off points; in addition, it shows that the tryptase ratio provided the best positive and negative LR.
DISCUSSION
Patients with a history of anaphylaxis were excluded from our prospective study due to ethical concerns; however, anaphylaxis was found in 30% of the patients. The severity of anaphylaxis was moderate and all patients responded well to emergency treatment. This was supported by a previous study which demonstrated that children with only previous mild reactions to food may suffer more severe reactions16 and that most fatal-anaphylactic reactions are unpredictable.17
The most common presentation of anaphylaxis in our study was cutaneous manifestation. The gastrointestinal (GI) involvement in our series was 83% (similar to other series) and indicated that the GI system was involved the most often in food-induced anaphylaxis.9 The GI symptoms in this study include nausea, vomiting, abdominal pain and diarrhea; therefore, the diagnostic criteria used at least 2 out of 4 organ involvements for the diagnosis of anaphylaxis since GI symptoms can be non-specific. None of our patients had cardiovascular symptoms upon challenges. This could be due to the close observation and immediate treatment after the onset of symptoms. In addition, other series also demonstrated that hypotension and shock are less common as early manifestations of childhood anaphylaxis.18
Human tryptases in the circulation consist mainly of mature or active β-tryptases and inactive pro-tryptases (α and β). The baseline levels of serum tryptase consist of pro-α and pro-β tryptases; however, mature β-tryptases are released by the degranulation of mast cells.19 The widely available tryptase assay from the Phadia ImmunoCAP system measures all forms of circulating tryptase. After the onset of anaphylaxis, serum tryptase reached its peak levels at 1-2 h and returned to baseline 24 hr after the complete resolution of symptoms.10,20 A clinical setting allowed a baseline tryptase sample to be collected at 24-48 hr after the symptoms resolve; therefore, we were able to obtain a baseline tryptase level prior to an anaphylaxis episode.
The tryptase level was considered elevated for only a small subset of patients in food induced anaphylaxis. Yunginger et al reported that only 6/8 of food-induced anaphylactic victims had an elevation of tryptase, compared to 9/9 of hymenoptera stings and 2/2 fatalities caused by diagnostic agents.21 Sampson et al. reported serial measurements of tryptase in five cases of food-induced anaphylaxis; however, they failed to detect tryptase in serum samples.8 A recent study by Sala-Cunill et al. demonstrated that peak tryptase levels were significantly higher in patients with drug induced anaphylaxis versus food-induced anaphylaxis.22 This study also showed that peak levels of tryptase depended on the anaphylaxis severtity.22 A lower peak tryptase level in food-induced anaphylaxis (compared to other forms of anaphylaxis) could be explained by the study of Schwartz et al. They reported that mucosal mast cells contained less tryptase compared to skin mast cells. Gut mucosal mast cells were expected to play a major role in food-induced anaphylaxis and might result in less tryptase released into circulation.23
Our study found a significant increase in the peak compared to baseline tryptase levels in patients with a mild reaction and the anaphylaxis group after shrimp challenges. However, only 3 patients had a peak tryptase level above the manufacturer's cut off. It was likely that the anaphylaxis conditions of our patients were in the moderate severity and the peak tryptase levels were not as high as severe anaphylaxis.22,24 Nevertheless, other patients with anaphylaxis could have missed this severe allergic reaction if we relied on a single peak tryptase value that lacked adequate sensitivity.
Consecutive tryptase measurements were suggested by a number of studies. In a series described by Brown et al., a serial tryptase measurement was significantly elevated in patients with anaphylaxis.11 Peak tryptase levels had a sensitivity of 36% and a specificity of 93% using the recommended cut-off range whereas the delta-tryptase ≥2.0 µg/L had a sensitivity of 73% and a specificity of 98%. Enrique et al. investigated the usefulness of a reaction-tryptase/baseline-tryptase ratio and found that the ratio was 2.85 in anaphylactic and 1.29 in non-anaphylactic groups.25 A recent study by Borer-Reinhold et al. reported that a relative tryptase increase to ≥135% of the baseline value suggested anaphylaxis even if the peak tryptase was below 11.4 ng/mL.26
Our study supported the above studies to use a delta-tryptase or tryptase ratio instead of a single peak tryptase value for the confirmation of anaphylaxis. We demonstrated (through the use of an ROC to determine the best cut-off) that the delta-tryptase or tryptase ratio provided a higher sensitivity, specificity, positive LR and lower negative LR compared to a single peak tryptase value. Among all the values, the tryptase ratio provided the best positive and negative LR followed by delta-tryptase.
The strength of our prospective study was that each case clearly satisfied the recent definition of anaphylaxis with unequivocal signs of a systemic mediator release in a control situation. Limitations of our study were the small number of cases and the single measurement of total tryptase levels at 60 min after the onset of symptoms. Some authors suggest serial tryptases for optimum results since anaphylaxis to food allergens can develop more slowly or be biphasic24,27, however, this procedure cannot be applied under routine conditions.
In conclusion, we recommend that the measurement of the peak tryptase should be compared with baseline values. The calculations of tryptase ratio and/or delta-tryptase values are more helpful than a single peak serum tryptase for the diagnosis of shrimp-induced anaphylaxis.


 XML Download