

 PDF
PDF ePub
ePub Citation
 Print
Print


INTRODUCTION
Allergic rhinitis was conventionally classified into seasonal allergic rhinitis (SAR) and perennial allergic rhinitis (PAR) based on time of exposure.1 The common allergens for PAR include indoor allergens such as house dust mites (HDMs), molds, and cockroaches, while those for SAR are usually outdoor allergens such as tree pollen, grass pollen, weed pollen and molds.2
Some patients sensitized to seasonal allergens have symptoms throughout the year and some patients sensitized to perennial allergens have symptoms during specific seasons. Additionally, many patients are sensitized to both perennial allergens and seasonal allergens simultaneously. The conventional classification has some limitations from a therapeutic standpoint due to its poor association with clinical symptoms. In 2001, the World Health Organization (WHO) proposed a new Allergic Rhinitis and its Impact on Asthma (ARIA) classification, which classifies allergic rhinitis according to severity and symptom duration.3
While there have been a few studies of the peak seasons of pollens in Korea, few have reported associations between the clinical symptoms of allergic rhinitis and the pollen season.4 In addition, although the ARIA classification was introduced about 10 years ago, it is still not widely used and the conventional SAR/PAR classification is still commonly used in clinical settings.
We aimed to evaluate the seasonal specificity of seasonal allergens in patients with allergic rhinitis and to validate the ARIA classification by comparing it with the conventional SAR/PAR classification in terms of symptoms and quality of life score.
MATERIALS AND METHODS
Subjects
From December 2009 to April 2011, 226 consecutive subjects (mean age, 23.7±14.5 years; M:F=144:82) who visited the allergy clinic at Dankook University Hospital with typical symptoms of allergic rhinitis were prospectively included in this study, and retrospective chart reviews were performed to collect data. All subjects underwent skin prick tests and completed questionnaires. Allergic rhinitis was confirmed by the presence of typical symptoms and skin prick test results. This study was approved by the Internal Review Board of Dankook University Hospital, and all patients provided written informed consent.
Symptom questionnaires
Subjects completed two questionnaires, one associated mainly with AR demographics and seasonal symptoms and the other with sinonasal outcome test (SNOT)-20. The first was completed after the initial diagnosis of allergic rhinitis and the second was completed during every visit to the clinic.
The first questionnaire had the following structure:
Demographic data - habitation (city/country).
Previous medical diagnosis of AR, asthma.
AR-related symptoms and severity (six-point visual analogue scale): runny nose, sneezing, blocked nose, itchy nose, itchy eyes and skin, skin eczema, dyspnea, wheezing, and overall discomfort.
Seasonal occurrence and severity of symptoms (spring, summer, fall, winter, throughout the year).
ARIA classification-related questions.
The nine symptoms are generally characteristic of allergic rhinitis or rhinoconjunctivitis and the patients were asked to rate them according to severity on a six-point visual analogue scale from zero (absent) to five (severe). In terms of seasonal severity, subjects were requested to select those season(s) in which they experienced allergic symptoms and to rate the severity of each season on a six-point visual analogue scale from zero (absent) to five (severe).
Another questionnaire including SNOT-20 was completed by the patients during every visit to the clinic. The first was filled out before treatment.
Skin prick tests
Skin prick tests for 50 common aeroallergens were performed as part of the evaluation, with histamine phosphate (histamine base concentration 1 mg/mL) and glycerinated phenol saline as the controls. All tests were performed with a standard technique (using a single-headed lancet) and were read by a single experienced technician who was blinded to the clinical symptoms. The aeroallergens included HDMs (mixed), mixed feathers, cockroach, cat, dog, molds (Aspergillus, Alternaria, Mucor, Rhizopus, Trichophyton and Penicillium), and pollens common to the country (tree pollens: B3, Alder, Elder, Hazel, Poplar, Elm, Willow, Ash, Birch, Beech, Oak, and Plane; grass pollens: B2, Cocksfoot, Maize, Ryegrass, Orchard, and Timothy; weeds: Dandelion, Mugwort, Ragweed, Plantain and Hop. J.).
For each allergen, we measured both the largest diameter of the wheal and the diameter orthogonal to it, and we then calculated the mean. A positive reaction was defined as a mean wheal diameter greater than or equal to that of histamine (positive control). All saline controls were negative. Patients were considered allergic if they had at least one positive SPT to any of the allergens tested.
Conventional SAR/PAR classification and ARIA classification
According to the sensitizing allergens identified using skin prick tests, AR was subdivided into PAR, SAR, and PAR+SAR. Patients who were sensitized to indoor allergens such as HDMs, molds and/or animal dander (feathers) were classified into the PAR group and those who were sensitized to outdoor allergens such as pollen (tree, grass, weed) were classified into the SAR group. With regard to polysensitized patients, those who were sensitized to both indoor allergens (mostly HDMs) and pollen were classified into the PAR+SAR group.
Based on a questionnaire item (the ARIA classification), allergic rhinitis cases were divided into 'intermittent' (rhinitis less than 4 days per week or less than 4 consecutive weeks per year) or 'persistent' (rhinitis more than 4 days per week and more than 4 consecutive weeks per year). Also, the severity of allergic rhinitis was classified into 'mild' or 'moderate/severe' depending on the impairment of quality of life (QOL), school, work and sleep.
Data evaluation and statistical analysis
On the basis of a questionnaire item ("When do allergic symptoms mainly occur?"), we tried to evaluate the seasonal specificity of the seasonal allergens in the SAR group. We excluded cases in which the seasonal severity of symptoms was the same for several allergens, which enabled the patients to repeatedly select seasons in which symptoms often occurred.
To identify the validity and correlation of the two classifications (PAR/SAR and ARIA classification), the symptoms score and the SNOT-20 score in each group were evaluated.
Student's t-test was used to evaluate differences between the groups and chi-square tests were used to compare the SAR/PAR and ARIA classifications. All parametric data are expressed as means±standard deviations. Statistical significance was assumed at P values <0.05 for all parameters.
RESULTS
Among 226 patients, 60 (26.5%) had PAR, 48 (21.2%) had SAR and 118 (52.2%) had perennial and seasonal AR, showing that PAR+SAR was dominant in Korea. According to the ARIA classification, 79 patients (35.0%) had intermittent allergic rhintis (IAR) and 147 (65.0%) had persistent allergic rhinitis (PER). Among the patients with IAR, 52 had mild symptoms and 27 had moderate-to-severe symptoms. Among the patients with PER, 44 had mild symptoms and 103 had moderate-to-severe symptoms.
Seasonal specificity of seasonal allergens
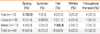
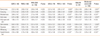
Out of 48 patients with SAR, eight who were sensitized to multiple seasonal allergens were excluded from the analysis. Six patients sensitized to tree pollen showed symptoms mostly during spring. Patients sensitized to grass pollens reported that they had allergic symptoms either throughout the year (7/16), or in spring or winter (4/16). Twelve patients sensitized to weed pollens reported that they had symptoms during spring (6/12) and fall (7/12). It has often been reported that tree pollens are prevalent during spring, grass pollens during summer and weed pollens during fall. The subjective symptom durations were not consistent with the peak seasons of the pollens and most patients with SAR reported that they had symptoms during spring and fall (Table 1).
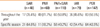
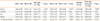
Of the patients with PAR, 49 (81.7%) reported that they had symptoms throughout the year, a significantly higher percentage than that for patients with SAR and PAR+SAR (35.4% and 50.8%, respectively; P<0.001). However, 36 (45.6%) of the patients with IAR reported that they had symptoms throughout the year; this was not significantly different than that for patients with PER (83/147, 56.5%, Table 2).
Cross-tabulation of the SAR/PAR and ARIA classifications
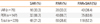
Regardless of the PAR/SAR classification system, about two-thirds of the patients (63.6-66.7%) had persistent rhinitis, whereas one-third had intermittent allergic rhinitis, showing that there was no association between the two classification systems (P>0.05, Table 3). The data in Tables 2 and 3 show that PER was different from having symptoms throughout the year.
Demographic data
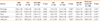
We compared the demographic data of the SAR/PAR/PAR+SAR patients with those of the IAR/PER patients. There were no significant differences in percentage city habitation, history of atopic dermatitis, history of asthma, family history of allergic rhinitis/asthma, and carpet use; however, there were significant differences in terms of age and gender ratio among patients with SAR, PAR, and PAR+SAR. There was no difference between the IAR and PER patients except for a family history of allergic rhinitis/asthma (P=0.009), with a higher percentage of patients with PER having a family history of allergic disease (Table 4).
Validation of the ARIA classification according to symptom score severity
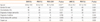
There were no significant differences in symptom scores between the SAR, PAR, and PAR+SAR patients. However, there were significant differences for most of the symptoms between the IAR and PER patients, except for itchy eyes and skin eczema. In addition, there were significant differences in symptom scores between the mild group and the moderate-to-severe group, except for itchy eyes and skin. These findings suggest that the ARIA classification represented symptoms better than did the SAR/PAR classification (Table 5).
Validation of the ARIA classification according to seasonal symptom scores
Seasonal symptom scores were evaluated according to the two classification systems. There were no differences in the seasonal symptom scores for SAR, PAR, and PAR+SAR patients, except for those for spring. However, there were significant differences in seasonal symptom scores between the IAR and PER patients and between the mild group and the moderate-to-severe group, except those for summer (Table 6).
Validation of the ARIA classification with the SNOT-20 scores
We next compared SNOT-20 scores, which represent quality of life, according to the two classification systems. There were no differences in total scores or domain scores between the SAR, PAR, and PAR+SAR patients. The total SNOT-20 scores for the IAR and PER patients were 27.7±16.6 and 36.1±21.3, respectively, and this difference was significant (P=0.007). The scores for the rhinologic, sleep and psychological domains, but not the ear/facial symptoms domain, were also significantly higher in PER patients, which indicates a good correlation between the ARIA classification and SNOT-20, the quality of life score. In terms of severity groups, the SNOT-20 scores showed similar results. The moderate-to severe-group showed higher SNOT-20 scores in every domain, suggesting that the SNOT-20 score was also representative of severity (Table 7).
DISCUSSION
SAR is induced by outdoor allergens, and there are significant differences not only in the allergens' distribution, but also in their seasonal peaks, from location to location. In Korea, tree pollens have seasonal peaks in spring, grass pollens in summer and weed pollens in fall.4 In this study, we investigated whether seasonal allergens could produce symptoms specifically during the pollen peak season, and showed that symptoms became severe during spring and/or fall, irrespective of the seasonal allergen. One explanation for this mismatch between symptoms and allergens is that the symptoms are influenced by multiple environmental factors other than the offending allergens, such as temperature changes, weather or humidity changes, air pollution, etc. Symptoms can also be affected by personal factors such as patient mood and psychological factors.7 Moreover, most patients are sensitized to multiple allergens and are exposed throughout the year, so it is difficult to clearly define pollen seasons. Also, due to the priming effect on the nasal mucosa of low levels of pollen allergens and the minimal inflammation of the nose in patients with symptom-free rhinitis, symptoms do not necessarily strictly occur in conjunction with the allergen season. For these reasons, we assume that the symptoms do not strictly match the pollen season and identifying the offending allergens cannot predict when symptoms are most severe.
We also showed that the conventional SAR/PAR/PAR+SAR classification did not match the intermittent and persistent allergic rhinitis classification system. More than 60% of patients with SAR showed persistent symptoms and 33% of those with PAR had intermittent symptoms, indicating that these classification systems cannot be used interchangeably. The WHO proposed the ARIA classification because the conventional SAR/PAR classification is unsatisfactory and does not represent clinical symptom status.3 Our data also showed that the ARIA classification system is more appropriate than the previous SAR/PAR classification since the ARIA classification system was correlated better with symptoms and QOL status. The ARIA classification was introduced about 10 years ago. However, it is not frequently used in clinical settings; the conventional SAR/PAR classification is likely more frequently used in Korea. The ARIA classification represented symptoms and SNOT-20 better than did the conventional SAR/PAR classification in every respect; the SAR/PAR classification did not reflect either clinical symptoms or SNOT-20.
A few studies have attempted to validate the ARIA classification.2,8 One large cross-sectional study reported that 43.7% of SAR patients had persistent rhinitis and 44.6% of PAR patients had intermittent rhinitis.2 That study reported only the inconsistency of the two classification systems and did not present clinical symptom or QOL data. Another study reported no association between the SAR/PAR and ARIA classifications, and that patients with moderate-to-severe AR had severe symptoms and worse QOL scores.8 Our data are consistent with these previous reports, and patients with persistent AR had a higher frequency of a family history of allergic diseases, more severe symptoms and higher SNOT-20 scores.
One interesting finding was that the symptom score during summer was higher than or equivalent to that during other seasons, although the percentage of patients complaining of symptoms was lowest during summer. Thus, those who had symptoms during summer had worse or equivalent symptoms compared with those who had symptoms during other seasons, although fewer persons suffered during summer.
SNOT-20 is a QOL instrument comprising 20 questions, divided into four domains; rhinologic, ear/facial symptoms, sleep and psychological. Only the ear/facial domain showed no difference between the IAR and PER patients and the ear/facial domain score was the lowest of all the domain scores, suggesting that allergic rhinitis had little influence on ear/facial symptoms. The rhinologic, sleep and psychological domains showed significant differences between the IAR and PER patients and between the mild group and the moderate-to-severe group. This suggests that the ARIA classification reflects not only the symptoms' duration and severity, but also QOL.
This study has some limitations. First, the number of patients was relatively small. Although some meaningful data were generated, its statistical significance would be increased if more patients were included. Second, we divided the seasons into spring, summer, fall and winter. Usually, symptoms of allergic rhinitis are aggravated during changes of season; however, this conventional season classification does not represent the exact seasonal aggravation of symptoms, especially during changes of season. The four conventional seasons were used for simplicity of interpretation.
In conclusion, seasonal allergens were not specific to the pollen peak season in terms of the severity of symptoms in Koreans, and the ARIA classification better represented both allergic symptoms and quality of life than did the SAR/PAR/PAR+SAR classification. Therefore, the ARIA classification is more appropriate in most clinical settings.
 XML Download