

 PDF
PDF ePub
ePub Citation
 Print
Print


INTRODUCTION
Anaphylactic shock is characterized by a decrease in effective circulating blood volume due to a possible shift of intravascular fluid to the extravascular space caused by increased vascular permeability.1 The real circulating blood volume loss in humans is 35% (due to increased fluid extravasation) within 10 min after the onset of systemic anaphylaxis.2 Excessive accumulation of extravascular fluid in the interstitium results in edema formation in particular tissues and organs. Anaphylaxis sometimes is accompanied by laryngeal edema that causes asphyxiation and can result in fatality.3-5 In contrast, the occurrence of brain edema is not well known during systemic anaphylaxis.6,7 The vasculature of the brain has a blood-brain barrier (BBB) that can prevent plasma extravasation in normal circumstances. However, symptoms of the central nervous system (CNS) such as aura of impending doom, uneasiness, throbbing headache, dizziness, confusion, and tunnel vision are reported in patients with anaphylaxis.6,7 CNS involvement is reported in up to 15% of anaphylaxis episodes.6 CNS symptoms are generally considered secondary to hypotension; however, there is a possibility that they may be related to brain lesions and edema induced by a direct insult of anaphylaxis.
Cerebral edema is described as an excess accumulation of water in brain tissue and is classified into 2 categories: vasogenic and cytotoxic edema.8,9 Vasogenic edema is caused by a BBB breakdown; however, cytotoxic edema is caused by an energy depletion of neurons due to microcirculatory failure.10,11 Magnetic resonance imaging (MRI) is a powerful and sensitive in-vivo technique that allows the sequential investigation of changes in the water content of the brain as well as other organs. The apparent diffusion coefficient (ADC) of water is sensitive to cytotoxic edema;12 however, elevated values of T2-relaxation time (T2RT) and the nuclear MR transverse relaxation time of water, detect vasogenic edema.13 No studies have yet determined if MRI detects edema in the brain or larynx during systemic anaphylaxis.
We used the MRI technique for anesthetized rats suffering from anaphylactic hypotension to assess the occurrence and time course of the different forms of edema in the brain and larynx. In addition, to depict the characteristics of anaphylactic hypotension, we compared MRI during anaphylactic hypotension versus hypotension induced by a vasodilator sodium nitroprusside (SNP) that decreased the blood pressure in a manner similar to anaphylactic hypotension. We also assessed the edema of the larynx and brain with histological examination and brain water content measurement, respectively.
MATERIALS AND METHODS
Animal preparations
The experiments in the present study were approved by the Animal Research Committee of Kanazawa Medical University. Thirty-five male Sprague-Dawley rats (Japan SLC, Shizuoka, Japan) weighing 500±28 g were maintained at 23℃ under pathogen-free conditions on a 12:12-h dark/light cycle with food and water allowed ad libitum.
Two groups were studied for the MRI experiment: 1) The anaphylaxis group (n=7) of rats sensitized with ovalbumin by the subcutaneous injection of an emulsion made by mixing complete Freund's adjuvant (0.5 mL) and 1 mg ovalbumin (grade V, Sigma, St. Louis, MO, USA) -containing saline (0.5 mL) 2 weeks before the experiment.14 2) The SNP group (n=7), in which SNP was injected to non-sensitized rats.
Rats were anesthetized with pentobarbital sodium (50 mg kg-1, ip) and placed supinely on a heating pad (ATC-101B; Unique Medical, Tokyo, Japan) that maintained the body temperature at 36-37℃. The trachea was cannulated with a polyethylene tube (2 mm ID). The mean arterial blood pressure (MAP) was recorded from the right femoral artery, using transducers (TP-400T, Nihon-Kohden, Tokyo, Japan) with the reference level of right atrium. The left femoral vein was catheterized for the administration of antigen and saline.
MR Imaging
Rats were placed in a MRI imager table with their head fixed in a body restrainer. All MRI examinations were performed with the 3.0-T MR unit (Magnetom Trio, A Tim system T-Class VB17, Siemens, Germany) using a 7-cm Loop coil. Baseline MRI consisted of the following 4 different images: 1) a sagittal T1-weighted image (T1WI), 2) a sagittal T2-weighted image (T2WI), 3) a sagittal T2WI for the quantitative T2 map, and 4) a coronal diffusion-weighted image (DWI). 1) T1WI were acquired by a fast spin-echo (FSE) sequence (repetition time [TR], 500 msec; echo time [TE], 15 msec; matrix, 256×256; field of view [FOV], 50 mm; slice thickness, 2 mm; band width, 150 Hz/Px; echo train length, 2; No. of averages, 1; total acquisition time, 2 min 11 sec). 2) T2WI were acquired by a FSE sequence (TR, 3,800 msec; TE, 83 msec; matrix, 256×256; FOV, 50 mm; slice thickness, 2 mm; band width, 215 Hz/Px; echo train length, 12; No. of averages, 1; total acquisition time, 3 min 34 sec). 3) T2WI for the quantitative T2 map were acquired by multi-echo SE sequence (TR, 1,000 msec; TE, 13.8, 27.6, 41.4, 55.2, 69.0, 82.8, 96.6, and 110.4 msec; matrix, 256×256; FOV, 50 mm; slice thickness, 2 mm; band width, 286 Hz/Px; echo train length, 1; No. of averages, 1; total acquisition time, 3 min 30 sec). 4) DWI were acquired using b values of 0 and 800 sec/mm2 by single-shot echo-planar imaging sequence (TR, 4,000 msec; TE, 73 msec; matrix, 64×38; FOV, 64 mm; slice thickness, 2 mm; band width, 1,100 Hz/Px; echo train length, 38; No. of averages, 15; total acquisition time, 4 min 6 sec).
One set of post-injection MRI consisted of the same images as the baseline (except the T1WI) and approximately 11 min was required to accomplish one MRI examination set. Four sets of MRI examinations were repeatedly performed after antigen or SNP injections.
Protocol of the MRI experiment
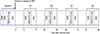
After the baseline measurement of MAP and MRI, the sensitized rats for the anaphylaxis group (n=7) were intravenously injected with 0.6 mg ovalbumin antigen, and the non-sensitized rats for the SNP group (n=7) were subcutaneously injected with SNP (3 mg/kg) so that MAP decreased in a manner similar to the anaphylaxis group. The first set of MRI examinations started at 6 min after injection of the antigen or SNP and were followed repeatedly by 3 sets of examinations up to 68 min (Fig. 1).
Quantification of ADC and T2RT
Map images of ADC and T2RT were generated by in-line image post-processing of the data derived from DWI and T2WI for the quantitative T2 map, respectively. The T2RT and ADC for the brain were calculated from regions of interest (ROI) placed within the cortex (1 ROI), hypothalamus (1 ROI) and the basal ganglia (1 ROI) on both hemispheres; subsequently, average values of the right and left hemisphere were adopted. T2RT (but not ADC) was also obtained from the larynx.
Histological investigation of the larynx
At 70 min after injection, the animals were euthanized using pentobarbital sodium, followed by the removal of the larynx for histological investigation. The excised larynx was immersed in a 10% buffered formalin solution. Following embedding in paraffin, sagittal sections of the specimen were made at 5 µm and stained with hematoxylin and eosin.
Histological investigation of the brain
The localization of mast cells in the hypothalamus was investigated after an injection of the antigen (n=3) or SNP (n=3) in anesthetized rats whose MAP was measured in the same manner described above. At 70 min after the injection, rats were perfused intracardially with ice-cold saline followed by 4% paraformaldehyde (Sigma) in phosphate-buffered saline. The brains were removed, postfixed in 4% paraformaldehyde in phosphate-buffered saline at 4℃ overnight, and cryoprotected in 30% sucrose. The brains were then sliced using a cryomicrotome (CM1900, Leica, Germany) into 40 µm-thick sections. Each section was stained with aqueous toluidine blue (pH 7.4). Images of the slices were examined under a microscope (BZ-8100, Keyence, Japan) and the number of mast cells counted.
The brain water content measurement experiment
Brain water content was measured using the wet/dry method.15,16 Fifteen separate rats were assigned to the 3 groups of the anaphylaxis (n=5), SNP (n=5) and control (n=5) groups. The rats in the anaphylaxis and SNP groups were subjected to systemic hypotension in the same manner described above; subsequently, the brains were removed at 70 min after injection. The rats in the control group were not administered antigen or SNP and the brains were removed after anesthesia with pentobarbital. The brains were weighed on preweighed squares of aluminum foil and weighed again after drying at 100℃ for 24 h in a drying oven to evaporate all water content. Brain water content was calculated using the following formula: (wet weight-dry weight)/wet weight×100%.
Statistics
All results are expressed as the mean±SD. For the statistical analysis, a comparison of the MAP data within a group was made by the repeated measure analysis of variance followed by the Bonferroni post-hoc test correction method. A comparison of the data between the 3 groups and the 2 groups was made by one way analysis of variance and Student t-test, respectively. A significance was assumed when the P value was less than 0.05 (2 tailed). Differences in the number of mast cells in the hypothalamus between the anaphylaxis and SNP groups were compared using a Mann-Whitney test.
RESULTS
MAP changes
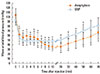
Fig. 2 shows the summarized data of MAP. MAP decreased from the baseline of 104±15 mmHg to the nadir of 35±5 mmHg at 10 min after the antigen was injected intravenously into the anaphylaxis group rats; subsequently, the MAP returned to 67±15 mmHg at 70 min after the antigen. In the SNP group, MAP decreased in a manner similar to the anaphylaxis group; however, it decreased and recovered faster than the anaphylaxis group. No animals died during the experimental period.
Quantification of ADC-Value and T2RT in MRI
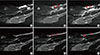
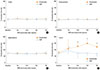
Fig. 3 shows the DWI of the brain in an anaphylaxis group rat at baseline and the first, second, third and fourth examinations after the injection of the antigen. The average ADC values obtained from the right and left regions were used as brain ADC values (Fig. 3A). The baseline ADC values in the anaphylaxis group were 692±20, 639±16, and 893±118 10-6 mm/sec for cortex, basal ganglia, and hypothalamus, respectively. These values were not significantly different from the corresponding baseline values in the SNP group. The ADC values did not significantly change after the injection of antigen or SNP (data not shown). Fig. 4 shows examples of the sagittal T2WI in the anaphylaxis and SNP groups. In either group, apparent changes in the brain were not observed after injection; in addition, T2RT did not significantly change in the brain at the cortex, basal ganglia, or hypothalamus after injections of either the antigen or SNP (Fig. 5). In contrast to the brain MRI, high signal intensity on T2WI was observed in the larynx as early as 10 min after the injection of antigen in the anaphylaxis group (Fig. 4). The significant increase in T2RT were found at the first examination within 13 min after the antigen injection (Fig. 5). Thereafter, the T2RT value increased to a peak of 2-fold baseline in the third examination and then tended to recover towards the baseline on the final fourth examination of 68 min. In contrast, the SNP group showed no significant changes in the T2RT value of the larynx while showing systemic hypotension comparable to the anaphylaxis group.
Histology of the larynx
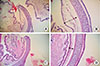
The postmortem histology of the larynx revealed the presence of edema in the epiglottis of the rats subjected to anaphylaxis; however, not in rats administered SNP (Fig. 6). The thickness of the subepithelial space of the epiglottis (i.e. the length from the epithelial cells to the cartilage) was significantly greater in the anaphylaxis group (310±56 µm) than in the SNP group (151±37 µm).
Histology of the brain
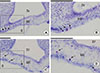
We further examined the number and localization of mast cells in the hypothalamus of the brain obtained from the rats administered antigen or SNP. MAP decreased in a manner similar to that of the MRI study (data not shown). Mast cells were identified as cells that contained numerous metachromatic red-purple granules stained with toluidine blue. Fig. 7 shows representative photomicrographs in which 3 mast cells were observed in the median eminence (ME) of both the anaphylaxis and SNP group rat hypothalamus. Mast cells were found exclusively in the ME, but not in other regions of the hypothalamus. Neither mast cell showed degranulation in any sections studied. The number of mast cells in the ME was not significantly different between the anaphylaxis (44±10 mast cells, n=3) and SNP (53±12 mast cells, n=3) groups as determined by a Mann-Whitney test (P=0.28). These findings suggest that anaphylactic reaction did not occur in the hypothalamus of rats with anaphylaxis.
Brain water content
This experiment was conducted on rats different from those in the MRI experiments. MAP in the anaphylaxis and SNP group decreased in essentially the same manner as the MRI study. There were no significant differences in brain water content among the three groups (anaphylaxis, 77.1±0.3%; SNP, 77.2±0.3%; control, 77.2±0.2%), indicating that brain edema was not present in either the anaphylaxis or SNP group.
DISCUSSION
The major finding of the present study is that MRI hyperintensity was observed in the larynx but not in the brain during anaphylactic hypotension; however, no changes in the MRI of either organ occurred during vasodilator-induced hypotension. Epiglottic edema was morphologically confirmed in rats with anaphylaxis, but not with SNP. The brain water content in the anaphylaxis or SNP group was the same as the control group and indicated the absence of brain edema in rats with anaphylaxis or SNP. The results indicate that laryngeal edema (but not brain edema) occur in anesthetized rats suffering from anaphylactic hypotension.
This is the first study to demonstrate that no changes in either ADC or T2RT of MRI (markers of water content) were observed in the brain of rats suffering from anaphylaxis; this suggests the absence of brain edema during anaphylaxis. If brain edema had occurred, it should be detected as either decreased ADC or high T2RT values or hyperintensity, as observed in the larynx of the rats with anaphylaxis. The lack of brain edema was subsequently confirmed by the direct measurement of the brain water content: the brain water content of the anaphylaxis group (77.1%±0.3%) was nearly identical to the non-hypotensive control group (77.2%±0.2%), which was comparable to the normal values previously reported.15,16
There were 2 rationales to examine brain edema during anaphylaxis: the first was related to vasogenic brain edema and the second to cytotoxic brain edema. The first rationale was based on the following lines of evidence: Water entrance through BBB opening leads to a vasogenic edema formation of the brain. In this respect, anaphylaxis-released mediators such as histamine, tryptase, chymase, bradykinin, prostanoids, leukotrienes, and other substances could increase BBB permeability.17 In addition, mast cells (the key cells which release the aforementioned mediators in response to the antigen during anaphylaxis) are resident within the cerebral microvasculature.18-21 These brain mast cells have been recently reported to play a potentially deleterious role in the very early phase of brain injury from cerebral ischemia and/or hemorrhage through their rapid action on cerebral vessels; activated brain resident mast cells cause BBB disruption and resultant vasogenic brain edema.18 Mast cells are densely distributed in the rat hypothalamus,19,20 which is devoid of BBB, and therefore could be sensitized and activated by the antigen ovalbumin administered subcutaneously and intravenously, respectively. However, in the present study, mast cells were found in the hypothalamus of rats with anaphylaxis (Fig. 7) and their number was not different from the SNP group. Our histological study suggests that the degranulation of brain mast cells did not occur in anaphylactic rats since degranulated mast cells could not be detected by toluidine blue staining. The number of metachromatically stained mast cells should have decreased (compared to SNP-treated rats) if the mast cells had been degranulated or activated. We were unable to find granules outside the mast cells. The absence of activation of brain mast cells in rat anaphylaxis is contrasted with the result in canine anaphylaxis in which an intravenous injection of IgE antigen caused an anaphylactic reaction in the hypothalamus.21 The reason for these differences may be related to species difference. The different method of sensitization may also explain the discrepancy: passive sensitization in the dog study21 versus active sensitization in the present study. The absence of anaphylactic reaction in the hypothalamus may be consistent with the result that the T2RT values (which reflect accumulated extravascular water) were not increased in the hypothalamus of rats with anaphylaxis. Another reason for the absence of vasogenic brain edema, may be related to anaphylaxis-induced low MAP that inevitably results in decreased cerebral capillary pressure, one of the determinants of transvascular fluid movement according to the Starling equation.22 In addition, an increase in the extravascular fluid might be too small to detect by MRI or brain water measurement even if brain mast cells had reacted to the antigen with an increased BBB permeability.
The second rationale in regards to the occurrence of cytotoxic brain edema could be due to anaphylaxis-induced systemic hypotension that caused cerebral hypoperfusion and hypoxia that resulted in hypoxic brain injury and edema. This possible hypoxic lesion was expected to be detected as a decrease in the ADC of a brain MRI.12,13,23 However, the ADC did not change throughout the experimental period of the present study. A possible explanation for the absence of cytotoxic edema or ADC change could be due to systemic hypotension in rats with anaphylaxis or SNP insufficient in severity and duration to evoke brain injury due to hypoperfusion and hypoxia. MAP decreased substantially to the bottom of 35 mmHg at 10 min; however, thereafter MAP gradually recovered to 67 mmHg at 70 min after the injection of antigen (Fig. 2). We assume that this transient hypotensive insult was inadequate to induce hypoxic brain injury compared to severe brain ischemia from middle cerebral artery occlusion.23
There are several clinical reports on MRI of patients suffering from anaphylactic shock. Most show images compatible with ischemic lesions due to hypoperfusion secondary to prolonged systemic hypotension.24-26 Notably, the presence of brain edema was not referred in the MRI of these patients24-26 (except cytotoxic edema of the basal ganglia and cortex), which did not develop in a sustained comatose patient until 4 days after the onset of anaphylactic shock and was secondary to hypoxic brain injury.27 The time points when the MRI was obtained in these patients were subsequent to those of the present study;24-27 therefore, these clinical results cannot be properly compared to the present study. As early as up to 70 min after exposure to antigen, brain edema seems not to accompany the non-fatal rat anaphylactic shock model of the present study.
We show for the first time that laryngeal edema could be detected through hyperintensity images in MRI during experimental anaphylaxis. The morphological investigation of the larynx (removed 70 min after the antigen injection) confirmed the presence of epiglottic edema. Laryngeal edema is a frequent finding in human anaphylaxis with a potentially fatal outcome.5 In rats, this lesion of the laryngeal edema seems to account for the fatality of rats subject to anaphylaxis. In our preliminary study, 60% of the anesthetized and supinely positioned rats without tracheotomy (3 of 5 rats examined) died within 15 min after antigen injection due to asphyxia. All rats in this present study were tracheotomized and intubated with a polyethylene tube; subsequently, they were alive throughout the experimental period of 70 min even if substantial anaphylactic hypotension occurred.
We found hyperintensity and increased T2RT of MRI in the larynx in anesthetized rats with anaphylaxis as early as 13 min after antigen. This is consistent with a clinical report that laryngeal edema began to develop 1 min after exposure to the antigen.4 In addition, an early occurrence of increased vascular permeability is reported in rats with anaphylaxis: macromolecular capillary leakage started within the first 3 min after anaphylactic shock onset, followed by a progressive 25-fold increase in the first 10 min of anesthetized rats.3
MRI in anesthetized rats subjected to anaphylactic hypotension showed no changes in ADC or T2RT in the brain; however, it showed hyperintensity (as reflected by elevated T2RT) in the larynx as early as 13 min after antigen injection. Epiglottic edema was confirmed in the histological examination and the absence of brain edema was confirmed by the brain water content measurement. No changes in MRI or histology of the larynx were found in SNP-injected rats. In conclusion, edema is detected with the MRI technique in the larynx but not in the brain during anaphylactic hypotension in anesthetized rats.

 XML Download