

 PDF
PDF ePub
ePub Citation
 Print
Print


INTRODUCTION
The forced oscillation technique (FOT) is a noninvasive method for measuring respiratory impedance, the spectral relationship between pressure and airflow.1 The real part of impedance is called respiratory system resistance (Rrs), whereas the imaginary part is called respiratory system reactance (Xrs), which is supposed to reflect elastic and inertial properties of the lung. Forced oscillations are superimposed on tidal breathing, avoiding the need for any special breathing maneuver or noticeable interference with respiration. The impulse oscillation system has been introduced as a commercially available version of multi-frequency FOT2 and clinical applications have progressed recently. Increasing numbers of reports have examined the usefulness of the impulse oscillation system for the evaluation or management of obstructive diseases, including chronic obstructive pulmonary disease (COPD) and asthma.3-5
Oscillatory properties of the respiratory system are generally expressed as a single curve of Rrs and Xrs versus frequency; however, technical advances in the measurement of impulse oscillation have made it possible to obtain images with excellent time resolution that are sufficient for identifying variation in respiratory cycles. Recently, Kurosawa et al.6 developed a new FOT device with color 3D imaging and a time axis for visualizing respiratory cycle dependence: it indicated that Rrs was higher and Xrs was more negative in the expiratory phase compared to the inspiratory phase. Also, this apparatus clearly showed the frequency dependence of Rrs during expiration and inspiration: Rrs increased at lower frequencies and declined with increasing frequency in COPD. We previously showed that within-breath analyses of respiratory impedance can be used to distinguish between patients with COPD and those with asthma, and that color 3D imaging of respiratory impedance provides disease-suggestive patterns;7 however, different color 3D imaging patterns can occur in patients with the same disease. In the present cross-sectional study, we examined the usefulness of color 3D imaging of respiratory impedance using a commercially available FOT device, MostGraph, in patients with asthma.
MATERIALS AND METHODS
Subjects
Seventy-eight patients with asthma who attended outpatient clinics at Shizuoka General Hospital for routine check-ups between June 2010 and October 2011 were enrolled. All patients satisfied the definition of asthma of the Global Initiative for Asthma8 and had been receiving inhaled corticosteroids with or without other medications, including long-acting β2-agonists, leukotriene receptor antagonists, and sustained-release theophylline, for at least 6 months. Treatment steps for asthma were determined according to the classification of the Japanese guideline for adult asthma.9 Patients were excluded from the study if they: 1) had any acute viral infections within 1 month before the study; 2) were current smokers, had a smoking history of >10 pack-years, or had quit smoking within 1 year prior to the study; or 3) had COPD or other airway diseases such as bronchiectasis and bronchostenosis.
The protocols were approved by the local ethics committee and informed consent was obtained from all patients prior to the study.
Study design
On the examination day, the patients completed the Asthma Control Test (ACT) questionnaire and underwent testing for respiratory impedance, fraction of exhaled NO (FeNO), and pulmonary function in that order. Short-acting β2 agonists were not used for more than 12 h before these tests in every case.
ACT
The ACT questionnaire (Japanese version, supplied by Glaxo-SmithKline Japan) consists of five items assessing the impact of asthma on everyday functioning at school or work, shortness of breath, nocturnal asthma symptoms, use of rescue medication, and the patient's self-rated asthma control during the previous 4 weeks.10
Respiratory impedance
Respiratory impedance was measured by FOT using a commercially available device (MostGraph-01; Chest M.I., Co. Ltd., Tokyo, Japan)6,7 and met standard recommendations.1 Recommendations for measurements consisted of the following seven items. Set-up: The subject was connected via a mouthpiece to a loudspeaker to deliver the forced oscillatory signal. The pressure and airflow signals were measured next to the mouthpiece. To enable spontaneous breathing by the subject, a wide-bore side tube was placed in parallel to the loudspeaker. The dead space was minimized to avoid a shunting effect. Apparatus: The loudspeaker was able to develop peak-to-peak pressure variation in 0.2 kPa at the airway opening (the variation did not exceed 0.5 kPa). Calibration: The FOT system was calibrated each day before the measurement with a 3 L syringe. Input signals: Both random noise and Hanning impulses (at 4-36 Hz) were available as oscillation signals and were applied to the respiratory system at intervals of 0.25 sec. Signal processing: Respiratory impedance was automatically calculated by fast Fourier transformation using a personal computer from the airflow and pressure signals at the mouths of the subjects. Reporting of results: Each oscillatory index was expressed as the mean value during a respiratory cycle (whole breath), and the inspiratory and expiratory phases, and the difference between the inspiratory and expiratory phases (Δ). Measurement conditions: During measurements, subjects supported their cheeks firmly to reduce upper airway shunting while sitting with their neck in a comfortable neutral posture, and wore a nose clip. The subjects were instructed to breathe quietly at functional residual capacity level (tidal breathing) for 30 sec while wearing nose clips. The volume history of the subjects was monitored for at least 30 sec. If swallowing, glottis closure, leaking around the mouthpiece, improper sealing with the nose clip, irregular breathing, or acute hyperventilation occurred, the measurement was discarded. Three to five technically acceptable measurements were performed. Results were acceptable if the coefficient of variation of at least two sets of data was less than 10%.
Because the curves of Rrs and Xrs versus frequency could be obtained every 0.25 sec, they were serially lined up against the time axis with assigned color gradients, resulting in color 3D imaging patterns. We used Rrs at 5 and 20 Hz (R5 and R20, respectively), and the difference between R5 and R20 (R5-R20) as indicators of the frequency dependence of Rrs, which is supposed to reflect inhomogeneous ventilatory mechanics.11 We also used Xrs at 5 Hz (X5), which reflects elastic or inertial properties of the lung; resonant frequency (Fres), where Xrs crosses zero and the elastic and inertial forces are equal in magnitude and opposite, and low-frequency reactance area (ALX), which is the integral of Xrs at 5 Hz to the Fres. Each oscillatory index was expressed as the mean value during a respiratory cycle (whole breath), and the inspiratory and expiratory phases, and the difference between the inspiratory and expiratory phases (Δ).
Classification of patients according to their color 3D imaging patterns
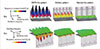
According to our previous report,7 color 3D imaging of respiratory impedance provided three patterns in each representative subject (Fig. 1). The criteria consisted of the following: 1) high values of Rrs and Xrs (blue or black at the top and bottom, that is, the top ≥6 cmH2O/L/s and the bottom <-6 cmH2O/L/s) with a marked respiratory cycle and frequency dependence, which was usually found in patients with COPD; 2) moderately high Rrs over the entire frequency and respiratory cycle (yellow, orange, or red, that is, the top ≥2-<6 cmH2O/L/s) with slight Xrs changes (yellow), which was usually found in patients with asthma; and 3) low Rrs (green, that is, the top <2 cmH2O/L/s) and Xrs (yellow) with few within-breath changes, which was usually found in healthy controls. Because these patterns were not disease-specific, but rather disease-suggestive, different color 3D imaging patterns can occur in patients with asthma. Three researchers (K. M., M. M., and S. M.) classified each asthma patient's color 3D imaging visually into the COPD-like pattern, asthma pattern, and normal-like pattern (Fig. 2); they were unaware of the clinical information and classified the images based on a majority decision when necessary. The COPD-like pattern refers to the typical color 3D imaging pattern that is observed in many patients with COPD, while the normal-like pattern refers to the one that is observed in many normal controls.
FeNO
FeNO was measured with an online method at a flow of 50 mL/s using an NO analyzer (Sievers NOA 280i; GE Analytical Instruments, Boulder, CO, USA) according to American Thoracic Society/European Respiratory Society recommendations.12 Four exhalation flow rates (100, 150, 200, and 250 mL/s) in addition to 50 mL/s were used and alveolar NO concentration (CANO) and maximal NO flux in the conductive airways (J'awNO) were calculated according to the two-compartment model of Tsoukias and George13 and the trumpet-shaped airways and axial diffusion model of Condorelli et al.14
Pulmonary function tests
Spirometry and, to assess ventilation inhomogeneity, nitrogen single-breath washout tests were performed using computer equipment (model CHESTAC-33; Chest M.I., Inc.) according to the standards of the American Thoracic Society.15 Forced expiratory volume in 1 second (FEV1), forced vital capacity (FVC), FEV1/FVC, and forced expiratory flow at 25-75% of the FVC (FEF25-75%) were determined. The N2 phase III slope for single-breath N2 washout (delta N2) was calculated as previously described.16
Statistical analysis
Categorical data were summarized as counts, and quantitative data were summarized as the mean±SD. Comparisons among three subject groups were made using the Kruskal-Wallis test, followed by multiple comparisons among groups using the Mann-Whitney U test. The chi-square or Fisher's exact test was used to test the significance of group differences with respect to the percentage of patients in various categories. Stat View Version 5.0 (SAS Institute, Cary, NC, USA) was used for statistical calculations. A P value of <0.05 was considered significant, and all tests were two-sided. Based on our previous report,7 we determined that a sample of 19 subjects per group would provide 80% statistical power at a two-sided α level of 0.05 to detect a difference of 1.03% or greater in the ΔX5 values between patients with a COPD-like pattern and those with an asthma pattern, assuming an SD of 1.1%. Similarly, a sample size of 11 subjects was required to detect a difference of 1.37% or greater in the ΔX5 values between patients with a COPD-like pattern and those with a normal-like pattern.
RESULTS
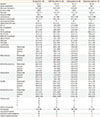
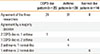
The clinical characteristics of the patients are shown in Table 1. The mean ACT score of 23.5 indicates that the study population was well controlled overall. Regarding image classifications, agreement among the three researchers was obtained for 24 patients with a COPD-like pattern, 31 with an asthma pattern, and 8 with a normal-like pattern. Majority decisions were reached as shown in Table 2. There was no complete disagreement among the three researchers. Fig. 2 shows typical images for Rrs and Xrs in representative patients with asthma. Both respiratory cycle dependence (Rrs was higher and Xrs was more negative in the expiratory phases than in the inspiratory phases) and negative frequency dependence (Rrs increased at lower frequencies and fell with increasing frequency) were marked in patients with the COPD-like pattern. In contrast, Rrs was moderately high over the entire frequency and respiratory cycle, and Xrs was slightly negative in patients with the asthma pattern. There were few within-breath changes and little frequency dependence in the normal-like pattern.
The characteristics of patients with different color 3D imaging patterns is also presented in Table 1. Patients with the COPD-like pattern were predominantly female with a higher body mass index and lower FEV1 and FVC values compared to those in the other categories. There was no significant difference in FEV1, FVC, FEV1/FVC, FEF25-75%, and delta N2 values between patients with the COPD-like pattern and those with the asthma pattern. Also, patients with the normal-like pattern showed the lowest body mass index and best pulmonary function. There were no significant differences in age, smoking history, atopic status, total IgE, duration of asthma, ACT score, exhaled NO-associated parameter values, or treatment among the three groups. As expected from Fig. 1, whole-breath, inspiratory, expiratory, and within-breath variation in Rrs and Xrs values was greatest in patients with the COPD-like pattern among the three groups. The Rrs values were higher in patients with the asthma pattern than in those with the normal-like pattern, whereas there was no difference in Xrs values between patients with the asthma pattern and those with the normal-like pattern.
DISCUSSION
We assessed the usefulness of color 3D imaging of respiratory impedance in patients with asthma using MostGraph. Patients with the COPD-like pattern were mostly female with a higher body mass index, lower FEV1 and FVC, and greater values of Rrs and Xrs (whole-breath and within-breath variation) compared to the other groups, whereas those with the normal-like pattern had higher FEV1 and FVC and lower delta N2 than those with the other patterns, suggesting the ability to detect different asthma phenotypes.
Oscillatory properties of the respiratory system are generally expressed as a single curve of Rrs and Xrs versus frequency in FOT. MostGraph was developed by Kurosawa et al.6 to verify the hypothesis that if a time axis is added to Rrs and Xrs curves, disease-suggestive patterns of 3D imaging, and a marked frequency and respiratory cycle dependence in COPD in particular, might be obtained. Because the curves could be obtained every 0.25 sec, they were serially lined up against the time axis with assigned color gradients, resulting in color 3D imaging patterns. We showed that color 3D imaging of respiratory impedance provided disease-suggestive patterns.7 This technique has not been validated throughout the world, but we tried to determine what information could be obtained by quick observation of color 3D imaging in patients with asthma. If we classified the patients by color 3D imaging perception, would that be useful for detecting asthma phenotypes? These were the highlights of the present study.
Basically, we consider color 3D imaging analyses convenient for several reasons.7 First, Rrs is colored according to each approximate value (in cmH2O/L/s): 1-2, green; 3, yellow; 5, red; and 8, blue. Xrs is colored as follows: plus values, green; minus values, from yellow to blue (Figs. 1 and 2). Thus, the colorimetric display tells us the measured values: green means low or normal resistance, blue means very high resistance, and so on. Second, the colorimetric display shows disease-suggestive patterns. Typical patients with COPD show green in the inspiratory phase and yellow-red-blue gradations in the expiratory phase, reflecting respiratory cycle dependence. COPD patients also have negative frequency dependence, that is, blue at lower frequencies and yellow or red at higher frequencies. In contrast, patients with asthma showed an overall yellow pattern. Third, colorimetric analyses enabled us to detect slight changes in oscillatory indices. For example, when comparing images taken before and after treatment, the disappearance of blue at the top means improvement over the course of the disease.
We were able to classify patients with asthma into three patterns based on the color 3D imaging of respiratory impedance: the COPD-like, asthma, and normal-like patterns. Basically, there was a high rate of agreement and significant differences in Rrs and Xrs values among the three patterns, indicating the usefulness of visual classification by the three researchers, who were unaware of the clinical information and classified the patterns after reaching agreement; however, the classification criteria used in the present study have not been validated. Further studies are needed to determine their sensitivity and specificity, and to establish the validity of the classification criteria in color 3D imaging of respiratory impedance.
As mentioned above, patients with the COPD-like pattern were predominantly female with a higher body mass index, and also had greater values of Rrs and Xrs (whole-breath, inspiratory and expiratory phases, and within-breath variation) than those with other patterns. Greater whole-breath and inspiratory and expiratory phase values of Rrs and Xrs may reflect more severe airway narrowing and parenchymal abnormalities, respectively. The meaning of within-breath variation in Rrs is still unclear, whereas previous studies have indicated that within-breath variation in Xrs measured with FOT allowed the detection of expiratory flow limitation (EFL).11 EFL during tidal breathing is a major determinant of dynamic hyperinflation and exercise limitation in COPD.17 EFL is common in patients with COPD and is caused by the loss of elastic recoil in the lung. It is supposed that reactance normally reflects the elastic and inertial properties of the respiratory system, but with flow limitation, oscillatory signals cannot pass through the choke points and reach the alveoli, producing a marked reduction in apparent compliance and a fall in reactance. Several investigators have reported that within-breath changes in Xrs can be used to distinguish between patients with COPD and those with asthma;3,4,7 however, loss of elastic recoil in the lung has been observed in the lungs of some patients with asthma.18 Although the structural bases for these changes are unclear, loss of alveolar attachments and peribronchiolar damage to elastin have been reported in cases of fatal asthma.19 Elastic recoil in patients with asthma has not been shown to be related to the duration or severity of asthma,20 while abnormal elastic recoil has been identified as a risk factor for near-fatal asthma.21 We speculate that the COPD-like pattern in asthma reflects airway remodeling.
Generally, airway resistance depends on lung volume.22 High resistance can be observed at low lung volumes such as the residual volume. Color 3D imaging of respiratory impedance was reported to be useful for assessing the lung volume dependence of Rrs, instead of airway resistance.6 This dependence possibly contributes to the respiratory cycle dependence of Rrs, and FVC size can modify the relationship between resistance and lung volume. In the present study, patients with the COPD-like pattern exhibited marked respiratory cycle dependence and lower FVC values than those with other patterns, suggesting physiological links between these findings.
We found that patients with the normal-like pattern had higher FEV1, FVC, and FEF25-75% values and lower delta N2 values than those with other patterns. These patients are thought to have milder disease without airway remodeling, whereas patients with the asthma pattern are thought to have moderate disease severity (between that of those with the COPD-like pattern and those with the normal-like pattern). There were significant differences in within-breath variation in Xrs between patients with the COPD-like pattern and those with the asthma pattern, whereas there was no difference in FEF25-75% between the two groups, reflecting the difference between tidal breathing and forced expiration.
Concerning exhaled NO measurements, there were no differences in FeNO, CANO, or J'awNO among the three groups, indicating that color 3D imaging of respiratory impedance cannot reflect central or peripheral airway inflammation.
The relationship between FOT parameters and airway hyperresponsiveness is important. The measurement of 3D respiratory impedance is not easy in real practice and the devices used are expensive. Also, the classification used in the present study has not been validated; however, we consider the classification to be clinically important for two main reasons. First, on the basis of the 3D classification, we can measure asthma severity to some extent. Patients with the COPD-like pattern have worse pulmonary function and a higher body mass index, suggesting that their disease severity is moderate to severe, whereas patients with the normal-like pattern are believed to have milder disease. Thus, we can select medications, such as inhaled corticosteroid with long-acting β2-agonists or inhaled corticosteroid alone, according to the classification. Second, changes in the 3D classification may reflect the improvement or exacerbation of asthma. We often observe a change from the COPD-like pattern to an asthma or normal-like pattern due to successful treatment. The pattern classification also enables quick perception of the changes in disease without the need to compare values. Thus, we believe that color 3D imaging of respiratory impedance would be useful if applied in real clinical practice. More studies will clarify the significance of the 3D classification.
The data obtained from the FOT with color 3D imaging in the present study were associated with gender, body mass index, FEV1, FVC, and delta N2, but not with ACT score, FEV1/FVC, FEF25-75%, FeNO, CANO, or J'awNO. Taken together, these findings suggest that color 3D imaging may help to detect different asthma phenotypes. Because the present study was cross-sectional, it will be interesting in future studies to clarify the changes in color 3D imaging that occur following treatment. Limitations of the present study include the subjective nature of color 3D imaging perception and the single-institute study design.

 XML Download