

 PDF
PDF ePub
ePub Citation
 Print
Print


INTRODUCTION
Atopic allergy occurs through immunoglobulin (Ig) E antibody formation. Pollinosis develops when pollens crosslink allergen-specific IgE antibodies on mast cells. Counts of pollens (aeroallergens) in the air vary seasonally. Therefore, characteristic symptoms of respiratory allergy occur during a specific pollen season in patients sensitized to the pollen. The recently revised Korean pollen calendar showed that tree pollens usually disperse in the air from March to June, weed pollens from mid-August to mid-November, and grass pollens from mid-May to October in the Gwangju area.1
Because exposure to an antigen in an individual sensitized to the antigen induces rapid production of a large amount of the antigen-specific antibody 1-2 weeks later (secondary immune response),2 the serum level of pollen-specific IgE antibody or skin test reactivity to a pollen is higher during or following the corresponding pollen season than in other seasons. As early as 1975, Henderson et al.3 showed that ragweed-specific IgE antibody levels in serum were maximal following ragweed pollination season in 17 patients allergic to ragweed pollen. Not only pollens but also house dust mites (HDMs), the most prevalent allergen for respiratory allergy,4 demonstrate seasonal variation at indoor concentrations.5,6 HDM allergen concentrations7 and HDM-specific antibody levels8 are highest in the fall in Korea. Thus, there must be seasonal variation in the rate of sensitization to aeroallergens, including HDMs, and we previously demonstrated seasonal variation in sensitization to HDMs in a small group of patients with exercise-induced asthma.9 The present study was performed to confirm this relationship between the season and rate of skin sensitization to aeroallergens in a much larger population with allergy.
MATERIALS AND METHODS
Subjects
Charts for 1,891 patients who received allergy skin prick tests between October 2009 and September 2012 at the Department of Allergy, Chonnam National University Hospital, Gwangju, Korea, were retrospectively reviewed regarding age, gender, symptoms of respiratory allergy such as rhinitis or asthma, use of inhaled steroid, and the results of skin prick tests and methacholine bronchial challenges or tests for reversible airflow obstruction. Seventy-three allergy skin test results obtained from 35 patients were regarded as data from 73 cases, and one result from a subject who showed no evidence of allergy was excluded; thus, a total of 1,928 test results were analyzed. Patients who showed a positive response to methacholine challenge or in reversibility tests, or who were prescribed an inhaled steroid after the test, were considered to have asthma. Of the remaining patients, those who had symptoms of respiratory allergy were considered to have rhinitis without asthma. Because aeroallergens may play a different role than do foods and drugs in urticaria, drug allergy, and anaphylaxis, the 401 test results for 399 non-respiratory allergy patients were separated from 1,527 results for 1,491 patients with respiratory allergy. A positive response to at least one aeroallergen occurred in only 8.7% of 425 tests of elderly aged >60 years compared to 64.2% of 296 tests in young patients aged 30 years or less and 32.6% of 806 tests in middle-aged patients aged 31-60 years among patients with respiratory allergy (P=0.000). Therefore, the data from the elderly were excluded from the analyses in the present study. According to the seasons when they underwent the tests, the subjects were divided into four groups: spring (March-May), summer (June-August), fall (September-November), and winter (December-February). Among the 35 patients who received allergy skin tests two or more times, 25 patients with respiratory allergy and a positive response at least once were included in the analysis for a longitudinal study.
Allergy skin prick test
Skin prick test was performed with 29 common aeroallergens, including HDMs (Dermatophagoides pteronyssinus and D. farinae), cat, dog, German cockroach, tree pollens (alder, ash, beech, birch, hazel, oak, poplar, and willow), grass pollens (bermuda, meadow, orchard, rye, and timothy), weed pollens (dandelion, hop japanese, mugwort, nettle, and ragweed), and molds (Alternaria alternata, Aspergillus fumigatus, Cladosporium, Fusarium, Penicillium, and Trichophyton). After withdrawal of all medications for allergic diseases for 1 week or more, the patients received skin tests on the back of the trunk. Histamine solution (1 mg/mL) and normal saline were used as a positive and negative control, respectively. At 15 min after application of the agents, the arithmetic mean of the largest and smallest diameters of the wheal at a right angle to each other was measured and flare was observed. In subjects without dermographism, the size of a wheal induced by an allergen equal to or larger than the size of that elicited by the histamine solution with accompanying flare was considered a clinically significant positive response.10 Atopy was defined as the presence of a significant positive response to at least one allergen.
Lung function tests
For diagnosing asthma, tests for reversible airflow obstruction and airway hyperresponsiveness (AHR) were performed. Lung function tests were conducted using a computerized spirometer (Spiro-Analyzer ST-250; Fukuda Sangyo, Tokyo, Japan). According to the method proposed by the Intermountain Thoracic Society, the representative values were selected from the "best spirogram" with the largest sum of forced vital capacity and forced expiratory volume in one second (FEV1) among three or more acceptable spirograms.11
Reversible airflow obstruction was defined as an increase of 12% and 200 mL in FEV1 from the baseline value12 shortly after bronchodilator therapy or a long time after the initial spirometry spontaneously or following asthma treatment. Withdrawal of medications was performed before the AHR tests, as follows: anti-histamine after 48 h, theophylline and long-acting β2 agonists after 24 h, ipratropium after 12 h, and short-acting β2 agonists after 8 h. Methacholine AHR tests were performed using the tidal breathing method standardized by Cockcroft.13 Freshly prepared methacholine solutions at concentrations of 0.075, 0.15, 0.31, 1.25, 2.5, 5.0, 10, and 25 mg/mL were aerosolized using a jet nebulizer (DeVilbiss 646; DeVilbiss Co, Somerset, PA, output 0.13 mL/min) and inhaled by tidal breathing for 2 min in 5-min intervals. The concentration that decreased FEV1 by 20% (PC20, mg/mL) was obtained using the linear interpolation method of the log dose-response curve. A positive methacholine AHR test was defined as PC20<16 mg/mL.14
Statistical analyses
Data are presented as the mean±standard error. Statistical analyses were performed using the windows statistical program (SPSS version 20.0; SPSS Inc, Chicago, IL, USA). Statistical comparisons between groups were made using the Student's t-test, ANOVA, and the chi-square test. Intragroup comparisons were performed using Kappa values. A P value less than 0.05 was deemed to be statistically significant.
RESULTS
Prevalence of skin sensitization to aeroallergens
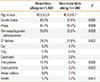
Comparing clinical characteristics and the rate of a positive response to skin prick tests with aeroallergens, the proportion of men was significantly higher among patients with respiratory allergy than among those with non-respiratory allergy (Table 1). The prevalence rates of atopy, D. pteronyssinus, D. farinae, tree and grass pollens, and molds were significantly higher in patients with respiratory allergy than in those with non-respiratory allergy.
The most prevalent aeroallergens were D. pteronyssinus and D. farinae in both patients with respiratory allergy and those with non-respiratory allergy. Among atopic patients, the prevalence rates of sensitization to D. pteronyssinus and D. farinae were 72.2% and 68.0% in respiratory allergy patients and 72.7% and 67.3% in non-respiratory allergy patients, respectively. The allergens in order of prevalence were tree (29.8%), weed (23.8%), and grass (15.9%) pollens, cat (15.0%), mold (13.9%), cockroach (6.0%), and dog (3.1%) in respiratory allergy patients and weed (21.8%) and tree (19.1%) pollens, cat (12.7%), cockroach (10.9%), grass pollen (10.0%), mold (7.3%), and dog (2.7%) in non-respiratory allergy patients.
Seasonal variation in atopy
There was a significant difference in atopy prevalence among seasons in patients with respiratory allergy (P=0.003). The prevalence was significantly lower in the summer (34.1% vs. 43.6%, P=0.005) and higher in the fall (49.2% vs. 38.2%, P=0.001) than in the other seasons. In patients with non-respiratory allergy, the prevalence was significantly lower in the summer (23.2% vs. 36.1%, P=0.021). However, the highest prevalence tended to occur in the spring (40.0% vs. 29.4%, P=0.061).
Seasonal variation in skin sensitization to HDMs
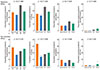
There was a significant difference in the rate of positive response to D. farinae among seasons in both patients with respiratory allergy and those with non-respiratory allergy (Fig. 1). However, the seasonal variation in the D. pteronyssinus sensitivity was only significant in respiratory allergy patients. The skin sensitization rate to D. pteronyssinus was significantly lower in the summer (23.2% vs. 32.1%, P=0.004) and higher in the fall (38.3% vs. 26.6%, P=0.000) than in the other seasons in patients with respiratory allergy. Similarly, the D. farinae sensitization rate was also significantly lower in the summer (22.2% vs. 30.2%, P=0.009) and higher in the fall (35.6% vs. 25.3%, P<0.001). The rate of sensitization to D. farinae was significantly higher in the spring (33.7% vs. 17.1%, P<0.001) and lower in the summer (14.1% vs. 24.9%, P=0.029) than in the other seasons in non-respiratory allergy patients.
Seasonal variation in skin sensitization to non-mite aeroallergens
The rate of skin sensitization to weed pollens showed seasonal variation in patients with respiratory allergy (Fig. 1). It was significantly higher in the fall, weed pollen season, than in other seasons (13.9% vs. 8.3%, P=0.006). The rates of sensitization were significantly higher for alder, birch, and nettle in the fall, for mugwort and willow in the summer, and for Japanese hop in the spring. The Aspergillus fumigatus sensitization rate was seasonally variable in patients with respiratory allergy (Fig. 1). The rate in the winter was significantly higher than in other seasons (2.9% vs. 0.7%, P=0.005). In non-respiratory allergy patients, the rate of sensitization to cockroach in the fall was significantly higher than in other seasons (7.6% vs. 2.6%, P=0.047). The rates for molds (6.2% vs. 1.2%, P=0.009) and alternaria (5.0% vs. 0.8%, P=0.012) in non-respiratory allergy patients were significantly higher in the winter than in other seasons.
Seasonal variation in skin sensitization to aeroallergens in asthma and rhinitis patients
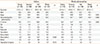
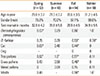
The mean age of rhinitis patients without asthma was significantly lower in the fall than in the summer (Table 2). In rhinitis patients, there was a significant difference in the prevalence rates of atopy and sensitization to D. pteronyssinus or D. farinae among seasons, being significantly lower in summer and higher in fall. These trends were less apparent in asthma patients.
In rhinitis patients, the rates of sensitization to cockroach (0% vs. 4.1%, P=0.029) and weed pollens (4.5% vs. 11.1%, P=0.039) in the summer and grass pollens in the spring (0.9% vs. 6.3%, P=0.024) were significantly lower than in the other seasons. In asthma patients, the rates of sensitization to weed pollens and A. fumigatus showed seasonal variation. The rates for weed pollens were significantly lower in the spring (5.8% vs. 11.4%, P=0.043) and higher in the fall (15.4% vs. 8.1%, P=0.005), and those for A. fumigatus were higher in the winter (4.4% vs. 0.8%, P=0.002) than in the other seasons. In addition, the rates were significantly higher for alder, birch, and mugwort in the fall, for ash in the winter, and for trichophyton in the spring.
Seasonal variation in skin sensitization to aeroallergens in a longitudinal study
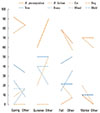
Among the 25 patients who were enrolled in the longitudinal study, 3 received the skin tests repeatedly in the same seasons. In the data obtained from the remaining 22 respiratory allergy patients who received allergy skin tests twice in different seasons (1 subject underwent the test once in the summer and twice in the fall 35 months apart), the distribution of age, gender, and test interval among seasons was not significantly different (Table 3). However, among the 10 patients who received the test in the summer, 6 (60.0%) showed a positive response to D. pteronyssinus or D. farinae, whereas 9 (90.0%) responded to them in the other seasons (Fig. 2); the concordance of the responses between the seasons was not significant (κ=0.29, Table 3). Eleven (78.6%) of 14 patients who tested in the fall responded to HDMs, whereas only 9 (64.3%) and 8 (57.1%) of them responded to D. pteronyssinus and D. farinae, respectively, in the other seasons. The response to cat was also less frequent in summer (20.0% vs. 50.0%) than in the other seasons, and there was not a significant association in the response rates between summer and the other seasons (κ=0.40). Only one patient responded to dog (grade 3) in the winter, but his response in the fall was not clinically significant (grade 2).
The responses to tree and grass pollens tended to decrease progressively from the spring to the fall (higher in the spring, equal in the summer, and lower in the fall than the other seasons). However, the response rates to weed pollens were lower in the spring and higher in the summer, and there was not a significant association in the response rates among seasons. The response rates to molds did not differ between seasons.
However, the patient who received the tests twice in the same season 35 months apart showed initially positive responses to 13 allergens (2 HDMs and 6 trees, 3 grasses, and 2 weed pollens), but he responded later to 8 allergens (2 HDMs, 1 cat, and 5 tree pollens). The positive responses to HDMs or cat did not change in three additional patients who were tested two or more times in the same season. However, the number of positive responses to tree pollens decreased 35 months later from 4 to 3 in a patient studied in the summer. In addition, the response to trichophyton newly occurred 59 months later and disappeared again 12 months later, and a new sensitization to cockroach developed at the last examination in other subjects who were tested in the spring.
DISCUSSION
The rate of skin sensitization to HDMs was significantly lower in the summer than in the other seasons in patients with respiratory allergy in the present study. This finding is consistent with our previous study on exercise-induced asthma.9 Although the positive response rate was 70%-95% in the previous study and 30% in this study, the discrepancy may be mainly due to the difference in the subject characteristics (mean age: 21 vs. 40.5 years, respectively). The prevalence of atopy was also significantly lower in the summer than in the other seasons. Because HDMs were the most prevalent aeroallergens in the patients and because the sensitization rate was around 70% in atopic subjects, the seasonal variation in atopy prevalence may be mainly determined by the variation in HDM sensitization.
The mean humidity in Gwangju over the past 3 yr was 62.2% in the spring, 76.6% in the summer, 67.8% in the fall, and 65.3% in the winter.15 Because the growth of HDMs is mostly dependent on ambient humidity, the number of HDMs is highest in the summer. However, the mites die several months later in dry conditions, and the level of mite allergen, a major form of which is found in fecal particles, remains high until winter.16 The concentration of mite allergen Der p 1 in beds was minimal in the summer and maximal in late fall, about 2 months after the peak relative humidity.6 In a previous study, indoor humidity was highest in July, the concentration of Der f 1 in beds was highest in October,7 and the Der p-specific antibody level in the serum was highest in the fall in Seoul,8 consistent with our results.
Recently, the so-called "sunshine hypothesis" has been proposed as an underlying mechanism of the worldwide increase in allergy and asthma in the last two decades.17 Vitamin D is synthesized from 7-dehydrocholesterol in skin exposed to solar ultraviolet B radiation.18 Because people in modern society usually spend most of their time indoors, and because sunscreen is widely used, many of them seem to be at risk for vitamin D deficiency. Alyasin et al.19 demonstrated that vitamin D insufficiency is a significant risk factor for asthma. At high latitudes, skin exposed to sunlight does not produce vitamin D in the winter,20 and Caucasian American adults meet their minimum vitamin D needs only in the summer.21 Khoo et al.22 demonstrated that an elevated serum vitamin D level was associated with increased expression of Foxp3 in Treg cells in the summer. Moreover, ultraviolet B radiation may directly inhibit skin mast cells.23 Thus, the low prevalence of atopy and HDM sensitization in the summer in the present study may be partly explained by the higher level of exposure to ultraviolet B radiation.
The sensitization to weed pollens was significantly higher in the fall, particularly in asthma patients in the present study. However, tree pollen sensitization tended to be high in the spring, but it did not reach statistical significance. A mismatch between the local pollination periods1 and arbitrarily classified seasons, the various pollination periods for individual pollens, and a time lag of 1-2 weeks between pollination and sensitization2 would obscure any difference in the overall sensitization rate for a group of pollens between one season and the other seasons, in contrast to the apparent increase in sensitization to ragweed following the ragweed season.3 In addition, we found that sensitization rates were low in the summer for cockroach and weed pollens, and high in the fall for tree pollens. These results may be partially explained by the suggestion that sensitization to an allergen may prime sensitization24 or reactions25 to other allergens. The allergic milieu induced by the major allergen HDMs might have influenced sensitization to other allergens such as cockroach and pollens in the present study. Local grass pollination occurred through the summer and fall, and so the sensitization rate might have progressively decreased from the highest in fall to the lowest in spring. Molds, particularly A. fumigatus, showed a significantly higher sensitization rate in the winter, consistent with previous reports26,27 that have shown that the indoor molds Penicillium and Aspergillus were dominant in indoor air in the winter.
Seasonal variation in the sensitization rate to HDMs was apparent in rhinitis but less apparent in asthma in the present study. Although the HDM sensitization rate in asthma tended to be consistently lower in the summer, as in our previous report,9 it was nearly two times higher than that of rhinitis. Sensitization to HDMs is significantly related to AHR,28 and HDMs are the most important allergens for asthma.4 The relative contribution of HDMs to asthma would be greater than that to rhinitis because pollen allergy is more related to rhinitis than asthma,29 and a long duration of exposure to perennial allergens such as HDMs may be needed to develop asthma, whereas a brief seasonal exposure to pollens would be sufficient to develop rhinitis. Therefore, the variation in HDM sensitization according to the variation in HDM allergen concentration might be obscured because of preexisting sensitization.9 However, sensitivity to another indoor allergen, A. fumigatus, was significantly predominant in the winter in asthma but not in rhinitis; further studies are required to determine whether asthmatics are more sensitive to molds than patients with rhinitis, or the proliferation of molds in the lower respiratory tract is related to asthmogenicity.
Seasonal variation in the rate of sensitization to aeroallergens also occurred in patients with non-respiratory allergy although the rate was significantly lower than that in respiratory allergy subjects. Sensitization to HDMs and pollens in chronic urticaria without allergic rhinitis has been reported,30 and food-induced anaphylaxis has been reported to occur during tree pollen season in patients with pollen allergy.31 Thus, atopic subjects with urticaria or anaphylaxis due to food or other non-aeroallergen may be prone to IgE-mediated reactions to aeroallergens as well, and the seasonal variation in sensitization to aeroallergens in non-respiratory allergy is easily speculated. However, in the present study, the highest prevalence of HDM sensitization occurred in the spring in patients with non-respiratory allergy, while it did in the fall in patients with respiratory allergy. Considering the priming effect,24 there could be a time lag from HDM sensitization in the fall to food sensitization in the spring, resulting in a high sensitivity to HDMs in the spring in those patients tested due to urticaria or anaphylaxis; however, this suggestion remains to be determined.
There are some limitations to this cross-sectional study. A definitive conclusion for seasonal variation cannot be drawn because the tests were performed in different individuals, and any difference in subject characteristics could result in such variation. The significant lower age in the rhinitis patients tested in the fall than those tested in the summer must have increased the sensitization rate in the fall for the young ages. However, we also found similar results in the longitudinal study: lower sensitization in the summer and higher sensitization in the fall to HDMs and cat. In addition, many of the responses differed according to season. Furthermore, we found a progressive decreasing trend of sensitization to tree pollens from the spring to fall over time after exposure in the spring. However, the loss or acquisition of sensitization to some allergens during a prolonged interval between the tests was problematic because it was also observed in the tests performed twice in the same seasons with a prolonged interval in the longitudinal study.
Overall, a positive response to HDMs occurred less frequently in the summer and more frequently in the fall in patients with respiratory allergy. There was seasonal variation in the rate of sensitization to other aeroallergens such as pollens and molds. Seasonal variation in sensitivity to aeroallergens occurred even in non-respiratory allergy, and the sensitivity to an allergen might be influenced by a priming effect of another allergen.
 XML Download