

 PDF
PDF ePub
ePub Citation
 Print
Print


INTRODUCTION
The current dietary environment has changed due to industrialization and economic development, which have had significant impacts on nutrition and health. The prevalence of chronic diseases is rapidly growing worldwide, and the major proportion of deaths due to chronic diseases is attributable to cardiovascular disease [1].
Dietary factors associated with reduced risk of CVD include fruits, vegetables, fish, and foods with high contents of linoleic acid, EPA, DHA, and potassium [2]. Dietary fats have been investigated as risk factors associated with coronary heart disease. Generally, intake of saturated fatty acid (SFA) raises blood cholesterol, especially low-density lipoprotein (LDL) cholesterol, whereas individual fatty acids have different effects [3456]. An effective way to reduce risk of coronary heart disease is substitution of unsaturated fatty acids for SFA. There is an optimum range of individual fatty acid intake according to the type of fatty acid (e.g. polyunsaturated fatty acid (PUFA), monounsaturated fatty acid (MUFA), n-3 fatty acid (n-3 FA), n-6 fatty acid (n-6 FA)) [78910].
The World Health Organization (WHO) has set nutrient intake guidelines for populations in order to establish national and regional dietary recommendations for prevention of diet-related chronic diseases such as cardiovascular diseases [2]. Korea has also set adequate intake ranges of fat and fatty acids based on Korean Dietary Reference Intakes (i.e. acceptable macronutrient distribution ranges, AMDR), but a fatty acid database for estimation of fatty acid consumption in the Korean population is not yet available [11].
Fat consumption has gradually increased with each nationally representative nutrition survey [12]. Even though current population average for fat consumption is not outside AMDR, trends suggest that fat intake will increase further and generate health concerns.
Recently, a fatty acid composition table was constructed based on food lists in the Korea National Health and Nutrition Examination Survey (KNHANES) [1314]. Population-level intakes of fatty acids can be evaluated using recently released KNHANES data. Thus, this study was conducted to produce estimates of population intake status and major sources of fatty acids, which could provide data for policy development and health promotion strategies related to dietary fats.
SUBJECTS AND METHODS
Study population
Subjects were participants of KNHANES VI-1 (2013), which was a nationwide cross-sectional survey assessing the health and nutritional status of Koreans [15]. The KNHANES has been conducted every year by the Korea Centers for Disease Control and Prevention on a target population of non-institutionalized civilians in Korea with a sampling plan of multi-stage clustered probability design.
In this analysis, we included 7,048 participants aged 3 years or older who completed a 24-h dietary recall. Children aged 1 and 2 years (n = 194) were excluded due to systematic underestimation of fat and fatty acid intakes since the KNHANES did not include breast milk. Men were 43.9% of subjects and 80.1% of those lived in urban areas.
Assessment of total fat and fatty acid intakes
Dietary intake data were obtained using the 24-h dietary recall method. Total fat intakes were calculated using a food composition table published by the Rural Development Administration of Korea [16]. Intakes of various fatty acids were calculated using a fatty acid composition table containing fatty acid content data on 2,143 foods published by national agencies from Korea, United States, and Japan. Fatty acid composition was matched according to food name with same species and same form (dried, boiled, etc.), and domestic sources were selected preferentially compared to foreign sources. If the same species or form of food was not available in the literature, imputation was performed using the calculation from the same species with different forms (dried, boiled, etc.) or by substitution with familiar species in a biosystematic grouping. The process of developing the fatty acid composition table has been reported in detail [1314]. The major food sources of total fat and fatty acids were evaluated based on the mean amounts of fat and fatty acids of each food.
Statistical analysis
Intakes of total fat and fatty acids were expressed as means and standard errors by groups according to gender, age, region, and income. Ratios of n-6 FA to n-3 FA as well as PUFA to SFA were highly skewed to the right, and geometric means were calculated. Food sources of total fat and fatty acids were calculated and expressed as intake amounts and as percentage contribution to total intake (%). Taylor series method was performed to account for the complex survey design of KNHANES. All statistical analyses were performed using statistical software package SAS version 9.4.
RESULTS
Total fat and fatty acid intakes
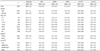
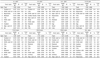
Total fat and fatty acid intakes according to sociodemographic characteristics are shown in Table 1. Mean intake of total fat was 48.0 g while mean intakes of SFA, MUFA, PUFA, n-3 FA, and n-6 FA were 14.4 g, 15.3 g, 11.6 g, 1.6 g, and 10.1 g, respectively. Intakes of MUFA and SFA were each higher than that of PUFA in all age groups. Total fat and fatty acid intakes of men were higher than those of women, and total fat and individual fatty acid intakes were highest in subjects aged 19-29 years. Subjects who lived in urban areas consumed a relatively higher amount of PUFA and lower amounts of SFA and MUFA compared to residents in rural areas. Total fat and fatty acid intakes of high-income subjects were higher than those of low-income subjects. Geometric means and standard errors of PUFA/SFA and n-6 FA/n-3 FA were 0.821 ± 0.002 and 6.914 ± 0.023, respectively (data not shown).
Food sources of total fat and fatty acids
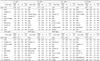
The major source of total fat was milk (15%) in children 3-5 years of age, followed by pork (10%) and cookies and biscuits (9%) (Table 2). Pork was the highest ranked source of total fat in subjects 6 years of age and over, providing 12-18% of total fat. Pork, soybean oil, and beef were the top three sources of total fat in subjects 30 years of age and over.
The main contributor to SFA intake was milk, followed by pork in children 3-11 years of age (Table 3). In children 3-5 years of age, milk, pork, and cheese contributed 48% to SFA intake. Cookies, biscuits, snack, ice cream, instant noodles, and chocolate contributed 15-18% to SFA intake among subjects aged 3-18 years. Pork was the highest ranked source of SFA among subjects aged 12 years or older, providing 16-23% of SFA intake. The four major sources of SFA were pork, instant noodles, milk, and beef in subjects 19-49 years of age as well as pork, milk, beef, and coffee in subjects 50 years of age and over. These four sources provided almost 40% of SFA intake.
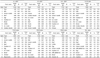
The highest ranked source of MUFA was milk in children 3-5 years of age and pork in those 6 years of age and over, which were very close to the SFA results (Table 4). The main contributors to MUFA intake were meat (pork, beef, or chicken) and vegetable oils (soybean oil, sesame oil, or rape seed oil). Meat contributed 18-35% to MUFA intake, and vegetable oils contributed 5-14% to MUFA intake. Egg and milk were also major food sources, and other sources were different depending on age; snack and bread in subjects 3-18 years of age; instant noodles, mayonnaise, and bread in subjects 19-49 years of age; instant noodles, peanuts, and almonds in subjects 50-64 years of age; instant noodles, bread, and tofu in subjects 65 years of age and over.
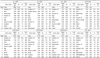
Vegetable oils (soybean oil, sesame oil, or rape seed oil) were the main source of PUFA in all age groups, providing 22-32% of PUFA intake, whereas soybean oil was the highest ranked food source (Table 5). Pork and mayonnaise were also major contributors, and intakes of PUFA from pulses (soybean milk, tofu, soybean, or walnut) were relatively high in subjects 50 years of age and over.
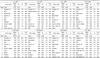
The main sources of n-3 FA were soybean oil and perilla seed oil (Table 6). Cake, bread, or hamburger contributed 5-13% to n-3 FA intake in subjects 3-18 years of age. Mayonnaise contributed 8-12% in subjects 12-49 years of age, and perilla seed contributed 6-8% to n-3 FA intake in subjects 50 years of age and over. Fish (mackerel, eel, and anchovy) contributed 10% to n-3 FA intake in subjects 30 years of age and over.
The main source of n-6 FA in all age groups was soybean oil, providing 13-27% of n-6 FA intake (Table 7). Pork, mayonnaise, sesame oil, tofu, and egg also considerably affected intakes of n-6 FA.
The top ten sources of fats and fatty acids in men and women were similar. Highest ranked foods were the same (i.e. pork for total fat, SFA, and MUFA and soybean oil for PUFA, n-3 FA, and n-6 FA), and listed foods were similar. Ranked orders except for the first were slightly different (data not shown).
DISCUSSION
This study produced population-level estimates of fatty acid intake and food sources according to socio-demographic status as a first attempt to estimate intake status of the Korean population using a comprehensive and reliable fatty acid composition table containing dietary intake data from KNHANES. Population mean of total fat intake was 48.0 g. PUFA was consumed less than SFA or MUFA, and mean intake levels of SFA, MUFA, and PUFA were 14.4 g, 15.3 g, and 11.6 g, respectively. Mean intakes of n-3 FA and n-6 FA were 1.6 g and 10.1 g, respectively, and the mean ratio of n-6 FA to n-3 FA was 6.9. Pork was the major source of total fat, SFA, and MUFA while soybean oil was the major source of PUFA. Milk and pork were major sources of SFA in subjects aged 3-11 years and ≥ 12 years, respectively. Perilla seed oil and soybean oil were the main sources of n-3 FA in subjects aged ≥ 50 years and < 50 years, respectively.
To reduce risk of coronary heart disease, substitution of unsaturated fatty acids for SFA, which raise low-density lipoprotein (LDL) cholesterol, is generally recommended. The ratio of unsaturated fatty acids to SFA was approximately 1.9 in the current study, which analyzed data from the KNHANES VI-1 (2013) containing a newly constructed food composition table, and this value was lower than 2.2 from the KNHANES III (2005) [11]. Direct comparison is not possible due to differences in the study conditions, including the food composition table. The ratio of n-6 FA to n-3 FA was within the current recommendation of 4-10 for Koreans [11].
The total fat consumption level in this study was lower than that of the US (48 g versus 79 g) estimated in 2004 using the 1999 to 2000 NHANES [17]. Average levels of fatty acid consumption were lower than those of the US [17] and Japan [18], although direct comparison is not feasible due to differences in the study conditions, including the study population (all age groups in US and middle-aged men with abdominal obesity or metabolic syndrome in Japan) and food composition table. The mean SFA intake level (14.4 g) was lower than those of the US (27 g) [17] and Japan (16.1 g) [18]. The average MUFA (15.3 g) and PUFA (11.6 g) intakes were lower than those of the US (MUFA 30 g and PUFA 16 g) [17] and Japan (MUFA 19.6 g and PUFA 15.8 g) [18].
Even though population averages for fat consumption were within adequate ranges, intake trends suggest that it will increase further and generate health concerns [12]. Examination of foods contributing to total fat and individual fatty acid intakes in this study provided information about food sources of fat and fatty acids in the Korean population. Better food choices can improve intakes of total fat and SFA and simultaneously increase proportions of PUFA and MUFA in the diet. The major sources of SFA and MUFA were somewhat similar, and the major source was pork in subjects aged 12 or more years. The major food sources of n-6 FA and n-3 FA were also similar, and the major source was soybean oil. Pork was the major source of total fat and fatty acids due to its high consumption in the Korean population. As fat intake increases at the population level along with increases in meat intake, food-based recommendations need to be developed to promote increased fat intake from plant-based foods such as oils, nuts, and seeds [rich sources of MUFA and alpha-linolenic acid (ALA)] as well as fish [primary food source of eicosapentaenoic acid (EPA) and docosahexaenoic acid (DHA)]. Due to the complexity of various fatty acids existing in the same foods, particularly coexistence of n-3 and n-6 FA in many food sources, nutritional education needs more complex responses than merely suggesting substitution of one food for another. Advances in processing that can produce foods with improved fatty acid compositions will also likely bring about population changes.
The Eskimo [19] and Japanese [20] are examples of populations that traditionally have high n-3 FA intakes, in particular higher intakes of long chain n-3 FA, and corresponding lower n-6 FA intakes. These intakes are mainly based on considerably high fish consumption as well as very lean red meat. Interestingly, soybean oil and perilla seed oil were the main food sources contributing to n-3 FA intake in our study. Perilla seed oil and raw perilla seed have often been used in traditional Korean cuisine. Similar to flaxseed oil, perilla seed oil contains 40-64% ALA, along with small amounts of other types of PUFA such as LA, which competes with ALA in the synthesis of EPA from ALA [21]. Large amounts of ALA in perilla seed oil have been reported to increase plasma levels of EPA and DHA in mice [22] and anti-atherosclerosis properties in Japanese quail [23]. Therefore, dietary intake of perilla seed oil may have cardioprotective effects.
There is inconsistent evidence linking SFA intake and cardiovascular disease. SFA intake is not associated with increased risk of CHD, stroke, or CVD according to the meta-analysis of 347,747 subjects during a follow-up of 5-23 y [24]. However, a JPHC study reported a positive association between SFA intake and cardiovascular disease, as the first report on the Asian population [25]. These inconsistent results may be attributable to dietary differences between the study populations. In this regard, population-specific differences, i.e., East and West, in the distribution of fat should be considered.
Korean dietary recommendations and population-based dietary guidelines aim to provide adequate nutrient intakes and prevent chronic diseases. The consistent increase in meat and fat consumption as well as the dramatic increase in prevalence of overweight, metabolic disorders, chronic diseases in Korea highlights the need for better understanding of associations between food sources of fat and various fatty acids as well as disease risk. Therefore, further studies and health objectives should continue to focus on relations between fatty acid intake and related chronic diseases using this newly constructed data.
In conclusion, this study estimated fatty acid intakes in the Korean population based on a newly constructed fatty acid composition table using data from the KNHANES VI-1 (2013). This population-based descriptive data on fatty acid intake will serve as a basis for investigation of associations between dietary fatty acid intake and related chronic diseases as well as the development and evaluation of public health recommendations and national nutrition policies in Korea.

 XML Download