

 PDF
PDF ePub
ePub Citation
 Print
Print


INTRODUCTION
Globally, the elderly population is steadily growing with the increased average life span due to continual improvement of the standards of living and the development of medical technology. According to the Korea National Statistical Office (2013), Korea entered the aging society in the year 2000 when the proportion of the elderly population reached 7.2%, which rose to 12.2% in 2013. This number is continuing to increase, and it is estimated that Korea will become a post-aged society in the year 2026 with over 20% [1]. The number of care hospitals increased about a hundred fold from 13 in the year 2000 to 1276 hospitals in the year 2014 as the number of elderly rose rapidly [2].
The elderly population represents a vulnerable group at risk of nutritional deficiencies, because aging is associated with physical and physiological impairment and psychosocial as well as economical difficulty, all of which can all play a role in nutritional inadequacy [34]. The prevalence of malnutrition in hospitalized elderly patients has been reported to be 32.9-76%, which can be seen as higher than in younger patients [567]. Malnutrition is an important predictor of morbidity and mortality, and has been associated with increased risk of complications, prolonged hospital stays and readmission rate, and hence, increased medical costs [34].
Therefore, hospitals should screen each patient's nutritional status to identify malnutrition upon admission to the hospital, and try to manage nutritional problems. To accomplish this, hospitals employ nutritional screening or assessment tools. An effective nutritional screening tool must be practical, i.e. those who are going to use the tool must find it rapid and simple, and such a tool must also have high validity and reliability [8].
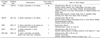
Most of the available nutritional screening tools were developed for the elderly to obtain an indication of the nutritional status of patients. Well-known examples include MNA(-SF) [910], GNRI [11], MUST [12] and NRS-2002 [13]. These screening tools have been designed for different purpose. Details about the each tool's differential purpose and characteristics can be found in Table 1. MNA(-SF), MUST and NRS-2002 are the screening tools recommended by the European Society for Clinical Nutrition and Metabolism [8]. MNA(-SF) and GNRI were developed for the screening of certain subgroups, specifically, for the elderly.
Recently, to make national tools specific for Korea, some universities and general hospitals developed nutritional indices or tools based on hospitalized adult patients [141516]. However, the tools have not yet been validated enough in other patient populations, age groups or settings; they thus have limitations for use on elderly patients in geriatric care hospitals. Further, there have also been national studies [171819] to assess the nutritional status of the hospitalized elderly using tools whose validity is accepted worldwide. However, since the different tools were used in different settings by various studies, it is hard to draw comparisons between studies and conclude which tool is the "adequate tool" to screen the nutritional status of elderly patients.
The purpose of this study was to evaluate the efficacy of the main nutritional screening tools developed or used for the elderly. This study was carried out to determine which tool had the highest efficacy to predict malnutrition in the elderly at a geriatric care hospital.
SUBJECTS AND METHODS
Subjects
This study was carried out from July 1 through December 31, 2013, in a geriatric care hospital in Hwasun, Korea. Those over the age of 65 were considered eligible for entry. The following patients were excluded in the study: patients who were unable to communicate or who had incomplete electronic medical records (n = 32), those receiving enteral feeding (n = 9), those discharged or who died within 48 h of admission (n = 6), and those previously assessed for inclusion who were readmitted (n = 37). During the study period, a total of 225 elderly patients were considered eligible for entry, and the 141 patients remaining after exclusion were included in analysis. The study was approved by the Human Research Ethics Committee of Chonnam National University (1040198-131204-HR-008-01) in South Korea.
Data collection
This study used the general, anthropometric and biochemical data of the subjects from medical records. The general parameters were sex, age, diagnosis, education level, and physical activity. Anthropometric parameters included height, weight, weight loss (% in 3 months), body mass index (BMI), mid-arm circumference (MC), and calf circumference (CC). The biochemical parameters assessed were serum albumin (S-alb) and total lymphocyte count (TLC).
Assessment of nutritional status
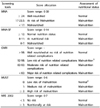
Nutritional screening was performed using the following five tools: Mini Nutrition Assessment (MNA), Mini Nutrition Assessment-Short Form (MNA-SF), Geriatric Nutritional Risk Index (GNRI), Malnutrition Universal Screening Tool (MUST) and Nutritional Risk Screening 2002 (NRS 2002). Details about the indices included in the different tools can be found in Table 1. Both their cut-off points for nutritional risk and assessment of nutritional status can be found in Table 2.
Reference standard : Combined index
There is no gold standard for evaluating malnutrition upon admission to geriatric care hospitals for elderly patients. In the absence of such a standard, we decided to calculate a combined index as a reference standard, using the methodology previously suggested by Pablo et al. [20] and Poulia et al. [21]. It was derived from a synthesis of the results of the MNA(-SF), the GNRI, the MUST, and the NRS 2002. Specifically, if a patient was evaluated as malnourished to any degree or at risk of malnutrition according to at least four out of five of the aforementioned tools, the patient was categorized as malnourished in the combined index classification. The combined index was the criterion used for true malnutrition.
Evaluation of the efficacy of nutritional screening tools
Evaluation to determine the most valid screening tool to predict malnutrition was carried out by calculating the sensitivity, specificity, and positive and negative predictive values. The cut-off points of validity were set as suggested by Van Bokhorst-de van der Schueren MA et al. [22]: sensitivity and specificity > 80%, good validity; sensitivity or specificity < 80% but both > 50%, fair validity; sensitivity or specificity < 50%, poor validity.
The tool with the most diagnostic concordance among the results from the individual screening tools and the combined index was determined with k statistics. The cut-off points of reliability were set as suggested by Landis JR and Koch GG [23]: k: < 0, no agreement; 0.00-0.20, poor agreement; 0.21-0.40, fair agreement; 0.41-0.60, moderate agreement; 0.61-0.80, substantial agreement; and 0.81-1.00, almost perfect agreement.
Statistical analysis
Statistical analyses were performed using SPSS software version 18.0. Continuous variables were expressed as mean ± standard deviation, and categorical variables as frequencies and percentages. P-values were based on two-sided tests, with P < 0.05 being considered to indicate statistical significance. Student's t-test was used to examine whether the combined index and the five nutritional screening tools adequately reflected the elderly's nutritional status.
RESULTS
General characteristics of the subjects
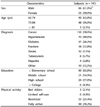
Of the total of 141 patients analyzed, 86 (61.0%) were males and 55 (39.0%) were females. The age distribution was between 65 and 95, with the average age of 73.5 ± 5.2. The majority of subjects were diagnosed with cancer (n = 110, 78%), and over half (90, 63.8%) only had education up to elementary school. Of the study subjects, the majority had the level of physical activity of "fully active," with 99 participants (70.2%) (Table 3).
Anthropometric and biochemical characteristics of the subjects
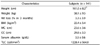
The average height of participants was 161.0 ± 8.2 cm, with the average weight of 58.1 ± 9.5 kg. Weight loss (% in 3 months) was 3.3 ± 3.9%, and the BMI was 22.4 ± 3.4 kg/m2. The MC and CC were 23.6 ± 3.6 cm and 29.8 ± 3.3 cm, respectively. The S-alb was 3.5 ± 0.6 g/dL, while the TLC was 1228.4 ± 564.8 cell/mm3 (Table 4).
Assessment of nutritional status
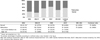
The frequency of any degree of malnutrition or risk of developing malnutrition upon admission to the geriatric care hospital herein varied greatly, depending on the nutritional screening tool used. According to the combined index, 44.0% of the patients were at risk of malnutrition to some degree, while this percentage varied from 36.2% (MUST) to 72.3% (MNA-SF) among individual tools. The percentage of patients with normal nutritional status varied accordingly, from 27.7% (MNA-SF) to 63.8% (MUST), while 56.0% of the patients were found not to be at risk of malnutrition according to the combined index (Fig. 1).
Differences of nutritional parameters between malnutrition and normal status
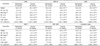
There were significant differences in weight, weight loss (% in 3 months), BMI, MC, CC, and S-alb between the malnutrition and normal group, as assessed by each nutritional screening tool and the combined index. The TLC as assessed by MNA-SF (P < 0.05), MUST (P < 0.05) and the combined index (P < 0.01) also showed that malnutrition group to be significantly lower than the normal group, but no significant differences were obtained according to the MNA, GRNI and NRS 2002 (Table 5).
Evaluation of the efficacy of nutritional screening tools
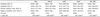
Assessing validity of the tools according to the combined index revealed MUST to have good validity (sensitivity (se) 80.6% and specificity (sp) 98.7%). MNA, GNRI and NRS-2002 had fair validity (respective se and sp: 100% and 60.8%, 95.2% and 67.1%, 100% and 78.5%). In contrast, MNA-SF had poor validity (se: 100%, sp: 49.4%).
The reliability, i.e. the diagnostic concordance among the screening tools, also varied greatly according to the combined index. The MUST had almost perfect agreement (k = 0.81, P = 0.000), followed by NRS-2002, which had substantial agreement (k = 0.76, P = 0.000). In contrast, GNRI, MNA and MNA-SF had only moderate agreement (respective k = 0.60, 0.58 and 0.46, all P = 0.000) (Table 6).
DISCUSSION
Over the last few decades, numerous nutritional screening tools have been developed with the purpose of facilitating the easy screening or assessment of patient nutritional status and to manage nutritional problems. In order to assess which tool performs the best, studies comparing several tools in the same population are very valuable and informative, since they are not biased by differences between populations, setting, or age [22]. From this point of view, we tried to evaluate which nutritional tool among those developed or used for the elderly is most effective for elderly patients who are hospitalized in a geriatric care hospital.
In this study, the evaluated prevalence of malnutrition of elderly patients varied greatly, ranging from 36.2% (MUST) to 72.3% (MNA-SF) depending on the criteria used in each nutritional screening tool. Based on the combined index (reference standard), the prevalence was 44.0%. There are differences in the prevalence of malnutrition according to the kinds of nutritional screening tools used and the composition of the populations, ages and settings, depending on the study. Though it may not be proper to compare directly, the results obtained herein were similar the malnutrition rates of elderly patients reported by other studies, indicating 32.9-76% [567]. The present study demonstrated that even with the same subjects and settings, the malnutrition rate can be calculated differently according to the tool used because of the different aims for which the tools were developed and the screening index used in the tools. This points out that in real clinical situations, the tool chosen could alter whether patients with malnutrition are lost, or nutritional risk is overestimated.
Since there is no gold standard or tool for evaluating malnutrition as of yet, most researchers have used already existing screening and assessment tools as a reference standard [162425]. However, it should be noted that the reference standard by this method is always superior to the tool to be validated. Since there is assumed superiority of the reference standard, confusion was brought to the results when researchers tested the validity of the Subjective Global Assessment (SGA) [24] with the NRS 2002 as a reference [25], while another study tested the validity of NRS 2002 with SGA as a reference [26]. Therefore, in the present study, a combined index was used as the reference standard, using the methodology previously suggested by Pablo et al. [20] and Poulia et al. [21]. It is derived from synthesis of the results of the five tools. If a patient was evaluated as malnourished to any degree or at risk of malnutrition according to at least four out of the five tools, the patient was finally determined to be malnourished.
In this study, when compared with the combined index, the sensitivity of MUST was 80.6% (95% CI: 70.8-90.5) with the specificity of 98.7% (95% CI: 96.3-101.2), which represented good validity. The K value was 0.81, which was almost in perfect agreement. As assessed by MUST, there were significant differences in weight, weight loss (% in 3 months), BMI, MC, CC, S-alb, and TLC between the malnutrition and normal group. This shows similarity to a previous study [27] in which the malnutrition group obtained significantly lower scores than the normal group on the anthropometric and biochemical measurements reflecting nutritional status. Therefore, MUST seems not only to have high statistical efficacy to predict malnutrition, but also to adequately reflect the nutritional status of elderly patients.
Nutritional screening tools should be comparatively rapid, simple and economical by including data from patients that can easily be obtained upon admission to hospital [8]. The MUST was primarily developed for use in the community and includes a BMI score, a weight loss score, and an acute disease score [12]. It is not time consuming like the MNA, and does not require biochemical measurements like the GNRI. Therefore, the MUST appears to be a valuable and useful tool for the elderly at care hospitals.
The tools most widely used to screen malnutrition in the elderly are the MNA and the MNA-SF, both of which had high malnutrition rates of 65.9% and 72.3% in this study. A study [17] that was conducted in the nation to assess the nutritional status of the elderly using the MNA showed that the elderly patients hospitalized in university hospitals had a high malnutrition rate at 63%, which was similar to that of the present study. When compared to the reference standard of the present study, however, MNA showed the sensitivity of 100% but the specificity of only 60.8%, which is fair validity. Further, the K value was 0.58, representing moderate agreement. In addition, although MNA-SF also had the sensitivity of 100%, its specificity was the lowest at 49.4%, which represents poor validity. The K value was 0.46, in moderate agreement. The higher the sensitivity of a tool the less likely malnutrition patients will be missed; however, since it can also raise the false positive rate to detect even those who are not malnourished, this method can be determined as one resulting in excessive nutritional intervention [20]. Our study showed that of the five nutritional screening tools, the MNA-SF had the lowest positive predictive value (60.8%) while the MNA had the next lowest at 66.7%. Even in studies conducted abroad, the MNA-SF showed high sensitivity but low specificity when comparing an assessment by a professional [28] and nutrition-related indicators [29] as the standard reference, indicating that the tool classifies too many patients as being at risk of malnutrition, while, in fact, they are not malnourished. Therefore, if the nation's geriatric care hospitals were to use the MNA and MNA-SF to assess the nutritional status and care for malnourished patients, it would be time consuming and burdensome on personnel.
The limitation of our study is that nutritional screening should be done against every patient hospitalized, meaning that all 241 patients hospitalized should have been analyzed. However, patients were excluded due to difficulty with communication, lack of the required nutritional information (n = 32), or receiving of enteral feeding (n = 9). Since the reference standard used herein was derived from a synthesis of the results of the five tools, patients who couldn't be assessed by all five tools were inevitably excluded.
Another limitation is that when selecting the subjects, although not limited to a particular disease, a high percentage was made up of cancer patients. Evaluation of a nutritional screening tool's efficacy should not be limited to a certain disease, but rather include patients with a variety of diseases to produce results with high validity. Therefore, it must be verified whether many of the patients have specific diseases when conduced analysis.
 XML Download