

 PDF
PDF ePub
ePub Citation
 Print
Print


INTRODUCTION
Intake of natural materials is known to aid in the maintenance of body health and to prevent development of chronic diseases [1]. Traditionally, natural raw meal, also called Saengshik in Korea and heat-processed powder meal (Sunsik), has been eaten as health food instead of normal diets by Buddhist monks practicing meditation in Korean temples [2]. Saengshik is a mixture of powdered raw meals containing whole grains, fruits, vegetables, and other natural materials, and easily eaten by mixing it with water, milk, or other liquids. It has also been shown to have higher nutritional value [3] and had a greater anti-inflammatory effect than Sunsik in our study. Several studies have reported that Saengshik has protective effects on carbon tetrachloride (CCl4)-induced protein oxidative damage in mouse liver, and other health benefits, such as anti-diabetes, anti-hyperlipidemia, anti-obesity, immune enhancement, anti-oxidative, detoxifying, fatty liver improving, and other effects in human and animal studies [4567891011]. Natural raw meal (NRM), called raw meal in America, which is regarded as a natural health food, contains high levels of freeze-dried fresh whole grains, vegetables, and berries instead of legumes due to high allergic score [12], which is a critical difference between it and Saengshik manufactured in South Korea [5].
Obesity is a cause of chronic diseases [13]. Unhealthy lifestyle, particularly high intake of fat and carbohydrates, is the main cause of obesity, which is known to be associated with chronic systemic inflammation, and diseases such as diabetes, cardiovascular disease, and cancer [14]. Approximately 66% of adult Americans are considered overweight or obese, and it was found that such morbidity has increased over time [15]. In addition, association of high-fat intake with promotion of inflammatory bowel disease (IBD) such as Crohn's disease (CD) and ulcerative colitis (UC) has also been reported [16]. Adipose tissues are important endocrine organs that secrete various cytokines, such as TNF-α and IL-6, and modulate the activities of immune cells, macrophages, and mast cells [17]. These immune cells, in themselves or due to intercellular interactions or interactions with adipocytes, increase the expression of leukocyte adhesion molecules, chemokines, and adipokines, such as leptin and adiponectin, and thereby enhance inflammatory response and exacerbate IBD [18]. In particular, Batra et al. [19] reported that leptin, the well-known adipokine in adipose tissues, was found to accelerate progress of IBD in a comparative mouse model.
The etiology of UC remains unclear. In general, its pathogenesis is believed to involve complex interactions between the intestinal microbial environment, persistent pathogenic infections, dysregulation of the colonic mucosal immune system, and genetic and environmental factors [20]. Currently, it is widely accepted that UC and CD are caused by inflammation-related, cytokine-driven, and/or mixed inflammatory infiltrates in intestinal mucosa [21], and it is clear that levels of inflammatory factors, such as TNF-α, IL-1β, IL-6, and IL-8, are elevated in the inflamed colonic tissues of patients [22]. Furthermore, the combination of high-fat diet (HFD)-induced obesity and dextran sodium sulfate (DSS)-induced chronic UC induced by DSS synergistically exacerbate colon inflammation [23]. Therefore, we designed an obesity-associated colitis mouse model based on induction with HFD+DSS treatment and used it to evaluate the anti-inflammation effects of NRM.
MATERIALS AND METHODS
Samples and preparation of the experimental diet
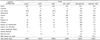
Natural raw meal (NRM, JUVO®) was provided by Erom Inc. (La Mirada, CA, USA), and it was manufactured in an NPA GMP Organic certified facility to ensure quality control, and stored at room temperature until needed. This material contains freeze-dried and powdered brown rice, fruits and vegetables, and other materials. Its main ingredients are brown rice, black rice, millet flour, berries, parsley, beet, mushroom, chlorella, broccoli, carrots, pumpkin, kale, burdock, spirulina, cabbage, spinach, potato, and sweet potato. The nutrient contents of NRM were analyzed by the Korean Health Supplement Institute according to the Food Code of South Korea (results are summarized in Table 1). Other than those compounds, NRM is presumed to be rich in phytochemicals including polyphenols, anthocyanins, phytosterols, flavonoids, tocopherols, gammaoryzanol, resistant starch (RS), and dietary fiber [2425].
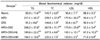
Male C57BL/6J mice (6 weeks old, 16-18 g) were purchased from Samtako Bio Korea (Gyeonggi-do, South Korea), and were housed under a 12-h light/dark cycle at room temperature with ad libitum access to food and water. Animals were randomly divided into six groups of ten mice per group: group 1 (Normal) mice were given a normal diet (AIN-93G); group 2 (HFD) mice were given a HFD (AIN-93G; 45% HFD), group 3 (DSS) mice were given a normal diet and DSS (2%, w/v), group 4 (HFD+DSS) mice were both given an HFD and treated with DSS, group 5 (HFD+DSS+NL) and group 6 (HFD+DSS+NH) mice were given an HFD containing 30% and 70% NRM and treated with DSS, respectively.
The compositions of the experimental diets used in this study are shown in Table 2. To resolve the differences of nutrient in the control diet and the experimental diet containing NRM, the NRM used in this study was analyzed for its carbohydrate, lipid, and protein. All diets were prepared to have an equivalent energy density. Animals were given DSS (2%, w/v) in drinking water for week 1 and week 4 of the experiment [26]. At the end of the 8-week experimental period, mice were euthanized using CO2. Colon lengths and weights were determined and blood samples collected from inferior vena cava were transferred to tubes and centrifuged (3,000 × g for 10 min at 4℃) for the biochemical assay of sera. The protocol used for this study was approved by the Institutional Animal Care and Use Committee (PNU-IACUC; approval number PNU-2009-00034) of Pusan National University in Busan, Korea.
Chemicals reagents
TriZol, oligo dT18 primer, reverse transcriptase buffer, dNTPs, murine Maloney leukemia virus (MMLV) reverse transcriptase, RNase inhibitor, and agarose were obtained from Invitrogen Life Technologies (Carlsbad, CA, USA). Ethidium bromide (EtBr) was purchased from Sigma (St. Louis, MO, USA), and dextran sulfate sodium (DSS; molecular weight: 36,000-50,000) from MP Biomedical (Solon, OH, USA). All chemicals used were of analytical grade.
Serum levels of triglyceride, total cholesterol, low density lipoprotein and high density lipoprotein assay
Serum levels of triglyceride (TG), total cholesterol (TC), low density lipoprotein (LDL), and high density lipoprotein (HDL) were determined using commercial assay kits purchased from Asan Pharmaceutical (Seoul, South Korea). Serum insulin, leptin, and adiponectin levels were also determined using a commercial ELISA kit (Biolegend, San Diego, CA).
Histological observations
Samples of distal colon of each animal were examined histologically. Colon tissues were fixed in 10% (v/v) neutral buffered formalin, dehydrated in ethanol, and embedded in paraffin. Sections (4-µm thick) were then prepared and stained with hematoxylin and eosin (H&E). A Zeiss Axioskop 2 Plus microscope (Carl Zeiss Microimaging, Thornwood, NY, USA) equipped with an AxioCam MRc5 CCD camera (Carl Zeiss) was used for acquisition of images.
Measurement of serum pro-inflammatory cytokine levels
Serum pro-inflammatory cytokine levels were measured using a commercial ELISA kit (ELISA MAK; Biolegend, San Diego, CA). After performing reactions, absorbance was measured at 450 nm using a spectrophotometer.
RT-PCR of pro-inflammation cytokines and inflammation-related enzymes
The colonic expressions of the mRNAs of TNF-α, IL-1β, IL-6, iNOS, and COX-2 were measured by RT-PCR. Total RNA was isolated from colonic tissue (100 mg) using Trizol reagent (according to the manufacturer's recommendations), centrifuged at 12,000 × g for 15 min at 25℃ after the addition of chloroform. Isopropanol was then added (1:1 v/v) to supernatants and total RNAs was pelleted by centrifugation at 12,000 × g for 15 min at 4℃. After washing pellets with ethanol, RNAs were solubilized in diethyl pyrocarbonate-treated RNase-free water and quantified by measuring absorbance at 260 nm using a UV-2401PC spectrophotometer (Shimadzu, Kyoto, Japan). Equal amounts of RNA (1 µg/µl) were reverse-transcribed in a master mix containing 1 × reverse transcriptase buffer, 1mM dNTPs, 500 ng of oligo dT18 primers, 140 units of MMLV reverse transcriptase, and 40 units of RNase inhibitor for 45 min at 42℃. PCR was then performed in an automatic thermocycler (Bioneer, Daejeon, South Korea) over 25 cycles (94℃ for 30 s, 55℃ for 30, 72℃ for 40 s) followed by an 8-min extension at 72℃. PCR products were separated in 2% agarose gels and visualized by EtBr staining. Gene expressions were quantified using Image J software (NIH, Maryland, MD, USA). β-actin was used as an internal control.
Statistical analysis
Results are presented as mean ± SD. Significances of differences between mean values were assessed using one-way ANOVA with Duncan's multiple range test. P-values of < 0.05 were considered significant. Statistical analysis was performed using the SAS v 9.1 software package (SAS Institute Inc., Cary, NC, USA).
RESULTS
Effect of NRM on body weights and serum lipid profiles in HFD and DSS-induced colitis mice
Body weights
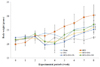
As shown in Fig. 1, mice in the Normal group (24.1 ± 2.2 g) had significantly lower body weights than those in the HFD group (27.9 ± 3.0 g, P < 0.05). However, mice in the DSS group (20.5 ± 0.8 g) had significantly lower body weights than normal controls (P < 0.05). Mean body weight in the HFD+DSS group (24.5 ± 2.8 g) was between those of the HFD and DSS groups. Mice fed low- and high levels of NRM had 24.7 ± 3.0 g and 23.5 ± 1.0 g of body weight, respectively, which were close to that of normal group.
Serum levels of TG, TC, LDL, and HDL
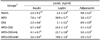
Similar serum levels of TG, TC, LDL, and HDL were observed in the normal and DSS control groups were similar. Serum levels of TG and TC were lower in the normal controls (92.0 ± 11.0 mg/dl for TG and 143.7 ± 6.0 mg/dl for TC) than in HFD-treated mice (217.1 ± 20.3 mg/dl for TG and 270.7 ± 27.8 mg/dl for TC; Table 3). DSS reduced serum TG and TC levels to 91.2 ± 8.6 mg/dl and 144.6 ± 1.9 mg/dl, respectively, but these concentrations were not significantly lower than in normal controls. In the HFD+DSS group, serum levels of TG and TC were 208.2 ± 27.0 mg/dl and 267.8 ± 31.7 mg/dl, respectively, similar to those in the HFD group. Following treatment with low- or high-NRM, NRM reduced TG levels to 184.6 ± 22.2 mg/dl and 169.1 ± 18.4 mg/dl, respectively, and TC levels to 247.5 ± 8.6 mg/dl and 225.2 ± 7.3 mg/dl, respectively, versus the HFD+DSS group (P < 0.05).
Serum LDL level was lower in normal controls (36.4 ± 7.1 mg/dl) than in the HFD group (177.0 ± 30.5 mg/dl; P < 0.05), but non-significantly higher than in DSS controls (35.4 ± 6.7 mg/ml). In the HFD+DSS group, serum LDL (173.9 ± 25.0 mg/dl) was similar to that in the HFD group. Treatment with low- and high-NRM decreased the LDL level to 143.1 ± 10.1 mg/dl and 120.0 ± 3.5 mg/dl compared with HFD+DSS, respectively.
Serum HDL level was higher in normal controls (88.9 ± 3.3 mg/dl) than in the HFD group (50.4 ± 5.1 mg/dl). Serum level of HDL in DSS controls was 90.9 ± 6.1 mg/dl, similar to that found in normal mice (88.9 ± 3.3 mg/dl). In the HFD+DSS group, mean HDL serum level (52.3 ± 3.4 mg/dl) was similar to that observed in the HFD group (50.4 ± 5.1 mg/dl). Following treatment with low- or high-NRM, serum levels of HDL were higher (67.5 ± 10.2 mg/dl and 71.4 ± 6.9 mg/dl, respectively) in the HFD group than that in the HFD+DSS group (52.3 ± 3.4 mg/dl). High NRM treatment effectively decreased elevations in the serum levels of TG, TC, and LDL and increased HDL levels caused by HFD or HFD+DSS.
Serum levels of insulin, leptin, and adiponectin
Serum level of insulin was lower in normal controls (2.3 ± 0.3 ng/ml) than in the HFD group (7.6 ± 1.6 ng/ml), but DSS did not influence serum levels (Table 4). Serum insulin (6.7 ± 0.6 ng/ml) in the HFD+DSS group was similar to that in the HFD group. NRM treatment significantly reduced serum insulin elevations versus the HFD+DSS group to 4.1 ± 0.7 ng/ml (low NRM) and 3.6 ± 0.4 ng/ml (high NRM), respectively (P < 0.05).
Serum level of leptin was lower in normal controls (2.4 ± 0.4 ng/ml) than in the HFD group (30.9 ± 0.7 ng/ml). However, DSS treatment increased serum leptin levels non-significantly to 3.1 ± 0.5 ng/ml versus normal controls. In the HFD+DSS group, mean serum leptin (24.5 ± 1.5 ng/ml) was similar to that observed in the HFD group. NRM treatment significantly decreased serum leptin elevation by HFD+DSS to 23.7 ± 0.8 ng/ml (low NRM) and 19.6 ± 1.8 ng/ml (high NRM) (P < 0.05).
Serum level of adiponectin was higher in normal controls (9.6 ± 0.3 ng/ml) than in the HFD group (3.6 ± 0.1 ng/ml). However, DSS treatment did not affect serum adiponectin level (8.9 ± 0.9 ng/ml). In the HFD+DSS group mean serum adiponectin level (4.1 ± 0.3 ng/ml) was similar to that observed in the HFD group. NRM treatment resulted in significantly increased serum adiponectin levels by HFD+DSS to 5.0 ± 0.5 ng/ml (low NRM) and 5.9 ± 0.2 ng/ml (high NRM) (P < 0.05).
Effect of NRM on colon length and colon weight-to-length ratio in C57BL/6J mice
Colon length and weight-to-length ratio are used as markers of the degree of colitis (Fig. 2). Shorter colon length was observed in the HFD group (6.7 ± 0.4 cm) and DSS group (5.1 ± 0.4 cm) than in the Normal group (7.7 ± 0.4 cm). Mean colon length (4.8 ± 0.4 cm) was lower in the HFD+DSS group than in the HFD and DSS groups. In particular, colon length was shorter in the HFD+DSS group than in the DSS-treated group. However, low and high NRM treatment significantly increased colon shortening in the HFD+DSS group to 6.1 ± 0.5 cm and 6.7 ± 0.8 cm, respectively (P < 0.05).
Colon weight-to-length ratio was lower in normal controls (20.7 ± 4.4 mg/cm) than in the HFD (35.2 ± 2.8 mg/cm) and DSS (65.3 ± 6.1 mg/cm) groups. Colon weight-to-length ratio was greatest in the HFD+DSS group (72.4 ± 13.9 mg/cm). However, low and high NRM treatment significantly reduced this colon weight-to-length ratio increase (40.4 ± 4.9 and 32.9 ± 7.7 mg/cm, respectively) (P < 0.05).
Histological observations of colonic tissues
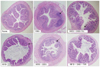
Overall inflammation was observed in the HFD group and DSS groups. The HFD group showed slight pre-inflammatory condition, whereas the DSS group showed a prominent inflammatory condition, compared with the normal group. In addition, mucus of the HFD+DSS group showed deterioration in inflammation versus the normal group. Low- and high density NRM treatment reduced inflammatory reactions. Low density NRM inhibited inflammation compared with the HFD+DSS group, whereas the suppression of inflammation achieved by high NRM treatment was similar to that observed in the normal group (Fig. 3).
Serum levels of pro-inflammatory cytokines
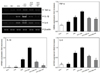
The effects of NRM on serum levels of TNF-α, IL-1β, and IL-6 were evaluated by ELISA assay. As shown in Fig. 4, the serum level of TNF-α was lower in normal controls (117.0 ± 4.5 pg/ml) than in the HFD group (152.1 ± 12.5 pg/ml). DSS treatment increased the serum TNF-α level to 233.1 ± 18.9 pg/ml, and the highest serum level of TNF-α was observed in the HFD+DSS group (247.4 ± 6.3 pg/ml). However, high NRM treatment significantly decreased the increase observed in the HFD+DSS group to 150.4 ± 15.2 pg/ml (P < 0.05).
Serum level of IL-1β was lower in normal controls (30.6 ± 14.4 pg/ml) than in the HFD group (42.7 ± 5.1 pg/ml). DSS treatment increased serum IL-1β to 89.8 ± 13.5 pg/ml versus normal controls. Serum IL-1β (101.5 ± 13.4 pg/ml) was highest in the HFD+DSS group. However, high NRM treatment significantly decreased the increase in serum IL-1β observed in the HFD+DSS group to 60.2 ± 13.8 pg/ml (P < 0.05).
Serum level of IL-6 in normal controls (81.3 ± 22.2 pg/ml) was lower than that in the HFD group (110.0 ± 6.7 pg/ml). DSS treatment increased mean serum IL-6 to 256.5 ± 27.0 pg/ml. The highest serum level of IL-6 (285.2 ± 24.9 pg/ml) was observed in the HFD+DSS group. High NRM treatment significantly reduced this HFD+DSS-induced increase in IL-6 serum level to 206.9 ± 19.0 pg/ml (P < 0.05).
Colonic mRNA levels of pro-inflammatory cytokines
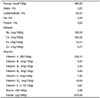
As shown in Fig. 5, TNF-α mRNA level was lower in normal controls (0.32) than in the HFD group (0.48). DSS treatment increased the TNF-α mRNA to 0.71. TNF-α mRNA levels were highest in the HFD+DSS group (1.00). However, high NRM treatment significantly decreased the overexpressed TNF-α mRNA to 0.62 (P < 0.05). IL-1β mRNA levels were highest in the HFD+DSS group (1.00). DSS treatment increased mean IL-1β mRNA to 0.41. However, high NRM treatment significantly decreased the IL-1β mRNA overexpression (P < 0.05). IL-6 mRNA level was lower in normal controls (0.15) than in the HFD-treated group (0.18). DSS treatment increased mean IL-6 mRNA to 0.73. IL-6 mRNA levels were highest in the HFD+DSS group (1.00). However, high NRM treatment significantly reduced the IL-6 mRNA levels to 0.37 (P < 0.05).
mRNA levels of inflammation-related enzymes in colonic mucosa
Significantly higher iNOS and COX-2 mRNA expression was observed in the colonic mucosa in the HFD and DSS groups than in normal controls (P < 0.05, Fig. 6), and these expressions were highest in the HFD+DSS group. However, Low- or high NRM treatment significantly reduced the increases observed in the HFD+DSS group (P < 0.05).
DISCUSSION
NRM, American-style Saengshik, is a non-cooked health food prepared from whole grains, vegetables, and berry fruits. Furthermore, NRM contains a mixture of phytochemicals including anthocyanin, phytosterols, gamma-oryzanol, RS, and dietary fiber which synergistically enhance health benefits [102427].
In this study, we found that NRM showed activity against HFDand DSS-induced colitis in C57BL/6J mice. HFD treatment resulted in significantly increased body weight and obesity-related biomarkers, whereas DSS treatment resulted in decreased body weight and did not affect obesity-related biomarkers. In addition, NRM supplementation decreased HFD-induced body weight gain in HFD+DSS-treated mice, and reduced the weight loss caused by DSS treatment. In addition, high levels of NRM maintained body weight in HFD and DSS treated mice at normal levels, and high and low levels of NRM reduced increase in TG, TC, and LDL levels and reductions in HDL levels in HFD+DSS treated mice. These results are similar to the improvements in obesity-related biomarkers reported for Saengshik [6], a health food with anti-obesity effects in women [7]. As a main ingredient in NRM, brown rice contains high levels of RS and is recognized as a low glycemic index food [28], and low glycemic index foods have been reported to increase insulin sensitivity and improve insulin resistance [29]. In mice, reductions in serum insulin are associated with insulin resistanceinduced chronic inflammation [30], and recent studies have shown that leptin is not only pro-inflammatory but also antiapoptotic enough to cause advancement of colitis to a cancerous status [31]. Increase in adiponectin level to reduce inflammatory response in women has also been reported [32]. In the current study, we found that NRM treatment resulted in significantly decreased serum levels of leptin and insulin, and increased serum levels of adiponectin in HFD+DSS-treated mice.
In general, colon length and colon weight-to-length ratio provides a useful index for evaluation of the inflammatory status in a colitis model [33]. Based on our observations, 8 weeks of 45% HFD administration resulted in significantly shortened colon lengths and increased colon weight-to-length ratios in mice, whereas co-treatment with HFD and 2% DSS resulted in significantly decreased colon lengths and increased colon weight-to-length ratios versus DSS- or HFD-treated mice. In contrast, NRM treatment significantly suppressed colon length shortening, decreased colon weight-to-length ratios, and protected colons from cell damage induced by exposure to HFD and/or DSS. In histological study, we found that HFD and/or DSS treatment induced colitis inflammatory condition in mice, while co-administration of NRM suppressed such progression of colitis. In addition, HFD significantly increased the expression of pro-inflammatory cytokines associated with colitis, and DSS induced these cytokines to greater extents [23]. In the current study, the HFD+DSS group showed enhanced serum TNF-α, IL-1β, and IL-6 levels, and treatment with NRM prevented these increases in mice treated with HFD and/or DSS. In addition, treatment with a high level of NRM decreased the mRNA levels of TNF-α, IL-1β, and IL-6 in colon tissues. Overexpression of proinflammatory cytokines (TNF-α, IL-1β, IL-6 and IL-8) is known to occur in the intestinal mucosa of IBD patients [18].
High intake of whole grains, vegetables, and fruits, which contain high levels of antioxidants, dietary fiber, and functional phytochemicals, might have a chemopreventive effect on colorectal diseases [34353637]. In particular, functional phytochemicals in brown rice suppress the DSS-induced expression of TNF-α and IL-6 mRNA [35]. Similarly, the dietary fiber and polyphenols in millet also suppress the production of these pro-inflammatory cytokines [36] and fruits and vegetables have been reported to significantly decrease the serum levels of some inflammatory markers, including TNF-α and IL-1β [34]. Berries, which are enriched in anthocyanins, have anti-inflammatory effects as demonstrated by their ability to inhibit expressions of pro-inflammatory genes, such as TNF-α and IL-1β [25]. All of the compounds referred to above are present in NRM, and thus, probably contributed to the improvements in colonic conditions observed in this study.
iNOS and COX-2 are involved in early inflammatory reactions [38]. We found that the mRNA expressions of iNOS and COX-2 were significantly increased in the colonic mucosa of DSS controls. mRNA expressions of iNOS and COX-2 were higher in the HFD+DSS group than those in DSS controls. HFD+DSS induced the highest levels of these pro-inflammatory cytokines (TNF-α, IL-1β, and IL-6) in serum and colon tissues. However, low- or high NRM treatment significantly decreased the increases in the mRNA expressions of iNOS and COX-2 observed in HFD+DSS treated mice. Accordingly, our results suggest that high levels of NRM in the diet could contribute to prevention of colitis.
Berries contain high levels of anthocyanins such as cyanidin-3-glucoside and malvidin-3-glucoside, which reduce NO generation in RAW 264.7 mouse macrophages and suppress iNOS and COX-2 expression in endothelial cells [2539]. In addition, the high dietary fiber and polyphenol levels in millet also suppress COX-2 and iNOS activation [37]. Dietary fiber prevents feces from remaining in the colon for protracted times in contact with gastrointestinal mucosa, and thus reduces colon inflammation [40]. In addition, as a main ingredient in NRM, brown rice contains high levels of RS, which has been shown to increase fecal bulking and production of short-chain fatty acids to reduce fecal pH and produce high levels of butyric acid, one of the main energy substrates of large intestinal epithelial cells and has been reported to reduce the carcinogenesis of intestinal cells [41]. RS has also been shown to promote the growth of probiotics (such as lactic acid bacteria and bifidobacteria), which are essential for maintenance of the intestinal microbial environment and prevention of colonic disease [42]. Thus, RS in NRM might ameliorate colitis. We also observed that other health promoting materials might synergistically reduce HFD and DSS-induced colitis.
In conclusion, NRM treatment suppressed HFD-induced body weight gain and DSS-induced body weight loss. High levels of NRM maintained body weights in HFD+DSS-treated mice to near the normal treatment level. NRM showed anti-obesity effects by modulating serum lipid profiles (TG, TC, LDL, and HDL), serum insulin and leptin levels, and by increasing adiponectin in HFD- and DSS-treated mice. High levels of NRM prevented colon shortening and colon weight-to-length ratio gains in HFD- and/or DSS-treated mice. In addition, NRM reduced the infiltration of inflammatory cells and suppressed mucosal injury in the colon tissues of HFD and/or DSS-treated mice by modulating pro-inflammatory cytokine (TNF-α, IL-1β, IL-6) levels in serum and colon tissues and by reducing the expressions of inflammatory iNOS and COX-2. These results suggest that NRM might have a significant inhibitory effect in obesity and DSS-induced inflammation-associated colitis mice. As NRM is a mixture of multiple food ingredients, however, no single ingredient can account for the efficacy of NRM; such efficacy might be due to increased bioactive compounds from the ingredients and/or synergistic effect of each ingredient in NRM. Thus, further studies are required to determine the mechanism whereby NRM prevents the inflammation associated with colitis and to optimize levels of ingredients in NRM with respect to efficacy.


 XML Download