

 PDF
PDF ePub
ePub Citation
 Print
Print


INTRODUCTION
The prevalence of food allergies is 3-5% in adults and 3-8% in children worldwide [12]. Furthermore, the rate of self-reported food allergies has risen up to 25% in the United States. The prevalence of food allergies has increased, resulting in a greater frequency of public health problems. A previous study in 2007 reported an overall prevalence of self-reported food allergies from 1.7% to 17%, although there were limitations in determining accurate incidences such as rapid evolution of food allergies, lack of confirmative diagnostic tests, and numerous potential factors [234]. A 23 large-scale meta-analysis of the EuroPrevall program reported overall prevalence rates of 12% for self-reported food allergies in infants and children as well as 13% across all ages [3]. Lee et al. [5] reported prevalence rates of 12.6% for experienced food allergies in students along with self-reported food allergy rates of 5.8% among 27,679 children and adolescents in Korea.
Food allergies are associated with a variety of symptoms, ranging from mild to severe or life-threatening, affecting the skin (urticaria, dermatitis, eczema, angioedema, and itching), gastrointestinal tract (nausea, vomiting, diarrhea, and abdominal cramping), and respiratory tract (rhinitis, asthma, and laryngeal edema), in addition to anaphylactic shock [6]. Anaphylactic shock is the most frightening food-allergic symptom and develops very rapidly after ingestion of allergenic foods, leading to death if prompt treatment is not provided [7].
There are more than 160 foods confirmed to cause food allergies [6]. However, the most common allergenic foods are eggs, cow's milk, soy, and peanuts in infant and children. For adults, wheat, shellfish, peanuts, and tree nuts are the most common allergenic foods [8]. The only consistent preventive method is complete avoidance of all foods containing the causative allergen. Accordingly, complete and accurate allergen labeling is essential to successful avoidance of problematic allergens by food-allergic consumers [9]. Food labeling legislation was passed in Australia and New Zealand, followed by the European Commission and United States in 2003-2004 [10]. In Korea, allergenic labeling regulations introduced in 2004 require mandatory labeling of 12 allergenic foods: eggs, cow's milk, buckwheat, peanuts, soybeans, wheat, mackerel, crab, shrimp, pork, peaches, and tomatoes as well as ingredients from those foods [8]. Although allergenic food labeling regulations were introduced, there is still room for improvements to current allergenic labeling, which provides insufficient information and confusing terminology [11]. Several studies have investigated consumer preferences and satisfaction regarding allergenic food labeling. In a report by Lee et al. [12], 993 consumers who visited seven university hospitals were not satisfied with existing labeling practices. Cornelisse-Vermaat et al. [13] also showed that consumers with food allergies in Greece and Netherlands indicate problems of readability and accessibility to allergen information on labels. Therefore, the objective of this study was to investigate food allergens and prevalence rates of food allergies, followed by comparison of consumer attitudes and preferences regarding food labeling by diagnosis of food allergies.
SUBJECTS AND METHODS
Study population and study design
A total of 543 individuals living in Seoul and Gyeonggi area participated in the survey from October 15 to 22 in 2013. The participants were grouped by age; teenagers (elementary, middle, and high school students), twenties, thirties, forties, fifties, and sixties. The questionnaire consisted of four sections based on a review of the literature related to food allergies [513141516]. The study was approved by the institutional review board of Yonsei University (1040917-201311-SB-125-02), Seoul, Korea.
The first section contained three questions that identified subjects' food allergy information, including diagnosis by a doctor. The second section contained six items that assessed subjects' attitudes toward food labeling, including brand, nutrition facts, origin, food allergens, quality, and overall checking, on a 5-point Likert scale ranging from 1 " Never check" to 5 "Always check" for checking labels. The third section consisted of six items, including bold font, font color, box frame, warning statement, front label for allergens, and addition of potential allergens for improvement of labeling information, on a using 5-point Likert scale ranging from 1 "Strongly disagree" to 5 "Strongly agree". The final section consisted of general characteristic questions such as residential area, gender, age, job, and education level.
Statistical analysis
The data were analyzed using the Statistical Package for Social Science (Ver. 21.0, SPSS, Inc., Chicago, IL). For the categorical variables, frequency and percentage were calculated using frequency analysis. For the continuous variables, descriptive analysis was generated for mean and standard deviation. Significant testing was conducted by One-way Anova. When a significant difference was observed, Duncan's multiple comparison was used to examine differences between the doctor-diagnosed group and self-reported group at P < 0.05. Partial Least Square Regression (PLSR) Analysis was performed for correlation between attitudes of food labeling and improvement of food allergen labeling system based on whether or not respondents had diagnosed food allergies.
RESULTS
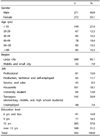
General characteristics of respondents
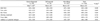
A total of 543 participants returned the questionnaire from 558, resulting in a response rate of 97.3%. Table 1 shows the general characteristics of the respondents. The respondents' age range was teenagers (27.3%), twenties (12.9%), thirties (14.9%), forties (14.7%), fifties (15.5%), and sixties and more (14.7%). Approximately 50% of respondents were women. The majority of respondents lived in a large city (92.1%), and the highest education level of respondents was 68.8% high school or higher.
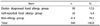
Food allergy prevalence rates of respondents
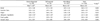
Table 2 presents food allergy prevalence rates of respondents. The number of respondents who had food allergies was 130 (23.9%), which included doctor-diagnosed (n = 95, 17.5%) and self-reported respondents (n = 35, 6.4%). The other 413 respondents out of 543 did not report food allergies.
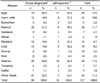
Types of food allergens reported by doctor-diagnosed and self-reported respondents
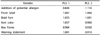
Table 3 shows food allergens reported by doctor-diagnosed and self-reported respondents. For allergens reported by doctor-diagnosed respondents, peaches (30.3%) was reported as the highest food allergen, followed by peanuts (21.3%), eggs (20.2%), and crab (13.8%). For allergens reported by self-reported respondents, eggs (33.3%) was reported as the most common allergen, followed by peaches (30.3%), milk (27.3%), peanuts (18.2%), and crab (18.2%). In addition, other allergenic foods such as kiwi, pineapple, taro, hazelnut, pine nuts, pistachio, walnut, and mushroom showed a rate of 11.2% among food allergenic respondents.
Comparison of attitudes regarding improvement of food allergen labeling and checking food labels according to food allergy status
Table 4 shows attitudes regarding improvement of food allergen labeling system based on food allergy status of the respondents. All respondents reported that all six items (bold font, font color, box frame, warning statement, front label, and addition of potential allergens) were necessary for an improved food allergen labeling system. However, there were no significant differences among doctor-diagnosed, self-reported, and non-allergenic groups. Table 5 presents differences in food labeling attitudes according to food allergy status of respondents. On average, all respondents gave middle (3/5 points) scores for all items, except food allergen label check item. For checking food allergen labels, there was a significant difference between allergic and non-allergic respondents (P < 0.001).
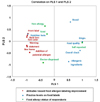
Partial Least Square Regression (PLSR) Analysis between food allergen labeling improvement and labeling attitudes of respondents
In Fig. 1, PLSR analysis was used to illustrate the correlation between food allergen labeling improvement and labeling attitudes of respondents. Partial Least Square Regression (PLSR) analysis analyzes the correlation between two data points and provides a visual summary [171819]. The result shows that the doctor-diagnosed group and checking food allergens were positively correlated, whereas the non-allergy group was more concerned with checking brand of products. Self-reported group checked overall labeling information and especially origin and food quality. In PLSR analysis, all respondents answered that improvement of allergen labeling system is necessary. Regarding the effects of food allergen labeling improvement on labeling attitudes of respondents, variable importance in the projection (VIP) was calculated by PLSR analysis (Table 6). Food allergen labeling improvement with a VIP value greater than 1 had a large impact on labeling attitudes of respondents [2021]. The factors of food allergen labeling improvement in PLS 1 for affecting labeling attitudes of respondents were 'Front label', 'Bold font', 'Font color', and 'Warning statement', whereas the factors in PLS 2 affecting labeling attitudes of respondents were 'Addition of potential allergen', 'Front label', and 'Bold font'.
DISCUSSION
This study compared food labeling attitudes and food allergen labeling improvement by diagnosis of food allergies. The results show that prevalence of doctor-diagnosed food allergies was 17.5%, and 6.4% of respondents self-reported food allergies. The most common allergens of doctor-diagnosed and self-reported food allergy respondents were peaches (30.3%) and eggs (33.3%), respectively, followed by peanuts, cow's milk, and crab. For consumers' attitudes toward food labeling, the rate of checking food allergens was only significantly different between allergic and non-allergic respondents among all five items (P < 0.001). All respondents reported that all six items (bold font, font color, box frame, warning statement, front label, and addition of potential allergens) were necessary for an improved food allergen labeling system. PLSR analysis showed that the doctor-diagnosed group and checking food allergens were positively correlated, whereas the non-allergy group was more concerned with checking product brand.
Shah et al. [22] reported that the prevalence of self-reported food allergies ranges from 3 to 35% in America. On the other hand, the prevalence of self-reported food allergies is 20-25% of the population in Korea [23]. Lee et al. [5] surveyed 27,679 elementary, middle, and high school students in Korea and found that the prevalence of food allergies in students was 12.6% with doctor-diagnosed food allergies at 6.8%. Peaches (17.5%) was found to be one of the most common food allergens. Our results show a higher prevalence (23.9%) of food allergies than other studies [524]. The higher prevalence of food allergies in our study may be attributed to several factors. First, 27% of respondents were children and adolescents aged 19 or younger, who usually show higher prevalence of food allergies than adults. Second, some respondents might have been confused about food allergy/food intolerance due to misconceptions concerning accurate food allergy knowledge, self-diagnosis, and parental diagnosis. Third, some respondents may have been unaware of tolerance to food allergens (eggs and cow's milk) after diagnosis of food allergies at an earlier age. Forth, up to 60% of allergies from fruits and vegetables may actually be oral allergy syndrome instead of anaphylaxis shock in accordance with a previous study [4625262728].
In our results, the most common allergens of doctor-diagnosed and self-reported food allergy respondents were peaches (30.3%) and eggs (33.3%). Lee et al. [12] surveyed 993 parents with allergic children and adults and investigated the prevalence of allergenic foods. It was found that peaches (18.6%) was the most common allergenic food, followed by eggs (14.2%), cow's milk and products (9.7%), and mackerel (8%) among adults. On the other hand, eggs (27%) was the most common allergenic food, followed by cow's milk and products (18.3%), peaches (10.4%), and shrimp (8.6%) among children. Lee et al.'s study [5] reported that the most common allergenic foods were cow's milk and shrimp (7.0%), followed by eggs and mackerel (5.8%), peanuts and tomatoes (3.5%), wheat and crab (2.3%), and pork, peaches, and soybean (1.2%).
Over 160 allergenic foods have been reported worldwide. In addition, the variety of allergenic foods is usually determined by age, ethnicity, and country. For children, the most common allergenic foods are eggs, cow's milk, peanuts, seafood, and tree nuts. Among adults, peanuts are probably the most common allergenic food, followed by tree nuts, seafood, and crustaceans (shrimp, crab, and lobster) [68]. Allergies toward cow's milk or eggs are usually outgrown during childhood or adolescence [29]. A study on the prevalence and main characteristics of food allergenic school children in France reported that 62 children (25.4%) among 182 food allergenic respondents outgrew their food allergies [30]. Peanut allergy is more common in America than in other countries due to the popularity of peanut butter. Likewise, in Southeast Asian countries such as Japan and Korea, buckwheat allergy is more common than in other parts of the world since buckwheat noodles and products are popular. This means that specific foods causing food allergies may be affected by cultural dietary habits [6831]. Our results also demonstrate other specific foods such as kiwi, pineapple, taro, hazelnut, pine nuts, pistachio, walnut, and mushroom as prevalent causes of food allergies among the Korean population. Therefore, clinical research and allergenic food labeling improvement should be performed to investigate specific foods that generate less frequent but severe reactions [6].
In our results, respondents reported that current allergenic labeling practices such as readability (bold font and font color) and visibility of information (box frame and label on front of product) need to be improved. A prior study on public awareness of food allergenic labeling system investigated 993 subjects (337 food allergic and 656 non-allergic consumers) from seven university hospitals in Korea. The results showed that 23.5% of respondents checked food labels, and 46.6% of doctor-diagnosed and 31.8% of self-reported allergic consumers checked allergenic ingredients on labels. Moreover, 73.1% of respondents reported that they were not satisfied with current food allergic labeling practices. Common complaints were 'unclear and too technical ingredient list and allergen information', 'too small font size or undistinguishable color contrast of label for allergen ingredients', and 'inappropriate and insufficient information' [12]. In another study [13], a total of 40 food allergic consumers who suffered from one or more common allergens such as milk, eggs, and peanuts/tree nuts in the Netherlands and Greece were asked for their preferences for current food labeling practices and information. The results showed that the current food labeling system does not meet the needs of food allergic consumers. The main problems were 'label appearance for readability' and 'contents of the ingredient list on the label'. They also reported that some ingredient lists include too much information as well as too technical terms.
In conclusion, an effective food labeling system is very important for health protection of food-allergic consumers. Additionally, government agencies must develop policies regarding prevalence of food allergies in Korea. Based on this information, the food industry and government agencies should provide clear and accurate food labeling practices for consumers.
 XML Download