

 PDF
PDF ePub
ePub Citation
 Print
Print


INTRODUCTION
Diabetes mellitus is a chronic disease representing one of the world's most serious health concerns. Primarily, diabetes mellitus has been classified into type 1 diabetes and type 2 diabetes. The incidence of type 2 diabetes is increasing around the globe [1]. Type 2 diabetes is mostly a defect that is characterized by high blood glucose due to insulin resistance and a reduced sensitivity to insulin in muscle, adipose, and liver cells [2,3]. Currently available drugs for type 2 diabetes include insulin secretagogues, such as sulfonylurea, and insulin sensitizers, such as thiazolinedione [4]. However, pharmacological agents for type 2 diabetes exhibit a number of limitations, such as side effects and high rates of secondary failure [5]. Thus, person with diabetes and healthcare professionals are interested in alternative therapies and natural products with the therapeutic potential to treat diabetes, particularly those derived from marine algae or plants because these sources are regarded to be less toxic with fewer side effects compared to their synthetic counterparts.
Marine algae are known to generate an abundance of bioactive compounds with great potential in the pharmaceutical, food, and biomedical industries. In particular, brown algae have many different bioactive compounds, including phycocolloids, pigments, and polyphenolic compounds (e.g., phlorotannins) [6]. The brown alga Sargassum coreanum is produced on Jeju Island in Korea [7]. It has many biological benefits, including its antioxidant effects in free-radical mediated oxidative systems [8] and its inhibitory effect on human immunodeficiency virus [9].
However, the effect of S. coreanum extract on type 2 diabetes has not yet been investigated, especially with respect to alleviating blood glucose concentration, improving insulin resistance, and its effect on the activities of the enzymes involved in hepatic glucose metabolism. Therefore, the present study was conducted to investigate whether S. coreanum extract alleviates hyperglycemia and improves insulin resistance in type 2 diabetes mellitus mice. The efficacy was compared with an oral anti-diabetic agent, rosiglitazone (an insulin sensitizer), for type 2 diabetes.
MATERIALS AND METHODS
Preparation of Sargassum coreanum extract
S. coreanum were collected from the coast of Jeju Island, Korea. The samples were initially washed 3 times with tap water to remove salt, epiphytes, and sand attached to the surface and then carefully rinsed with fresh water. Thereafter, the samples were lyophilized and homogenized with a grinder. The dried S. coreanum powder was extracted 3 times with 80% methanol and then filtered. Subsequently, the methanol extract was filtered through Whatman No.1 filter paper and evaporated under a vacuum at 40℃, and 30 g of extract per 200 g of powdered S. coreanum was obtained. After freeze-drying, the S. coreanum extract was powdered and used in the experiment.
Animals and diets
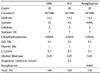
Male C57BL/KsJ-db/db mice were purchased from Japan SLC (Hamamatsu, Japan). The 5-week-old db/db mice were fed a pelletized commercial chow diet for 2 weeks after arrival. The mice were then randomly divided into 3 groups (n = 8). For 6 weeks, the db/db mice in the control of diabetes mellitus group were fed a standard semi-synthetic diet (AIN-93G), while those in the other 2 groups were fed a standard AIN-93G diet with either rosiglitazone (0.005%, w/w) or S. coreanum extract (SCE; 0.5%, w/w) (Table 1). Rosiglitazone and SCE doses were based on references and dosage for human type 2 diabetes patients. Type 2 diabetic patients (BW: 60 kg) take 2 tablet rosiglitazone a day (1 tablet: 2 mg). In mouse dosage terms (BW: 30 g), the daily food intake is 0.002 mg. And then, we were multiply that by human safety index 100. The mice were fed a standard AIN-93G diet with either rosiglitazone (0.005%, w/w). Also, we multiply drug dosage by safety index 100 to decide SCE dose. The mice were fed a standard AIN-93G diet with either SCE (0.5%, w/w). The mice were housed individually in stainless steel cages with a randomized complete block design at a temperature of 23 ± 1℃ and humidity of 53 ± 2% in a light-controlled room with a 12 h light-dark cycle. The mice had access to food and water ad libitum. Food and water intakes were measured periodically manually. After a defined time elapses (24 h), the food and water were reweighed and the amount consumed was calculated by difference. At the end of the experimental period, the mice were anesthetized with ether after withholding food for 12 h, and blood samples were taken from the inferior vena cava to determine the level of plasma biomarkers. Furthermore, the liver was removed after collecting the blood and was rinsed with a physiological saline solution. All procedures were approved by the animal ethics committee of pusan national university (PNU-2012-0078).
Blood glucose and glycosylated hemoglobin concentrations
Glucose concentration in the venous blood drawn from the tail vein was determined using a glucometer (Roche Diagnostics GmbH, Mannheim, Germany) once a week for 6 weeks after a 12 h fast. The anticoagulated whole blood specimen was hemolyzed and the blood glycosylated hemoglobin concentration was measured. Glycosylated hemoglobin levels were determined by immunoturbidimetry.
Plasma insulin concentration
Blood samples from the inferior vena cava were collected into heparin-coated. After centrifugation at 1000 × g for 15 min at 4℃, the plasma was carefully removed from the sample. The levels of plasma insulin were determined by radioimmunoassay with an enzyme-linked immunosorbent assay kit (Linco Research Inc., Billerica, MA, USA).
Homeostatic index of insulin resistance and quantitative insulin sensitivity check index
Intraperitoneal glucose tolerance test
An intraperitoneal glucose tolerance test (IPGTT) was performed during the last week of the experimental period. Twelve-hour-fasted mice received an intraperitoneal injection of glucose (0.5 mg of glucose/g of body weight), and blood samples in the diabetes mellitus control (DMC), SCE, and rosiglitazone db/db mice groups were obtained for glucose measurement at 0, 30, 60, and 120 min. The glucose concentration in the venous blood drawn from the tail vein was determined using a glucometer (Roche Diagnostics GmbH, Mannheim, Germany) every week after a 12 h fast.
Hepatic tissue processing
The livers were perfused via the portal vein with cold 0.25 M sucrose and then excised, blotted, weighed, minced, and homogenized in 9 volumes of 0.25 M sucrose. Each homogenate was subjected to cell fractionation. The cytosolic, mitochondrial, and microsomal fractions were isolated by a sucrose linear density-gradient centrifugation method [12] and stored at -80℃. All of the isolation procedures were performed at 2-4℃. The cytosolic, mitochondrial, and microsomal fractions (hepatic subcellular fractions) were used for the enzyme assays.
Hepatic glucose metabolic enzyme activities
Glucokinase activity was determined by a continuous spectrophotometric assay, as described by Davidson and Arion [13] with a slight modification, wherein the formation of glucose-6-phosphatase at 37℃ was coupled to its oxidation by glucose-6-phosphate dehydrogenase and NAD+. The glucose-6-phosphatase activity was determined according to the method of Alegre et al. [14] with a slight modification; the activity was determined using a spectrophotometric assay containing 100 mmol/L sodium Hepes (pH 6.5), 26.5 mmol/L glucose-6-phosphate, and 1.8 mmol/L EDTA (adjusted to pH 6.5), 2 mmol/L NADP+, 0.6 IU/mL mutarotase, and 6 IU/mL glucose dehydrogenase. The phosphoenolpyruvate carboxykinase activity in the direction of oxaloacetate synthesis was estimated using the spectrophotometric assay developed by Bentle and Lardy [15] with a slight modification; a 1-mL final volume of the purified enzyme was pipetted into a reaction mixture (pH 7.0) containing 50 mmol/L sodium Hepes, 1mmol/L IDP, 1mmol/L MnCl2, 1 mmol/L dithiothreitol, 0.25 mmol/L NADH, 2 mmol/L phosphoenolpyruvate, 50 mmol/L NaHCO3, and 7.2 units of malic dehydrogenase. The enzyme activity was then measured at 25℃ based on a decrease in the absorbance at 340 nm.
Hepatic glycogen assay
The glycogen concentration was determined as previously described by Seifter et al. with some modifications [16]. Briefly, the liver tissue was homogenized in 5 volumes of a 30% (w/v) ice-cold KOH solution and dissolved in a boiling water bath (100℃) for 30 min. The glycogen was precipitated with ethanol and then pelleted, washed, and resolubilized in distilled water. This solution was treated with an anthrone reagent [2 g anthrone/1 L of 95% (v/v) H2SO4, and its absorbance was measured at 620 nm.
Plasma lipid concentration
The plasma total cholesterol (TC), HDL-cholesterol (HDL-C) and triglyceride concentrations were determined using an enzymatic method (Asian Pharmaceutical Corp., Korea), while the plasma free fatty acid (FFA) concentration was determined using an enzymatic colorimetric method (Wako, Japan).
RESULTS
Body weight and food and water intake
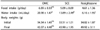
At the start of the study, the db/db mice did not differ significantly in their body weight among the control of diabetes mellitus, rosiglitazone-supplemented, and SCE-supplemented db/db mice groups. During the 6-week period, body weight increased gradually. The body weights of the control of diabetes mellitus, rosiglitazone-supplemented, and SCE-supplemented db/db mice were significantly different at the end of the study. The rosiglitazone-supplemented db/db mice had higher body weight compared to the control of diabetes mellitus and SCE-supplemented db/db mice (Table 2). The daily food intake of these db/db mice did not differ significantly. The rosiglitazone- and SCE-supplemented db/db mice had a significantly lower daily intake of water than the control of diabetes mellitus db/db mice.
Blood glucose and glycated hemoglobin concentrations
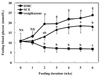
The effects of the SCE and rosiglitazone supplement on blood glucose concentrations are shown in Fig. 1. There were no significant differences in blood glucose concentrations among the groups at the beginning of the experiment. Throughout the experimental period, the blood glucose concentrations of the control of diabetes mellitus db/db mice increased steeply, but those of SCE-supplemented db/db mice increased gradually and to a lesser extent than the control of diabetes mellitus db/db mice. The blood glycated hemoglobin concentration was significantly lower in the SCE-supplemented db/db mice than in the control of diabetes mellitus db/db mice. The blood glycated hemoglobin concentration was effectively reduced in the SCE-supplemented db/db mice, even if the level in these db/db mice was higher than that of the rosiglitazone-supplemented db/db mice (Table 3).
Homeostatic index of insulin resistance, quantitative insulin sensitivity check index, and intraperitoneal glucose tolerance test
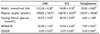
Table 3 shows that the plasma insulin concentrations of the SCE- and rosiglitazone-supplemented db/db mice were significantly lower than that of the control of diabetes mellitus db/db mice. Furthermore, the homeostatic index of insulin resistance and quantitative insulin sensitivity check index were significantly different among the control of diabetes mellitus, rosiglitazone-supplemented, and SCE-supplemented db/db mice. The homeostatic index of insulin resistance was significantly lower in the SCE- and rosiglitazone-supplemented db/db mice than in the control of diabetes mellitus db/db mice. In addition, the quantitative insulin sensitivity check index was significantly higher in the SCE- and rosiglitazone-supplemented db/db mice than in the control of diabetes mellitus db/db mice.
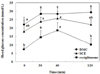
Glucose tolerance was monitored by an intraperitoneal glucose tolerance test at 6 weeks after supplementation with SCE or rosiglitazone (Fig. 2). There was a significant difference in the progression of nonlinear patterns among the control of diabetes mellitus, rosiglitazone-supplemented, and SCE-supplemented db/db mice. In terms of the change point analysis, it was confirmed that the SCE- and rosiglitazone-supplemented db/db mice had a change point at 60 min. Specifically, the blood glucose concentrations in the rosiglitazone-supplemented db/db mice peaked at 60 min and almost recovered to the basal value at 120 min. Similarly, the blood glucose concentrations in SCE-supplemented db/db mice peaked at 60 min and presented with a declined value at 120 min. However, the blood glucose concentrations in the control of diabetes mellitus db/db mice gradually increased and remained at a constant, high level with minimal changes occurring over the course of 30-120 min. In other words, when the mice were injected with glucose, the rates of increase in the blood glucose concentration were similar among the groups during the first 60 min. Subsequently, the blood glucose concentration became significantly higher in the control of diabetes mellitus db/db mice compared to the SCE- and rosiglitazone-supplemented db/db mice.
Hepatic glucose regulating enzyme activities and glycogen levels
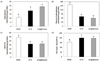
Hepatic glucokinase activity was significantly higher in the SCE- and rosiglitazone-supplemented db/db mice than in the control of diabetes mellitus db/db mice. In contrast, glucose-6-phosphatase activity was remarkably lower in the SCE- and rosiglitazone-supplemented db/db mice than in the control of diabetes mellitus db/db mice. Phosphoenolpyruvate carboxykinase activity was also significantly lower in the SCE- and rosiglitazone-supplemented db/db mice than in the control of diabetes mellitus db/db mice. The hepatic glycogen levels in the SCE- and rosiglitazone-supplemented db/db mice were significantly higher than that in the control of diabetes mellitus db/db mice (Fig. 3).
Plasma lipid
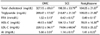
The plasma triglyceride, free fatty acid, total cholesterol, LDL-cholesterol, and atherogenic index levels of the SCE- and rosiglitazone-supplemented db/db mice were significantly lower than those of the control of diabetes mellitus db/db mice, while the plasma HDL-cholesterol was significantly higher in the SCE- and rosiglitazone-supplemented db/db mice than in the control of diabetes mellitus db/db mice (Table 4).
Hepatic function
The levels of ALT and AST were not significantly different among the control of diabetes mellitus, rosiglitazone-supplemented, and SCE-supplemented db/db mice groups (Table 5). The ALT and AST levels of each were within the normal range.
DISCUSSION
Type 2 diabetes mellitus and its related complications have arisen as serious health problems in modern societies. In this study, we demonstrated the anti-diabetic effect of SCE supplementation in C57BL/KsJ-db/db mice. These db/db mice have characteristics that are similar to human type 2 diabetes, including hyperglycemia, obesity, and insulin resistance [16,17,18]. The body weights increased in db/db mice after 6 weeks. The rosiglitazone-supplemented db/db mice experienced significantly greater body weight gain compared to the SCE-supplemented and control of diabetes mellitus db/db mice. These results may be due to increased adipose tissue mass, which has been shown for rodents and humans receiving rosiglitazone treatment [5]. Food intake did not have a significant effect on the groups, but water intake was significantly lower in the SCE- and rosiglitazone-supplemented db/db mice than in the control of diabetes mellitus db/db mice. The typical symptoms of type 2 diabetes are polyphagia, polyuria, and polydipsia. Supplements of SCE and rosiglitazone improved the symptoms of type 2 diabetes compared to the control of diabetes mellitus db/db mice; particularly polydipsia.
Rosiglitazone is an anti-diabetic drug in the thiazolinedione class, and was used as the positive control for SCE in the present study. Rosiglitazone works as an insulin sensitizer by binding to the Peroxisome proliferator-activated receptor receptors in fat cells and making the cells more responsive to insulin [19]. That is, it increases insulin sensitivity and improves glycemic control in type 2 diabetes. However, this compound induces adipogenesis in cell culture systems [20] and raises weight gain in rodents and humans [5]. In addition, it has several side effects, such as headaches, hypoglycemia, edema, hypertension, and liver toxicity [21].
Hyperglycemia is a crucial factor in the onset of type 2 diabetes and the complications associated with the disease [22]. Thus, the effective control of hyperglycemia is key for preventing diabetic complications and improving the quality of life in patients with type 2 diabetes [23]. Hyperglycemia is an independent risk factor for vascular complication disease, and a therapeutic medication may be required in order to reach hyperglycemic control targets in patients who have type 2 diabetes [24]. Fasting blood glucose concentration in the control of diabetes mellitus db/db mice increased steeply, but the concentration in the SCE-supplemented db/db mice increased gradually up to the second week of the experimental diet. Also, rosiglitazone supplementation slowly decreased the fasting blood glucose concentration over a 6-week period. It is well known that rosiglitazone supplement improves glycemic control in db/db mice [20]. The SCE supplement in the db/db mice significantly alleviated rising blood glucose levels compared to the control of diabetes mellitus db/db mice over the entire experimental period. In addition, the SCE supplement in the db/db mice significantly lowered the glycated hemoglobin concentrations compared to the control of diabetes mellitus db/db mice. Glycated hemoglobin is primarily measured to identify average blood glucose concentrations over prolonged periods of time. This serves as a marker for average blood glucose concentrations over the previous months and is useful for monitoring glycemic control in patients with type 2 diabetes [25]. The findings in this study suggest that the SCE supplement improved blood glucose concentration in type 2 diabetes mellitus mice.
In general, db/db mice exhibit an initial phase of hyperinsulinemia and progressively develop insulinopenia with age, a feature that is commonly observed in the late stages of type 2 diabetes [26]. The results of this study showed that the plasma insulin level in the control of diabetes mellitus db/db mice was higher than those in the SCE- and rosiglitazone-supplemented db/db mice, indicating that hyperinsulinemia was still expressed in the control of diabetes mellitus db/db mice. It has been reported that rosiglitazone improves the actions of insulin, thereby ameliorating glucose tolerance and lowering hyperinsulinemia in animals and humans with type 2 diabetes [27].
The homeostatic index of insulin resistance and the quantitative insulin sensitivity check index are simple indexes of insulin resistance. These were calculated using insulin and fasting glucose levels. The homeostatic index of insulin resistance is used as a biomarker of insulin resistance; values should increase with increasing insulin resistance. It is a useful index of insulin resistance [28]. Even though the homeostatic index of insulin resistance has several limitations in terms of accuracy and reliability [12], it essentially expresses insulin resistance [29]. The quantitative insulin sensitivity check index is an index of insulin sensitivity; values should decrease with increasing insulin resistance. In this study, the blood glucose level, plasma insulin level, and homeostatic index of insulin resistance were significantly lower in the SCE-supplemented db/db mice than in the control of diabetes mellitus db/db mice.
The intraperitoneal glucose tolerance test was performed after supplementing SCE in db/db mice for 6 weeks. Twelve-hour-fasted mice received an intraperitoneal injection of glucose, and blood samples in the control of diabetes mellitus, rosiglitazone-supplemented, and SCE-supplemented db/db mice were obtained for glucose measurement at 0, 30, 60, and 120 min. The rosiglitazone-supplemented db/db mice results indicated a near recovery of blood glucose levels at 120 min after glucose loading when expressed as actual values. SCE also improved the glucose-handling ability of db/db mice by lowering blood glucose level at 120 min, whereas glucose tolerance in the control of diabetes mellitus db/db mice became impaired. Thus, the SCE- and rosiglitazone-supplemented db/db mice ameliorated their glucose tolerance when the data were presented as actual blood glucose levels in the intraperitoneal glucose tolerance test. Subjects with impaired glucose tolerance generally have a heightened risk of macrovascular disease [30,31,32]. The diagnosis of impaired glucose tolerance has important prognostic implications for cardiovascular disease risk factors with respect to detecting hypertension, dyslipidemia, and central obesity [33].
Abnormal hepatic glucose metabolism is a major symptom of type 2 diabetes, and it contributes to postprandial hyperglycemia [34]. Elevated hepatic glucose production is critical for the occurrence of fasting and postprandial hyperglycemia [35]. While the level of plasma insulin in the db/db mice was high, hepatic glucose production was elevated, indicating a relative insensitivity of the liver to insulin [36]. Hepatic glucokinase plays a major role in controlling blood glucose homeostasis and its activity is low in type 2 diabetes [37]. Glucose-6-phosphatase is a key enzyme controlling hepatic gluconeogenesis and glucose output in the liver, and is normally suppressed by the actions of insulin [38]. Due to their strategic positions in hepatic glucose metabolism, both glucokinase and glucose-6-phophatase are the target enzymes regulating hepatic glucose production [39]. In this study, hepatic glucokinase activity was significantly higher in the SCE-supplemented db/db mice than in the control of diabetes mellitus db/db mice. Furthermore, hepatic glucose-6-phosphatase activity was significantly lower in the SCE-supplemented db/db mice than in the control of diabetes mellitus db/db mice, thereby decreasing hepatic gluconeogenesis. The SCE supplement in db/db mice also lowered the activity of hepatic phosphoenolpyruvate carboxykinase compared with the control of diabetes mellitus db/db mice. Thus, the hypoglycemic effects of the SCE supplement may be partly controlled through enhanced glucokinase activity and suppressed glucose-6-phosphatase and phosphoenolpyruvate carboxykinase activity in the liver of db/db mice.
Both lipolysis and circulating free fatty acids increase in an insulin resistance condition [19,40]. Also, elevated plasma free fatty acid levels account for up to 50% of insulin resistance in obese patients with type 2 diabetes [41]. In the present study, the SCE supplement significantly lowered the plasma free fatty acid, triglyceride, total cholesterol, and LDL-cholesterol levels compared to the control of diabetes mellitus db/db mice. A few studies have reported that free fatty acid and LDL-cholesterol levels were significantly reduced by supplementation with natural products containing polyphenol in type 2 diabetes mellitus animals [42,43,44]. In this study, the results also indicate that SCE supplementation enhances the ameliorating effect of insulin resistance by decreasing plasma lipid levels in db/db mice.
In conclusion, we investigated the anti-diabetic effect of SCE on blood glucose concentration and insulin resistance in male C57BL/KsJ-db/db mice. Fasting blood glucose level, glycated hemoglobin concentration, and insulin resistance were ameliorated in the SCE-supplemented db/db mice compared to those in the control of diabetes mellitus db/db mice. Furthermore, SCE supplementation elevated the activity of glucokinase, while the activities of glucose-6-phosphatase and phosphoenolpyruvate carboxykinase were significantly reduced in the SCE-supplemented db/db mice compared to the control of diabetes mellitus db/db mice. The plasma lipid level was also improved in the SCE-supplemented db/db mice compared to the control of diabetes mellitus db/db mice. These results suggest that SCE diet supplementation lowers the blood glucose concentration and improves insulin resistance. Thus, it seems likely that SCE, the extract from Sargassum coreanum, is a potential antidiabetic resource that will be helpful for the alleviating the symptoms of type 2 diabetes.

 XML Download