

 PDF
PDF ePub
ePub Citation
 Print
Print


INTRODUCTION
Adolescence is a transitional stage from childhood to adulthood characterized by dramatic physical, emotional, and intellectual developments as well as increased intake of various nutrients. As optimal development and growth have high nutritional requirements, a well-balanced and healthy diet is essential [12]. However, food consumption analyses have shown that intake of rice and fresh foods such as vegetables and fruits has dropped in Korean youths, whereas intake of processed and convenience foods as well as eating-out have increased [3]. A previous study showed that an irregular eating schedule combined with inappropriate food selection reduces intake of fiber and micronutrients such as iron, calcium, zinc, folic acid, and vitamins in youths [4567]. In particular, the result of the 2007 (IV-1) KNHANES (Korea National Health and Nutrition Examination Survey) revealed that intake of vegetables comprised only 18% of the entire diet in young Koreans [58].
Vegetables and fruits contain micronutrients such as vitamins and minerals as well as phytochemicals, which help to relieve stress and prevent cancer, obesity, and cardiovascular disease [159101112]. Moreover, the American Institute for Cancer Research endorses the '5 a Day for Better Health' program, which promotes eating five or more servings of vegetables and fruits daily (more than 80 g per serving for a total of 400 g) [131415]. The nutritional section of the third national health promotion plan (2011-2020) administered by the Korean government proposes to increase the population that consumes more than 500 g of fruits and vegetables daily and emphasizes the importance of vegetable and fruit intake [16].
Studies have shown that consumption of vegetables and fruits is crucial in the growth of adolescents and can prevent stress related to the university entrance period or chronic diseases in adulthood [41718]. Thus, this study examined intake of vegetables and fruits among Korean youths using data from the Korea Youth Risk Behavior Web-based Survey (2006, 2011), which represents the total youth population of Korea. Socio-demographic factors affecting vegetable and fruit intake were identified in order to develop basic guidelines on dietary education.
SUBJECTS AND METHODS
This study analyzed raw data from the KYRBWS (Korea Youth Risk Behavior Web-based Survey) conducted by the Korea Centers for Disease Control and Prevention in 2006 and 2011. The total number of subjects used in the study was 147,047 (2006: 71,404, 2011: 75,643).
Vegetable and fruit intake
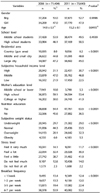
This study used frequency of vegetable consumption (F_veg, excluding kimchi) and frequency of fruit consumption (F_fruit, excluding fruit juice) as variables for analyzing consumption of vegetables and fruits. As the items for surveying food consumption frequency were different between the surveys in 2006 and 2011, this study first examined the distribution chart (Table 1). The percentages of those who consumed vegetables three times a day were 16.5% in 2006 and 17.9% in 2011. The percentages of those who consumed fruits three times a day were also below 4% in both years. As this distribution was considered inadequate to analyze vegetable and fruit consumption based on three times a day, this study reclassified '1-3 times of food consumption per day' into 'Once or more a day (≥ 1/day)' as in the study of Heo et al. [19]. From the 2006 survey, 'Once in 6-7 days', 'Once in 4-5 days', 'Once in 2-3 days', and 'Not consumed at all in the past week' were re-coded into 'Less than once a day (< 1/day).' From the 2011 survey, '1-2 times a week', '3-4 times a week', '5-6 times a week', and 'no intake in the past week' were all re-coded into 'Less than once a day (< 1/day)' variable [19].
General characteristics, meal, health, and other variables
Variables used as general characteristics of the subjects were gender, school level, residential area, subjective economic level/standard of living, and mother's education level. The residential area was divided into 'country (Gun area)', 'small and middle city', and 'large city'. The subjective economic level/standard of living was divided into 'low income', 'middle income', and 'high income' levels. Mother's education level was re-coded into 'middle school or lower', 'high school', and 'college or higher'. The meal variable used was frequency of breakfast (Variable name: F_BR). From the 2006 survey results, 'no breakfast in the past 7 days' was recoded into 'less than once a week (< 1/week)' and the remaining variables, i.e. '1-2 days a week', '3-5 days a week', and '6-7 days a week', were used from the survey. From the 2011 survey results, '0 day' was re-coded into 'less than once a week (< 1/week)'; '1 day' and '2 days' into '1-2 days a week'; '3 days', '4 days', and '5 days' into '3-5 days a week'; and '6 days' and '7 days' into '6-7 days a week'. Thus, recoding was performed the same as the categories used in the 2006 survey. Moreover, health-related and other variables included the presence or absence of nutrition education as well as subjective weight status. The presence or absence of nutrition education was divided into 'yes' for those who received education and 'no' for those who received no education. For measurement of stress level, questions used in preparing the raw data were used (Variable name: M_str, 1. feel it very much, 2. feel a lot, 3. feel a little, 4. do not feel much, 5. do not feel at all). Subjective weight status used for the analysis was divided into 'underweight', 'average', 'overweight', and 'obesity'.
Data analysis
Multistage stratified cluster sampling method was used for the KYRBWS (Korea Youth Risk Behavior Web-based Survey) in which clustering, stratification, weight, and finite population correction (FPC) were taken into account for the collected data. Thus, SUDAAN (Survey Data Analysis) Ver. 10.01 was used so that clustering, stratification, and weight were applicable for the total adolescent population of Korea using the obtained sample. The general characteristics of the subjects as well as the frequencies of vegetable and fruit intake were examined using frequency analysis and expressed as frequency (n) and percentage (weighted %), after which chi-square (χ2-test) was used to determine significance. The age was expressed as mean and standard error, after which t-test was used to determine significance. To identify factors affecting vegetable and fruit intake, logistic regression analysis was conducted separately on the data from 2006 and 2011 using the frequencies of vegetable and fruit intake as the dependent variables, which were recoded into 'more than once a day intake' as 1 point and 'less than once a day intake' as 0 points. The general characteristics of the subjects, their diet, and health-related factors were used as independent variables.
RESULTS
General characteristics of the subjects
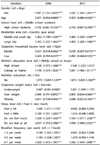
The general characteristics of the subjects were gender, school level, average age, residential area, subjective economic level/standard of living, mother's education level, nutrition education, subjective weight status, and eating or not eating breakfast (Table 2). Although there was no significant difference in gender, there were slightly more boys (around 53%) represented in the data from both 2006 and 2011. Regarding school level, the most numerous group was middle school students, which constituted greater than 50% of the 2006 data. The average age in 2006 was 14.9, whereas that in 2011 was 15.2. On the other hand, more high school students (50.5%) than middle school students (49.5%) were observed in the 2011 data. Regarding residential area, the survey participants from the Gun (country) area constituted less than 10% in both survey years. The percentages of participants from small and middle cities were lower than that from large cities in 2006 but higher in 2011 (P < 0.0001). Regarding subjective economic level/standard of living, high income level was around 30% in both years, middle income level was around 47%, and low income level was between 20-25% (P <0.0001). Regarding mother's education level, high school was the most common (more than 50%) in both years (P < 0.0001). Regarding the presence or absence of nutrition education, the percentages of participants who received education were higher than 50% in both 2006 and 2011, and this percentage was approximately 10% higher in 2011 (63.5%) than in 2006 (54.4%). In terms of stress level, both in 2006 and 2011, groups that identified their stress levels as 'feel it a little, (38.7% in 2006 and 41.9% in 2011) and 'feel it a lot' (32.4% in 2006 and 30.3% in 2011) constituted the highest proportions at above 30%. Regarding subjective weight status, the percentage of the normal group was 44.3% in 2006 but dropped by about 11% to 33.5% in 2011, whereas that of the overweight group was 20.1% in 2006 and then increased by approximately 12% to 32.3% in 2011 (P < 0.0001). Regarding consumption frequency of breakfast, about 53% of respondents answered that they ate breakfast six to seven times a week in both study years while the rate of respondents that answered eating breakfast three to five times a week increased 3% from 19.4% in 2006 to 22.4% in 2011.
Frequencies of vegetable and fruit intake based on general characteristics, diet, and health-related factors
Vegetable intake frequency
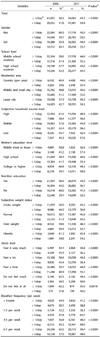
The analysis of vegetable intake frequency based on general characteristics, diet, and health-related factors are shown in Table 3. Overall, the frequency of eating vegetable side dishes 'more than once a day' dropped significantly from 58.2% in 2006 to 45.2% in 2011 (P < 0.0001). Significance determined based on specific factors, including gender, school level, residential area, subjective economic level/standard of living, mother's education level, presence or absence of nutrition education, stress level, subjective weight status, and frequency of breakfast intake, indicated that the frequency of vegetable intake 'more than once a day' was reduced significantly in 2011 compared to 2006 (P < 0.0001).
Fruit intake frequency
Table 4 shows the analysis of fruit intake frequency based on general characteristics, diet, and health-related factors. Overall, intake of fruits 'less than once a day' was higher than 65% in both years, whereas 'more than once a day' intake was 32.3% in 2006 but dropped significantly to 20.3% in 2011 (P < 0.0001). Regarding specific factors, including gender, school level, residential area, subjective economic level/standard of living, mother's education level, presence or absence of nutrition education, stress level, subjective weight status, and frequency of breakfast intake, the frequency of fruit intake 'more than once a day' was significantly lower in 2011 compared to 2006 (P < 0.0001).
Vegetable and fruit intake-related factors in youths
To examine factors related to vegetable and fruit intake in youths, logistic regression analysis was conducted on intake of vegetables and fruits 'more than once a day' as dependent variables along with general characteristics, diet, and health-related factors as independent variables according to each year.
Vegetable intake-related factors
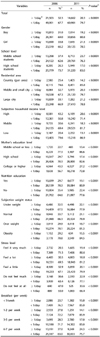
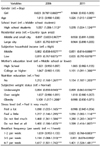
Table 5 shows the analysis of vegetable intake-related factors in youths. From the 2006 survey, all factors related to vegetable intake 'more than once a day', excluding mother's education level, showed significant effects. The frequency of vegetable intake 'more than once a day' was 17.7% (OR = 0.823) lower in female youths than male youths, whereas it was about 1.1 times (OR = 1.057) higher in high school students than middle school students. Regarding residential area, frequencies of vegetable intake 'more than once a day' were lower in students residing in small and middle city (10.3%, OR = 0.897) as well as large city (14.9%, OR = 0.851) compared to those living in Gun (country) areas. Regarding subjective economic level/standard of living, frequencies of vegetable intake 'more than once a day' were 11.8% lower at the middle income level (OR = 0.882) and 18.1% lower at the low income level (OR = 0.819) compared to the high income level. Regarding vegetable intake based on the presence or absence of nutrition education, frequency of vegetable intake 'more than once a day' was 1.2 times (OR = 1.212) higher in participants who received no education compared to those who received education. In terms of stress level, the group receiving no stress showed a higher frequency of vegetable intake 'more than once a day' compared to the group under severe stress. Correlation between subjective weight status and vegetable intake showed that the frequency of vegetable intake 'more than once a day' was 10.6% (OR = 0.894) lower in the underweight awareness group and 1.1 times (OR = 1.109) higher in the obese awareness group compared to the normal awareness group. Finally, as the frequency of eating breakfast increased, the frequency of vegetable intake 'more than once a day' also increased compared to eating breakfast 'less than once a week'. The frequency of vegetable intake 'more than once a day' was 1.2 times (OR = 1.194) higher than those who ate breakfast '3-5 times a week' and 1.6 times (OR = 1.617) higher than those who ate breakfast '6-7 times a week'.
Analysis of factors related to vegetable intake 'more than once a day' from the 2011 survey showed that all factors were significantly correlated, excluding gender and residential area. As age increased by 1 year, intake of vegetables 'more than once a day' also increased as much as 1.03 times (OR = 1.026). The frequency of vegetable intake 'more than once a day' was 1.1 times (OR = 1.078) higher in high school students compared to middle school students. Regarding subjective economic level/standard of living, frequency of vegetable intake 'more than once a day' was 14.9% (OR = 0.851) lower at the middle income level and 16.5% (OR = 0.835) lower at the low income level compared to the high income level. Based on mother's education level, frequency of vegetable intake 'more than once a day' was 1.2 times (OR = 1.191) higher in the college group compared to the middle school or lower education group. The frequency of vegetable intake 'more than once a day' was 1.2 times (OR = 1.151) higher in the group that received no education compared to those who received education. In terms of stress level, as in 2006, the group receiving no stress showed a higher frequency of vegetable intake 'more than once a day' compared to the group under severe stress. Regarding subjective weight status, the frequency of vegetable intake 'more than once a day' was 10.1% (OR = 0.899) lower in the underweight awareness group compared to the normal awareness group. Regarding frequency of eating breakfast, unlike the results of the 2006 survey, the frequency of vegetable intake 'more than once a day' was 17.7% (OR = 0.823) lower in the '1-2 times a week' group and 6.9% (OR = 0.931) lower in the '3-5 times a week' group compared to the 'less than once a week' group. On the other hand, the frequency of vegetable intake 'more than once a day' was 1.4 times (OR = 1.401) higher in the '6-7 times a week' group compared to the 'less than one time' group.
Fruit intake-related factors
Table 6 shows the analysis of fruit intake-related factors in youths. From the 2006 survey, the frequency of fruit intake 'more than once a day' showed a significant correlation with all factors. Unlike vegetable intake, the frequency of fruit intake 'more than once a day' was 1.2 times (OR = 1.197) higher in girls than in boys as well as 29.5% (OR = 0.705) lower in high school students than in middle school students. As age number increased by 1 year, fruit intake 'more than once a day' decreased by 12.9%. Frequencies of fruit intake 'more than once a day' were about 1.3 times higher in small and middle cities (OR = 1.302) as well as large cities (OR = 1.342) compared to those in the Gun (country) area. Regarding differences according to subjective economic level/standard of living, the frequency of fruit intake 'more than once a day' was 34.9% (OR = 0.651) lower in youths at the middle income level and 57.6% (OR = 0.424) lower in those at the low income level compared to those at the high income level. Regarding the mother's education level, the frequency of fruit intake 'more than once a day' was 1.2 times (OR = 1.168) higher in youths whose mothers had a high school education as well as 1.7 times (OR = 1.740) higher in youths whose mothers had a college or higher compared to those whose mothers had a middle school or lower. The frequency of fruit intake 'more than once a day' in youths was 1.1 times (OR = 1.072) higher in those who received no education compared to those who received nutrition education. In terms of stress level, the group under severe stress showed a higher frequency of fruit intake 'more than once a day' compared to the group under no stress. Regarding subjective weight status, the frequency of fruit intake 'more than once a day' was 5.3% (OR = 0.947) lower in the underweight awareness group, 16% (OR = 0.840) lower in the overweight awareness group, and 18.9% (OR = 0.811) lower in the obese awareness group compared to youths in the normal awareness group. Regarding frequency of eating breakfast, the frequency of fruit intake 'more than once a day' was 1.1 times (OR = 1.149) higher in the group who ate breakfast '1-2 times a week', 1.2 times (OR = 1.150) higher in the group who ate breakfast '3-5 times a week', and 1.6 times (OR = 1.620) higher in the group who ate breakfast '6-7 times a week' compared to the group who ate breakfast 'less than once a week'.
From the 2011 survey, analysis of factors related to fruit intake 'more than once a day' in youths showed similar results as the 2006 survey. All factors were significantly correlated. As age increased by 1 year, fruit intake 'more than once a day' decreased by 9.7%. The frequency of fruit intake 'more than once a day' was 1.2 times (OR = 1.227) higher in female students compared to male students as well as 25.8% (OR = 0.742) lower in high school students compared to middle school students. According to subjective economic level/standard of living, the frequency of fruit intake 'more than once a day' in youths was 36.1% (OR = 0.639) lower in those at the middle income level and 51.8% (OR = 0.492) lower in those at the low income level compared to those at the high income level. According to mother's education level, the frequency of fruit intake 'more than once a day' was 1.2 times (OR = 1.168) higher in those whose mothers had a high school education and 1.7 times (OR = 1.691) higher in those whose mothers had a college education or higher compared to those whose mothers had a middle school education or lower. The frequency of fruit intake 'more than once a day' in youths was 1.1 times (OR = 1.073) higher in the group that did not receive nutrition education compared to the group that received nutrition education. In terms of stress level, as in 2006, the group under no stress showed a higher frequency of fruit intake 'more than once a day' compared to the group under severe stress. According to subjective weight status, the frequency of fruit intake 'more than once a day' was 1.1 times (OR = 1.061) higher in the underweight awareness group, 13.5% (OR = 0.865) lower in the overweight awareness group, and 31.2% (OR = 0.688) lower in the obese awareness group compared to the normal awareness group. Finally, frequency of fruit intake 'more than once a day' according to frequency of eating breakfast was 1.6 times (OR = 1.565) higher in those who ate breakfast '6-7 times a week' compared to those who ate breakfast 'less than once a week'.
DISCUSSION
This study compared and analyzed consumption frequencies of vegetables and fruits, general characteristics, diet, and health-related factors in 147,047 youths who participated in the KYRBWS (Korea Youth Risk Behavior Web-based Survey) in 2006 and 2011. When frequencies of vegetable and fruit intake according to general characteristics, diet, and health-related factors were analyzed, all survey participants, gender, school level, residential area, subjective economic level/standard of living, mother's education level, presence or absence of nutrition education, subjective weight status, and frequency of breakfast intake, the frequencies were significantly reduced in 2011 compared to 2006. Reductions in consumption frequencies of vegetables and fruits corroborate the results of a previous study by Lee et al. [3] on food consumption in Korean youths, which found that consumption of fresh foods, including vegetables, fish and seafood, and fruits, decreased while consumption of processed and convenience foods as well as eating out increased in Korean youths. Furthermore, according to the 2007 KNHANES (Korea National Health and Nutrition Examination Survey), which was conducted within a similar time frame as the above study, the average daily vegetable intake of the 12-18 year age group was 222.7 g but decreased by 14.7 g over the past 4 years [20]. According to the 2011 KNHANES, the average daily vegetable intake was 207.4 g in the 10-18 year age group [21]. Regarding fruit intake, the 2007 KNHANES data showed that the average fruit daily intake was 138.4 g but decreased by approximately 4 g to 135.5 g in 2011 [82021]. Based on results of previous studies, the reduced intake of vegetables and fruits did not directly affect reduction of intake frequency, whereas reduction of intake amount was somewhat correlated with reduction of intake frequency.
Among previous studies that have examined the importance of adequate intake of vegetables and fruits, a report from Europe demonstrated a close correlation between cancer prevention and vegetable or fruit intake as well as a negative correlation between sufficient vegetable and fruit intake, inflammatory index, and oxidative stress in youths between 13-17 years of age [2223]. In another study, sufficient vegetable and fruit intake was shown to boost resistance against diseases and prevent obesity. Furthermore, it was reported that adequate vegetable and fruit intake plays a vital role in boosting perseverance and emotional stability as well as relieving various forms of stress [1912]. Particularly in Korean youths, increased intake of high-fat and high-sugar snacks resulting from emotional instability due to stress from the university entrance period, lack of sleep, an unbalanced diet, and irregular eating was shown to increase health problems, including increased incidence of obesity and various diseases [41724]. Increased vegetable and fruit intake in youths will resolve not only health problems caused by a bad diet but also problems caused by stress. Moreover, more than 500 g of daily intake of vegetables and fruits is recommended for nutrition management, prevention of chronic diseases, and promotion of a balanced diet in Koreans [16]. However, as mentioned earlier, in the 2011 KNHANES, average daily vegetable and fruit intake was 342.9 g (vegetables: 207.4 g, fruits: 135.5 g) in youths between 10-18 years of age, which lags behind the recommended amount of 500 g likely due to snack intake as explained in a previous study [21]. Based on the above results, menus favorable to adolescents containing vegetables and fruits need to be developed to increase intake of vegetables and fruits.
To identify factors affecting vegetable and fruit intake, logistic regression analysis was conducted separately on the data from 2006 and 2011 based on consumption frequencies of vegetables and fruits as the dependent variables. The general characteristics, diets, and health-related factors of the subjects were used as the independent variables. For vegetable and fruit intake-related factors from the 2006 and 2011 survey data, as the subjective economic level/standard of living decreased, intakes were reduced in the group that received nutrition education compared to the group that did not. On the other hand, vegetable and fruit intake increased with higher frequency of eating breakfast as well as mother's education level. Environmental factors, including household socioeconomic level, education level of subject's parents, and family structure, along with individual factors such as gender and age are known to affect diet in youths [2526272829]. Furthermore, as income and education levels increase in adult women, consumption frequencies of vegetables and fruits increase [30313233]. Another study on vegetable and fruit intake in adults over 30 years of age showed that the ratio of subjects meeting daily intake volumes (more than 400 g) recommended by the World Cancer Research Fund (WCRF) increases as education and household income levels increase [14]. Thus, mother's education level and household income level both affect vegetable and fruit intake in Korean youths. Accordingly, national policies need to be developed to improve nutrition in low-income youths through school foodservice.
Regarding the presence or absence of nutrition education, a study by Lee & Kim [34] found that nutrition education has a positive effect on vegetable intake when offered to elementary school students; however, the results of this study showed a decrease in vegetable intake. This discrepancy is due to the fact that the study by Lee & Kim evaluated changes in vegetable intake after offering education in a selected some group of subjects, whereas the data in this study were from the KYRBWS, which simply surveyed subjects on nutrition education items.
Overall, the frequency of vegetable and fruit intake in subjects was lower in 2011 compared to 2006. Therefore, policies to increase intake of vegetables and fruits should be developed. Particularly, sufficient vegetable and fruit intake would help relieve various forms of stress in youths, and anti-oxidative nutrients from various vitamins and minerals would protect cells from oxidative damage [149171824]. Furthermore, a previous study showed that as vegetable and fruit intake increases, risk of cardiovascular disease decreases [12]. Another study by the European Prospective Investigation into Cancer and Nutrition (EPIC) reported that diabetics with high intake of vegetables and fruits show lower mortality caused by cardiovascular disease [1435]. Thus, we believe that vegetable and fruit intake needs to be increased.
As this study is a survey using items surveying the frequency of vegetable and fruit consumption in the KYRBWS, it could not estimate the actual amount of vegetable and fruit consumption. However, intake frequencies were reduced in 2011 compared to those in 2006. Thus, future research needs to improve dietary guidelines for nutrition education that may lead students to recognize the importance of food consumption and the necessity of increasing daily serving size of vegetables and fruits.

 XML Download