

 PDF
PDF ePub
ePub Citation
 Print
Print


INTRODUCTION
Determination of an athlete's energy expenditure can help improve performance by allowing for individualized dietary recommendations in order to reach an optimal nutritional status. Currently, many athletes desire to alter their body composition by practicing chronic energy restriction in order to enhance their physical performance. This may change their body's energy needs. Thus, an accurate estimate of a person's total daily energy expenditure is very important. To determine the energy requirements of an individual, knowledge of their physical activity and resting metabolic rate (RMR) is needed. While energy expenditure for physical activity is the most important factor among the total daily energy expenditure [1], the RMR is the largest component, contributing 60-70% of the total daily energy expenditure. One method commonly used to estimate a subject's total daily energy expenditure is determining the resting metabolic rate and then multiplying the RMR by an appropriate physical activity level (PAL). As a result, RMR measurement becomes paramount when determining the total daily energy expenditure of athletes [2].
Indirect calorimetry, which involves measuring oxygen consumption and carbon dioxide production, is the most commonly used method for evaluation of RMR. Unfortunately, factors such as high equipment cost, need for a trained clinician, and measurement time (45 to 60 minutes) often make the use of indirect calorimetry impractical. As a result, several equations for prediction of RMR have been developed based on normal subjects using variables such as weight, height, gender, and age. However, there is no standard prediction equation that fits all individuals, and the characteristics of a population should be considered [34]. One important individual characteristic affecting energy expenditure is fat-free mass, which accounts for about 50-80% of an individual's variability in RMR [25]. However, RMR in individuals with the same fat-free mass may vary by approximately 3 MJ/day (approximately 715 kcal/24 h), which suggests that additional components substantially influence the RMR [6]. For example, Illner and colleagues reported that metabolically active organs contribute significantly to the RMR [7]. In addition, the RMR might be influenced by exercise-induced activation of the sympathetic nervous system [8]. Thus, besides chronic, exercise-induced changes in body composition, the RMR might be modulated by regular physical activity itself [2].
Currently, the prediction equations developed by Cunningham and Harris-Benedict are recommended by the American College of Sports Medicine (ACSM) for estimation of the RMR in athletes [91011]. Cunningham's prediction model incorporates the fat-free mass; thus, differences in body composition between athletes and non-athletes are considered. In contrast, the prediction equations by Harris-Benedict do not include fat-free mass, but instead include total body weight and gender. As shown by Thompson and Manore [3], the Cunningham equation is highly accurate for endurance athletes. However, anthropometric data such as height, weight, and fat-free mass may differ considerably in elite athletes, depending on the kind of sports, affecting the applicability of commonly used RMR prediction equations [12]. For example, elite heavyweight rowers have been shown to have a significantly larger total body mass and fat-free mass compared to non-athletes [13]. Cunningham's equation was not developed for an athletic population, but rather for healthy untrained adult subjects. In addition, Harris-Benedict's and Cunningham's formulas were developed in 1918 and 1980, respectively [914]. Over the years, many prediction equations have become available, some of which might be regarded as more appropriate. For example, de Lorenzo and colleagues [15] established an RMR prediction equation for male athletes. Nevertheless, ACSM recommends the Harris-Benedict or Cunningham equation, although they have not been developed for the athletic population and the accuracy of RMR prediction models has not been validated specifically for athletic populations with a very high fat-free mass. Thus the applicability of both the Cunningham equation and the Harris-Benedict equation in athletes with a very high fat-free mass remains questionable.
Research concerning the accuracy of these RMR predictive equations in athletes is insufficient [16]. Thompson and Manore reported that traditionally used clinical equations for estimation of metabolic rates do not apply well to about 50% of athletes [3]. Therefore, measuring the RMR and comparing the values with those calculated using predictive equations will be helpful in determining clinical relevance and applicability to athletic patients. The purposes of this study were to assess the accuracy of predictive equations on a group of athletes and non-athletes and to develop prediction equations for athletes.
SUBJECTS AND METHOD
Subjects
Subjects enrolled in the study included 100 athletic and non-athletic high school students in Gangneung City, a rural area of South Korea. Fifty soccer players (30 males and 20 females) and 50 non-athletic subjects (30 males and 20 females) participated in this study. All subjects exercised regularly for at least three hours per day and six days per week except during holidays as part of their routine boardinghouse lifestyle and have an average athletic career greater than 5 years. The average exercise time per day of the non-athletes was only 30 minutes, as they were taking part in didactics and after-school studying for an average of 9 hours per day. All subjects who participated in this study were healthy students with no known preexisting disease. None of the subjects had a history of current illnesses, recent weight loss, pharmacologic therapy, or hormonal treatment. All subjects provided informed consent, and this study was approved by the Institutional Review Board of Gangneung-Wonju National University(GWNUIRB-2012-13).
Body composition
Anthropometric measurements were performed by the same investigator and included body weight, body height, mid-arm circumference, triceps skinfold thickness, and body composition assessment. Briefly, weight and height were measured using a digital scale and stadiometer (Inbody720, Biospace Corp., Korea). Body weight was measured without shoes and in light clothing on a standing scale calibrated to the nearest 0.1 kg. Body height was measured without shoes on a wall-mounted stadiometer calibrated to the nearest 0.1 cm. Triceps skinfold thickness (TSF) measurements were performed in triplicate on the left arm using a skinfold caliper (Skindex system1, Caldwell Justiss & Co., Inc., USA). In addition, measurement of body composition was performed using bioelectrical impedance analysis (Inbody720, Biospace Corp. Korea) according to the manufacturer's instructions. Muscle mass was calculated using Heymsfield's formula and body surface area was calculated using the Dubois formula [45].
Resting metabolic rate
The testing laboratory was set-up in the respective schools of the subjects, in separate rooms that were temperature-controlled (25-27℃). Subjects arrived in the morning for testing following an overnight fast (minimum 9 hours). Before starting data collection, the procedure for the RMR measurement was explained to the subjects. Prior to testing, subjects were free-living and on an unrestricted diet. They were instructed to avoid strenuous exercise on the day before testing. In order to acclimate to the environment, they lay supine for at least 30 minutes. RMR was measured between 06 : 00 and 08 : 00 using a TrueOne 2400 metabolic cart (Model QMC, ParvoMedics Corp. UT, USA). After achieving steady state (typically 5-10 min), expired gases were collected for 30 minutes for calculation of RMR. Oxygen consumption and carbon dioxide production, standardized for temperature, barometric pressure, and humidity, were measured at 1 min intervals and averaged over the entire measurement period. The energy expenditure was calculated using the equation proposed by de Weir [6].
Predictive RMR equations
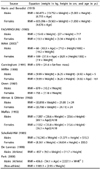
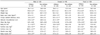
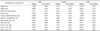
The predictive equations for RMR used in this study are summarized in Table 1. The inclusion criteria were as follows: equations based on weight and/or height of adolescent, or equations that are the most commonly used in clinical settings although based on adults. Among the available equations, Harris-Benedict and FAO/WHO/UNU are commonly used in prediction of RMR in healthy subjects [78]. Of note, the Mifflin et al., Owen et al., Altman and Dittmer, Maffeis et al., Schofield-HW, and the IMNA (Institute of Medicine of the National Academies) equations were developed specifically to improve the estimation of RMR in an overweight population [91011121317]. The FAO/WHO/UNU and Schofield equations were developed from predominantly normal-weight samples. The Harris-Benedict equation was also included because it was the most widely used of the earlier studies [14]. Cunningham equation based on measurement of fat-free mass as an independent variable was selected, along with De Lorenzo and Park's equations were developed for athletes [151819].
Statistical analyses
All result values are expressed as mean ± SD, unless otherwise stated. Data were analyzed using the Statistical Analysis System (version 9.2, SAS Institute Inc, Cary, NC). Student's t-tests were used for comparison of RMR and related variables between genders. Pearson's correlation coefficients (r) were calculated to evaluate the relationship of measured RMR with predicted RMR and anthropometric measurements. After calculating the mean difference between measured RMR and predicted RMR, and 95% limits of agreement as the mean difference in individuals (± 1.96 SD), Bland-Altman analyses were used to determine how precise the mean difference was both graphically and numerically [20]. Significant ANOVAs were followed by paired t-tests. Stepwise multiple regression analyses were used in development of a new prediction equation. The new prediction equations developed were also tested using the Bland-Altman method to determine the degrees of systematic and magnitude bias when the RMR predicted by the new equations was compared with the measured RMR. A value of P < 0.05 was defined as significant.
RESULTS
Subject characteristics
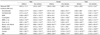
The characteristics of the subjects of this study are listed in Table 2. The mean age among males was 16.7 years (± 1.0) in athletes and 16.0 years (± 0.1) in non-athletes, while for females it was 16.4 years (± 1.1) and 17.5 years (± 0.4) for athletes and non-athletes, respectively. There was no significant difference in age, body weight, and muscle mass (kg) between the two groups. The TSF (triceps skinfold thickness) of athletes (13.9 ± 2.4 mm in males and 20.7 ± 5.1 mm in females) was significantly (P < 0.001) less than that of non-athletes (20.4 ± 5.5 mm in males and 28.3 ± 5.0 mm in females). The percentage of body fat of athletes (11.1 ± 2.2% in males and 12.6 ± 3.4% in females) was also significantly (P < 0.001) less than that of non-athletes (19.9 ± 7.2% in males and 20.2 ± 5.8% in females), but the percentages of body muscle in the athletes (35.0 ± 3.4% in males and 27.0 ± 2.5% in females) were significantly (P < 0.01) higher than those of non-athletes (31.1 ± 2.6% in males and 24.6 ± 3.8% in females). In addition, the fat-free mass of the male athletes (60.5 ± 4.5 kg) was also significantly higher than that of non-athletic (54.9 ± 8.1 kg) males, however, no significant difference between athletes and non-athletes was observed among females.
Measured RMR vs. predicted RMR
Measured and adjusted RMRs by body weight and fat-free mass obtained in the studied groups are detailed in Table 3. In males, significantly higher measured RMR was observed in athletes (1647.6 ± 111.3 kcal/day) than in non-athletes (1391.0 ± 84.4 kcal/day). However, measured RMR in female athletes did not differ significantly from that of female non-athletes. Adjusted RMR by body weight was significantly higher in male athletes than in male non-athletes, but adjusted RMR by fat-free mass was not significantly different between athletes and non-athletes both males and females.
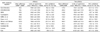
Measured and predicted RMR values obtained in the studied groups are detailed in Table 4. In male athletes, no significant difference was observed between measured and predicted RMR using either Cunningham's or Park's equations, however, in male non-athletes, predicted RMR using multiple equations overestimated values compared with the measured RMR, except for the formula developed by Owen and colleagues. In female athletes, predicted RMR using Owen's, Altman and Dittmer's, De Lorenzo's, and Park's equations showed significant difference compared to the measured RMR. In female non-athletes, except when using IMNA's equation, the predicted RMR using Mifflin's, Cunningham's, and Maffeis's equations were significantly higher than measured RMR.
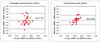
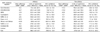
As seen in Table 5 and Table 6, results of the Bland-Altman analysis show that the 95% limits of agreement between measured RMR and predicted RMR using different equations were wide. Exploration using Bland-Altman analyses demonstrated that the predicted RMR typically deviated more profoundly in the lower and upper RMR measured ranges. Above all, the equations by Cunningham (-29.8 kcal/day, limits of agreement -318.7 and +259.1 kcal/day) and Park (-0.842 kcal/day, limits of agreement -198.9 and +196.9 kcal/day) demonstrated the smallest mean difference (measured RMR minus predicted RMR) with less deviation graphically, in the lower and upper measured RMR ranges in male athletes (Fig. 1).
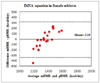
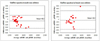
The mean difference and limits of agreement between measured and predicted RMRs using a selected equation in each group are detailed in Table 7. IMNA's equation showed the lowest mean difference (-2.19 kcal/day, limits of agreement -325.3 and +320.9 kcal/day) and, graphically, the best agreement in female athletes (Fig. 2). After Mifflin (22.6 kcal/day, limits of agreement -302.0 and +347.2 kcal/day), the better equation was Maffeis (44.3 kcal/day, limits of agreement -278.0 and +366.7 kcal/day) (Fig. 3), and the equation with the worst limits of agreement was that of Altman and Dittmer. Also, the best equation was Maffeis (-32.3 kcal/day, limits of agreement -383.6 and +318.9 kcal/day), and the worst was Altman and Dittmer's equation (-411.1 kcal/day, limits of agreement -859.9 and +37.8 kcal/day) for non-athletic females.
Group by group, using calorimetry comparisons, equations that obtained the lowest measured RMR minus predicted RMR difference were: Cunningham in male athletes, IMNA in female athletes, and Maffeis in non-athletes (males and females).
Relationship between measured RMR and predictive variables
Several easily obtainable anthropometric measurements showed significant association with measured RMR (Table 8). According to the Pearson correlation analysis, measured RMR showed positive correlation with fat-free mass (r = 0.684, P < 0.001), weight, body surface area, and muscle mass (r = 0.666, r = 0.654, and r = 0.652, P < 0.001, respectively) and showed negative correlation (r = -0.620, P < 0.001) with body fat (%) in athletes. However, in non-athletes, the degree of correlation between measured RMR and fat-free mass, body weight, and body surface area (r = 0.396, r = 0.379, and r = 0.377, respectively) was lower than that in athletes.
Development of new predictive formulas
Stepwise multiple-regression analysis including all variables shown in Table 2 yielded new prediction equations: Formula 1 and Formula 2 (Table 9). Formula 2, which included fat-free mass showed a higher correlation (R2 = 0.755, P < 0.05) than Formula 1 using body weight and VO2max. Use of Formula 2 resulted in improvement of both the mean difference (-1.6 kcal/day) and a reduction in the limits of agreement (-291.4 and +288.3 kcals/day).
DISCUSSION
The purposes of this study were to compare RMR and its related variables of athletes with those of non-athletes and to determine accurate and unbiased equations for estimating the RMR of athletes, and to possibly develop prediction equations specifically for athletes.
The anthropometry results of subjects showed that despite no significant weight differences measured between athletes and non-athletes, the percentage of the body fat in athletes was less than that of non-athletes, while their fat-free mass (%) and body muscle (%) were higher. The results of this study are in agreement with those of Gilliat-Wimberly et al., who stated that an active group has lower percentages of body fat and body mass index compared to a non-active group [21].
In Korea, studies measuring the resting metabolic rates of athletes are very rare. The mean RMR value for the male athletes in this study was 1647.6 kcal/day, which appears to be representative of other active males. The values for RMR of 1858 kcal/day, 1788 kcal/day, and 1808 kcal/day among active men have been previously reported [222324]. RMR values for active females have been reported as 1333 kcal/day, 1338 kcal/day, and 1328 kcal/day [252627]. The female athletes in this study had a mean RMR of 1364 kcal/day, slightly higher than those previously reported. The results of adjusted RMR by body weight in this study showed significant differences between athletes (24.3 kcal/kg weight) and non-athletes (20.7 kcal/kg weight) in males, but were not significantly different in the two groups of women. On the other hand, adjusted RMR by fat-free mass did not show a significant difference between athletes and non-athletes in both males and females.
Among the 11 prediction equations evaluated in this study, all formulas except for Cunningham's and Park's equations included body height, weight and age as variables [1819]. In this study, given that the body weight and age were not significantly different between athletes and non-athletes, predicted RMR using these variables did not produce any significant differences. On the other hand, predicted RMR of athletes (1530.2 ± 200.0 kcal/day) was higher than in non-athletes (1425.7 ± 217.6 kcal/day) when using Cunningham's formula [18]. This finding was due to the fact that the Cunningham's equation used fat-free mass which was significantly different between the two groups. The lower body fat and higher body muscle mass increased the predicted RMR in athletes because muscle requires more oxygen than fat tissue when it metabolizes [9]. Given this finding, since it appears that a person's fat-free mass is the most representative variable affecting the RMR, it is undesirable to estimate RMR for athletes using the prediction equation used for non-athletes or the general population, which tends to have lower fat-free mass compared with athletes [28]. Therefore, for prediction of the RMR of athletes, validation of the Cunningham equation was needed [15]. Unfortunately, studies on accuracy of prediction equations used in prediction of the RMR of athletes are very rare.
In this study, the predicted resting metabolic rates of the athletes using the Cunningham formula (1677.4 kcal/day in males and 1309.4 kcal/day in females) were similar to those of Thompson and Manore for an athlete's resting metabolic rate (1868 kcal/day in males and 1486 kcal/day in females) [318]. Jang and Lee calculated the basal metabolic rate (BMR) of male juniors (1184.6 kcal/day) using weight, while Lee and Lee reported BMR in young people (mean age of 16 years, 1732.5 kcal/day; mean age of 17 years and 1832.6 kcal/day) that was higher than that observed in this study [2930]. In addition, the resting metabolic rates of 10 soccer players (1834 kcal/day) were very similar to the results of this study [15]. However, their average weight (68.2 kg) and mean age (16.8 years) were similar to those of our study subjects, but with differences in lower training times (four times per week, one week training time from 90 to 120 minutes). Jang and Lee reported that a measured resting metabolic rate showed higher positive correlation with the fat-free mass than with height and body weight [29]. In this study, most equations for prediction of RMR focus on weight, height, or age. In addition, the average resting metabolic rates of 24 endurance athletes appeared to be approximately 1868 kcal/day, lower than that reported by De Lorenzo et al. for 51 athletes (1929 kcal/day) [315]. The reason for this discrepancy has been attributed to the different amounts of fat-free mass in both groups (respectively 63.4 kg and 67.0 kg).
The Harris-Benedict formula, which is probably the most widely used equation for estimating energy requirements, either underestimated or overestimated the RMR when applied to all subjects in this study. The Harris-Benedict equation was derived from indirect calorimetric studies of 239 normal subjects. This equation was developed on RMR measurements performed in the first half of the century. Firouzbakhsh and colleagues have discussed the potential applicability of the Harris-Benedict formula in pediatric groups whether for changes in life condition (i.e., different nutrition), changes in nutritional status (weight, height, and body composition) despite the fact that the database of the Harris-Benedict study was composed predominantly of adult subjects [31].
The FAO/WHO/UNU equation, the most appropriate formula for predicting resting metabolic rate, was calculated using a formula extracted from the data of more than 7,500 children and adolescents, including 3-18 year-old obese children [3233]. In addition, Rodriguez et al. reported that the FAO/WHO/UNU and Schofield equations were appropriate for predicting the RMR in children and adolescents [34]. However, the FAO/WHO/UNU formula more appropriately targets Western children and youth, and therefore is not suitable for Asians. Earlier studies also reported that the FAO/WHO/UNU formula overestimated the measured RMR [3035]. In order to avoid these critical errors, the FAO/WHO/UNU expert committee suggested the induction of a new formula to assess the energy requirements for various races and regions [33]. As a result, the FAO/WHO/UNU formula is not suitable for application to Korean adolescents.
Based on the results of this and other additional studies, most of the existing RMR prediction equations revealed no significant difference between predicted RMR and measured RMR [1531]. Different prediction equations should be applied to a general population given that each target group will have potentially differing data based on ethnicity, regional, climatic conditions, and nutritional status. Therefore, the use of indirect calorimetry is most desirable for assessment of an individual's RMR.
However, because the cost of indirect calorimetry is expensive and 30 to 40 minutes or more is required for measurement, indirect calorimetry is not easily available for many providers or situations. As a result, energy requirements have been estimated using prediction formulas in cases where indirect calorimetry cannot be used [31].
The results of our study suggest that the Cunningham and Park formulas are best suited for male athletic adolescent groups and the IMNA formula for male non-athletes. The Maffeis formula appears to most accurately represent the RMR among both athletic and non-athletic female adolescents groups. However, as observed in this study, predictive equations currently in use have several potential limitations for predicting RMR. Therefore, for the reasons noted above the application of these prediction formulas may not be very applicable to our adolescent population [1531].
We have identified appropriate RMR prediction formulas for adolescent athletes in Korea. Stepwise multiple regression analysis (multiple regression analysis) using the formula to predict the new resting metabolic rate was performed and the results are listed in Table 8. Among the new prediction formulas, Formula 2 (RMR = 730.4 + 15 × fat-free mass) showed the best correlation with the measured RMR for adolescent athletes. Predictive equations cannot completely replace the accuracy of direct RMR measurements. However, when resting metabolic rates are difficult for direct measurement of RMR, prediction formulas should be used to make estimations. An RMR prediction equation was developed in this study, specifically for exercise groups involving young people in Korea.
De Lorenzo et al. [15] developed an RMR prediction equation from 51 male athletes and the prediction equations of this study were derived from 50 athletes (male 30, female 20) and 50 non-athletes. Nevertheless a major limitation of our findings may be associated with our small number of subjects. In subsequent studies, more subjects and other age groups for crossvalidation are needed in order to fully evaluate and analyze the findings of this study.


 XML Download