

 PDF
PDF ePub
ePub Citation
 Print
Print


INTRODUCTION
In nutritional epidemiology and large-scale studies, taking measurements of height and weight is sometimes not possible since this involves higher costs of equipment and human resources and involves frequent respondent refusals [1,2]. A simpler procedure is to collect information regarding height and weight on the basis of a self-reported estimates [3,4,5,6,7]. The procedure may be especially convenient in elderly people due to numerous diseases and difficulties with taking measurements.
Many authors recommend the application of self-reported height and weight in adolescents and adults [3,8,9,10] as well as elderly people [8,9,10]. Payette et al. [11] suggest that self-reported estimates may be useful in detecting malnutrition in healthy, mentally disabled or elderly people suffering moderately from dementia. Self-reported height and weight estimates have been used in many international studies carried out among the elderly [1,3,8,9,10,12,13]. In Poland, research in this area in elderly people is still lacking. To the authors' knowledge, only one paper regarding the use of self-declared height and weight for Polish adolescents has been published [14].
The use of self-reported height and weight in nutritional epidemiology is not conclusive [1,9,15,16,17]. Some studies have found that height and weight reported by adults significantly differed from the measured values [9,12,15,16,17]. This caused incorrect assessment of respondents with normal weight as well as overweight or obese [2,4,12,18,19,20]. Reporting errors of weight were related to typical cultural patterns, according to which overweight or obese respondents declared having lower weights than they actually had [2,5,9,10,12,19,20,21]. Overweight women more frequently underestimated their weight [4,16, 12,22], whereas underweight men more frequently overestimated their weight [9]. Therefore, it was considered that self-reported weight should be carefully interpreted, particularly when reported by overweight and obese respondents [10,21]. Height was most often overestimated by shorter men [5], overweight or obese women [5,9,21] and elderly people [13]. The use of correction equations for adjusting self-reported estimates is one approach [2,23]. Such equations can be used to correct the reporting error of self-reported height and weight, and corrected estimates of BMI may then be calculated. Furthermore, some authors suggest that a simple correction equation for height and weight is the most useful in the prediction of corrected prevalence of overweight and obesity [2,13,24,25]. While such correction equations have been published for a number of different populations [2,5,13,26] there are no equations which are specific to elderly Poles.
The aim of the study was to compare self-reported and measured weights and heights and to evaluate the possibility of using self-reported estimates in the assessment of the nutritional status of elderly Poles. The hypothesis was that interview-based information may be applied in nutritional epidemiology regarding the height and weight obtained from elderly people, despite the differences between measured and self-reported estimates.
SUBJECTS AND METHODS
Ethics statement
The study was approved by the Bioethics Committee of the Regional Medical Chamber in Olsztyn, Poland, on June 27, 2001, Resolution No. 49/2001. All participants gave their written consent to take part in the study and the obtained information was confidential and used only for scientific purposes.
Study design and sample collection
The study was carried out as a part of project of Department of Human Nutrition, University of Warmia and Mazury, Poland (DHN) and the SENIOR FOOD QOL project. One of the goals of DHN project was validity study regarding self-reported estimates of height and weight in adolescent and elderly people. One of the goals of SENIOR FOOD QOL project was to determine eating habits of the older population in Europe in eight European countries (Denmark, Germany, Italy, Poland, Portugal, Spain, Sweden, United Kingdom). The sample recruitment was made according to design of SENIOR FOOD QOL project. Validity study was originally developed.
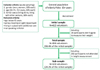
The recruitment details and study design are presented in Fig. 1. The recruitment was carried out in five selected regions of Poland, which were the most representative for the population of elderly Poles. The following provinces were chosen: Masovia, Podkarpackie, Silesia, Warmia-Masuria and Greater Poland. Selection criteria for the sample included: gender, age (65-74 or 75 + years) and family status (living alone and with other persons). The exclusion criteria were as follows: (i) age below 65 years, (ii) serious hearing and/or sight impairment to the degree making it impossible to carry out the interview, living in a place with additional care, which significantly limited or excluded the respondent's participation in food provision or meal preparation, or inability to use spoken Polish. During the recruitment, attempts were made to reach elderly persons of various levels of education, income, place of residence, etc. Thus, the study sample reflected the diversity of the national population and was well-fitted to the Polish representative sample. However, the social features listed above did not constitute inclusion or exclusion criteria.
Respondents were chosen using a quota sampling, assuming a sample size of 400 persons, with an equal share of (i) men and women, (ii) people aged 65-74 and 75 + years, (iii) people living in their own houses, both alone and with other people.
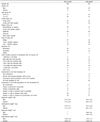
Initially, 422 volunteers (204 men and 218 women) were selected. Respondents were questioned about their current weight (non-corrected self-reported weight; non-cSrW) and height (non-corrected self-reported height; non-cSrH). Measurements of height and weight were then taken. The respondents were aware that after providing responses to the questions, they would be measured. Twenty-eight people refused to measure their weight. Thus, a sample of 394 participants and their weights were measured (measured weight; mW). For administrative reasons and an insufficient number of portable anthropometers, height was measured in 102 respondents (measured height; mH) who were inhabitants of two selected provinces (Silesia, Warmia-Masuria). Thus, the sub-sample numbered 102 participants. On the basis of an own previous study on the nutrition and health of elderly people living in two regions of Poland (Olsztyn, Warsaw) and assuming 5% error of estimation of height and weight, it was assumed that the minimum sample size of elderly men and women equals: for height: 3 and 4, respectively, and for weight: 55 and 75, respectively. Therefore, we decided that the sub-sample size (50 men, 52 women) was satisfactory. No significant differences were found between the total sample and sub-sample in socio-demographic characteristics or in measured weight, height and self-reported estimates (Table 1). Moreover, no significant differences between all provinces in self-reported estimates were found.
Data collection
The survey was included in an omnibus research study. Recruitment, data collection and entry were made, according to study design created by the research team, by the Public Opinion Research Center (CBOS, Warsaw, Poland). All information was collected by means of a "face-to-face" interview using a closed-question questionnaire. The interviews were conducted by well-trained interviewers in the respondent's home. To characterize the respondents, information regarding their socioeconomic situation as well as involvement in food shopping and food preparation for their household was collected (Table 1).
The height and weight measurements were obtained using standardized techniques and calibrated equipment, without shoes [27]. Height was measured to an accuracy of 0.1 cm and weight to within 0.1 kg. For respondents who had problems with removing clothes, a so-called "clothes adjustment" (0.5 kg) was deducted from the measured weight [27].
Corrected self-reported height and weight (cSrW and cSrH, respectively) were determined using multiple regression equations. Dependent variables were cSrW or cSrH, and independent variables were: age, non-cSrW or non-cSrH [20,21]. Full and reduced models were determined for women and men separately, since gender has a significant effect on body size.
BMI was calculated by dividing weight (in kg) by height (in cm) squared, on the basis of measured values (mBMI), non-corrected self-reported (non-cSrBMI) and corrected self-reported values (cSrBMI). Partly-corrected BMI (pcSrBMI) was calculated on the basis of non-corrected self-reported weight (non-cSrW) and corrected self-reported height (cSrH).
Statistical analysis
Variables were described using: mean (x), standard deviation (SD), absolute difference (AD) and relative difference (RD, %), separately for men and women. Differences were calculated from the following formulas: where:
AD-absolute difference, RD-relative difference, non-cSr-noncorrected self-reported value, cSr-corrected self-reported value, pc-partly corrected self-reported value, m-measured value.
On the basis of mBMI and non-cSrBMI or cSrBMI, or pcSrBMI, respectively, the BMI distributions were determined according to the WHO criteria, [30]. In the next step, the percentage of respondents classified in the same category of the BMI using: (i) mBMI and non-cSrBMI, (ii) mBMI and cSrBMI, (iii) mBMI and pcSrBMI (compatible classification) was calculated, as well as the percentage of respondents classified into the BMI category inconsistently with mBMI classification (by ± 1 category, non-compatible classification). After Cade et al. [31], it was assumed that non-compatible classification of respondents by ± 2 BMI categories represented "gross misclassification". Using mBMI and non-cSrBMI or cSrBMI, or pcSrBMI, respectively, the incidence of overweight (BMI ≥ 25 kg/m2) and obesity (BMI ≥ 30 kg/m2) was determined and the compatibility of this assessment was evaluated.
Comparisons between groups were made using a linear correlation coefficient (r), T-test for dependent samples, chi2 test with Yates' correction as necessary. For all tests, P < 0.05 was considered as significant. The statistical analysis was carried out using STATISTICA statistical software (version 9.0 PL; StatSoft Inc., USA, Tulsa; StatSoft Polska, Kraków).
RESULTS
Before correction
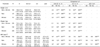
Men significantly overestimated their height on average by 2.4 cm and weight on average by 0.7 kg (Table 2). Women significantly overestimated height on average by 2.3 cm. In women, no significant differences between mW and non-cSrW were found (71.5 kg vs. 71.1 kg). Non-cSrBMI in comparison to mBMI was significantly lower on average by 0.6 kg/m2 in men and 0.7 kg/m2 in women.
A high correlation was found between non-cSrH and mH (men r = 0.90, women r = 0.84), non-cSrW and mW (men r = 0.95, women r = 0.97) and non-cSrBMI and mBMI (men r = 0.87, women r = 0.93).
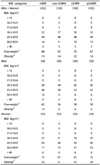
No significant differences were found in non-cSrBMI and mBMI distributions in men and women in the entire sub-sample (Table 3). It was found that 2% of women, according to self-reported estimates, had BMI lower than 18.5 kg/m2, although according to the measurements, no such case was found. No significant differences were found in overweight and obesity incidence when assessed on the basis of non-cSrBMI and mBMI.
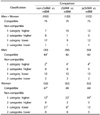
A compatible classification into the same BMI category with the use of non-cSrBMI was found in 75% of respondents, significantly more frequently in men than in women (84% vs. 67%) (Table 4). One category higher classification (non-compatible) with the use of non-cSrBMI was found in 7% of respondents, significantly more often in women than in men (12% vs. 2%). One category lower classification (non-compatible) with the use of non-cSrBMI was found in 17% of respondents (12% men and 21% women). A "gross misclassification" was found for 1% of respondents, one person was classified two categories lower.
After correction
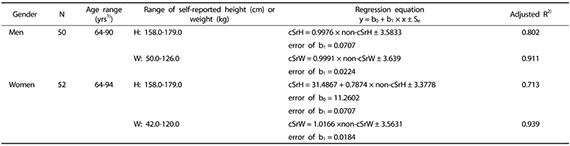
Appendix 1 shows reduced prediction models, describing the relations between non-cSrW and cSrW as well as non-cSrH and cSrH in men and women. A significant explanatory variable of cSrW was non-cSrW, and of cSrH was non-cSrH, while age was an insignificant explanatory variable. In men, the model explained 91.1% of the total cSrW variability and 80.2% of the total cSrH variability. In women, the model explained 93.9% of the total cSrW variability and 71.3% of the total cSrH variability. These models were well-matched. The estimation errors were relatively low, in men ± 3.64 kg for cSrW and ± 3.58 cm for cSrH, while in women ± 3.56 kg for cSrW and ± 3.38 cm for cSrH.
In men, after correction of estimates, height was significantly higher on average by 2.0 cm and weight on average by 0.6 kg (Table 2). In women, measured and self-reported corrected height was equal (on average 156.7 cm), while self-reported corrected weight was significantly higher on average by 0.8 kg in comparison to mW. In men, no significant differences were found between cSrBMI and mBMI. In women, cSrBMI in comparison to mBMI was significantly higher, on average by 0.5 kg/m2.
A high correlation was found between cSrH and mH (men r = 90, women r = 84), cSrW and mW (men r = 95, women r = 97), and cSrBMI and mBMI (men r = 87, women r = 94).
No significant differences were found in cSrBMI and mBMI distributions in men and women in the entire sub-sample (Table 3). No significant differences were found in overweight and obesity incidence, when assessed according to non-cSrBMI and mBMI.
A compatible classification into the same BMI category with the use of cSrBMI and mBMI was found for 75% of respondents (82% men and 69% women) (Table 4). One category higher classification (non-compatible) with the use of cSrBMI was found in 14% of respondents, significantly more often in women than in men (23% vs. 4%). One category lower classification (non-compatible) with the use of cSrBMI was found in 9% of respondents (12% women and 6% men). A "gross misclassification" was found for one respondent who was classified two categories lower.
After partial correction
No significant differences between pcSrBMI and mBMI were found in men and the entire sub-sample (Table 2). In women, pcSrBMI and mBMI were equal (on average 28.3 kg/m2). A high correlation between pcSrBMI and mBMI was found (men r = 0.87, women r = 0.94).
No significant differences were found in pcSrBMI and mBMI distributions in men and women as well as the entire sub-sample (Table 3). No significant differences were found in overweight and obesity incidence when assessed on the basis of pcSrBMI and mBMI.
A compatible classification into the same BMI category using pcSrBMI was found for 75% of respondents (82% men and 69% women) (Table 4). One category higher classification (non-compatible) with the use of pcSrBMI was found in 12% of respondents, significantly more often in women than in men (19% vs. 4%). One category lower classification (non-compatible) with the use of pcSrBMI was found in 12% of men and women. As mentioned above, a "gross misclassification" was found in one person who was classified two categories lower.
DISCUSSION
Generally, elderly people overestimated their height (on average by 2.3-2.4 cm). Similar results were obtained by some authors who concluded that self-reported height was overestimated on average by 1.23 cm to 4.26 cm in men and by 0.60 cm to 4.50 cm in women [3,5,13,32]. The opposite results were obtained by other authors who reported an underestimation of self-reported height. People over 60 years old reported lower height by 0.30 cm to 3.08 cm (men) and 0.60 cm to 4.50 cm (women) [1,8,12]. In elderly people, possible reasons for errors are height reduction due to aging, progressive vertebrae shrinkage, osteoporosis and the effects of gravity [1,9]. In Rowland's opinion [9], the accuracy of self-reported height depended on memory, as elderly people often reported heights from their youth.
Plankey et al. [33] in 1997 concluded that prediction equations did not eliminate systematic error in self-reported estimates of BMI. In recent years, BMI correction equations have been more successful bridging the gap between self-reported estimates and measurements [12,20,23,34,35,36,37,38]. The recent success of correction equations is probably associated with the changing nature of the reporting bias or the error itself [20]. The latest correction equations show great promise, despite some limitations in their use [19]. The reporting bias and errors can vary between populations and may not be stable over time [23,39]. Because of this, the correction equations need to be developed specifically for a particular population and monitored periodically [37]. In some papers, logistic regression was used to determine if the corrected estimates more accurately modelled the relationship between obesity and obesity-related health conditions than the self-reported estimates [2,19,20,24,34].
The current study showed that the application of regression equations to adjust self-reported height also improved their assessment in men and women. After applying regression equation and adjustment, in men, height overestimation was no more than 2 cm, on average. In women, very good adjustment of error was obtained-mean self-reported height after correction was equal to the mean measured height. These results indicate the utility of using regression equations to correct self-reported height, but they do not contradict the use of non-corrected self-reported estimates. The use of self-reported height causes an insignificant higher error in height estimation (on average by 0.3-0.4 cm) than those after height correction with the use of regression equations. Hayes et al. [2] showed that the regression equation for height error resulted in positive coefficients which increased with age. They concluded that older people overestimate their height by a greater amount. With the exception of female weight correction, the extended equations gave little or no improvement over the simple equations in the predicted estimates.
Elderly people, particularly women, accurately reported their weight. In men, the non-corrected self-reported weight was on average higher than the measured weight by 0.7 kg, while in women it was lower by 0.4 kg. Other authors found similar results, they found a mean weight overestimation by 0.4 kg to 2.14 kg for men [1,9,12].
The application of regression equations to correct self-reported weight improved estimation only insignificantly in men and worsened it in women. In men, after correction, weight estimation improved on average by 0.1 kg in comparison to non-corrected self-reported weight. Similarly, Faeh et al. [24] found that the random effect of logistic regression models was better in men than women. In women, the correction resulted in significant overestimation of self-reported weight, on average by 0.8 kg in comparison to the measured weight. To sum up, small errors in estimation of reported weight (up to 1 kg) show the possibility of using non-corrected self-reported weight in elderly men and women and the utility of a regression equation to correct weight reported by elderly men. In women, the use of regression equations to correct self-reported weight is not necessary since women reported their weight with sufficient accuracy. On the contrary, Hayes et al. [2] and Alvarez-Torices et al. [15] showed that for women that the use of regression equations to correct self-reported weight was necessary. Own and other authors results have indicated that the over- or under-reporting bias may be unique to each population. This confirms the importance of deriving correction equations specifically for elderly Poles. According to other authors [2,24,40], the adjustment for self-report bias is complicated because of the changing awareness of obesity over time, i.e. increasing social desirability bias towards lean body weight [2,19,40]. Therefore, it might be necessary to continuously adapt adjustment equations which are used in the same country.
Overestimation of height by men and women and overestimation of weight by men resulted in significant underestimation of BMI, on average by 2.2-2.6 kg/m2 in men and women. A similar range of BMI underestimation was found by Gunnell et al. [8]. Those authors showed that the mean underestimation of BMI was 1.3 kg/m2 in men and 1.2 kg/m2 in women. On the contrary, Avila-Funies et al. [1] and Nyholm et al. [12] found that BMI was overestimated by 0.19 kg/m2 to 1.4 kg/m2. Bias in self-reported BMI depends on survey context, such as whether or not respondents know they will be measured when they report their height and weight [19].
The use of regression equations to correct self-reported height and weight and calculation of BMI resulted in improvement of BMI estimation in both men and women, on average by 0.5 kg/m2. Much better results were obtained by calculating partly-corrected BMI and using corrected self-reported height and non-corrected self-reported weight. In women, mean partly-corrected BMI was equal to mean BMI calculated on the basis of measured estimates, while in men it was only slightly lower (on average by 0.4 kg/m2). Faeh et al. [24] used two correction methods for BMI: a universal cut-off and an age- and gender-dependent adjustment equation. Both methods led to a conservative approximation of results obtained from studies using measured height and weight.
The use of non-corrected self-reported height and weight to identify overweight and obese people was accurate on the population level. This is shown by the relatively low differences in the mean estimation, particularly after the use of regression equations, and by no differences in variable distributions (weight, height and BMI). A similar percentage of the entire sub-sample, for both men and women, was overweight and obese according to non-corrected self-reported estimates and measurements. These results are consistent with observations made by other authors [7,9,10], although they differ from the results obtained by Flood et al. [18]. Flood's team classified more men and women as overweight or obese on the basis of BMI calculated from measured height and weight than on the basis of BMI calculated from non-corrected self-reported estimates (62% and 47% vs. 39% and 32%, respectively).
The use of non-corrected self-reported height and weight in the nutritional status assessment resulted in non-compatible classification of 25% elderly people to BMI categories. It is difficult to compare own results to other ones because no paper regarding misclassification of individuals was found except our previous study. In Polish adolescents aged 13-20 years the percentage of respondents who were compatible classified in ranges of height, weight and the BMI on the basis of self-reported estimates on average amounted to: 92.7%, 94.0% and 89.2%, respectively [14]. The non-compatible classification to higher height or weight category was noted for less than 3% of participants, and to lower category for less than 5% of individuals. In younger age groups reported height and weight estimates were more compatible with measured than in older age groups. The difference between measured and self-reported estimates increased with age but did not exceed 20% of individuals. Similarly to elderly people, in adolescent the bias significantly more often concerned female than male. Thus according to Alvarez-Torices et al. [15] and Kuczmarski et al. [13] the use of self-reported height and weight estimates should be avoided in an older population. Our study proves certain limitations in interpretation of BMI calculated on the basis of non-corrected self-reported estimates when BMI is used on an individual level. An accuracy interpretation of BMI was found for 75% people, regardless of the method which was used to correct the self-reported estimates (partial or full regression equations). This suggests that the use of regression equations to correct the self-reported estimates with reference to the whole population and to men is not necessary. With reference to women, the use of a regression equation to correct height and the use of non-corrected self-reported weight to calculate BMI resulted in better assessment of BMI on an individual level. Such a procedure can be recommended for BMI calculation as a better solution than the use of non-corrected self-reported estimates.
The research is burdened with certain limitations. Complete results were collected from 102 persons, making a sub-sample of the total sample, who were able to prepare meals or snacks on their own. Although the sample size is sufficient, a larger sample size would provide better estimates and stronger evidence. Further study should be directed towards an explanation of the possibilities of also using self-reported height and weight to assess nutritional status in elderly people restricted by various factors, e.g. by illness. Moreover, the effect of social and economic determinants and the incidence of overweight or obesity in the relation to self-reported height and weight accuracy needs to be explained. The present study did not take into consideration the above determinants due to its small sample size.
In conclusion, it was found that elderly Polish men and women significantly overestimated their height, although they accurately reported their weight, particularly women. The use of regression equations to correct the self-reported height improved BMI estimation, mainly in women. The results showed the accuracy of self-reported height and weight estimations as well as for BMI calculations. Thus, the assessment of overweight and obesity incidence was accurate as well. This allows the use of self-reported height and weight in the nutritional status assessment of Polish elderly people to be recommended on the population level. In the nutritional status assessment on an individual level, the use of regression equations is recommended to correct self-reported height, particularly in women.
 XML Download