

 PDF
PDF ePub
ePub Citation
 Print
Print


INTRODUCTION
Malnutrition in children occurs in both developed and developing countries; however the types, prevalence and trends may vary among countries. While childhood overweight and obesity is a major concern in the developed countries, underweight and stunting as well as micronutrient deficiencies are prevalent in developing nations, especially the least developed countries [1]. However, there is increasing concern of overweight and obesity among children in the developing countries. The global trend of overweight and obesity among preschool children showed that the relative increase in the past 2 decades is higher in developing than developed nations [2]. This emerging trend of overnutrition and persistence of undernutrition in children are characteristics of nutrition transition that is occurring in many developing countries, including Malaysia.
In Malaysia, while overweight and obesity is on the rise, undernutrition still prevails among children. The National Health Morbidity Survey (NHMS) 2006 [3] reported that 13.2%, 15.8% and 5.4% of children below 18 years were underweight, stunted and overweight/obese, respectively. The recent NHMS 2011 [4] showed a reduction in prevalence of stunting (13.4%) but an increase in prevalence of underweight (16.1%) and overweight/obesity (6.1%). Other smaller scale studies also supported the co-existence of under- and over-nutrition among Malaysian children and adolescents [5,6].
Low socioeconomic status puts children at risk of having poor diets which can subsequently compromise their growth and development. Household income, a frequently used indicator of socioeconomic status, has been consistently shown to influence diets with higher income is associated with better diet quality. Children from low income households were more likely to have inadequate intakes of macro and micro-nutrients such as protein, folate, calcium, iron, vitamin A and B vitamins [7], low-quality foods that are high in cholesterol, saturated fat, added sugar and sodium [8,9] and inadequate fruits and vegetables [9]. Generally, low income status is related to less diverse diets and lack of adherence to food-based dietary guidelines among children [10]. It has also been reported that living in impoverished condition during childhood could adversely influence adult health, perhaps through its effect on child health and nutrition [11]. Food preferences and dietary behaviors that are established during childhood can track into adolescence and adulthood and may contribute to risk of overweight and obesity, eating disorders and diet-related chronic diseases later in life.
Despite the importance of dietary intake in relation to growth and development of children, published information on food consumption of Malaysian children is lacking. There is a need to examine dietary intakes of children that might have contributed to prevailing undernutrition and increasing overweight/obesity. Accordingly, this study described the intake of energy, nutrients and food groups of urban children aged 1-10 years and examined whether dietary intakes of children differ by household income status.
SUBJECTS AND METHODS
Location
This study was carried out in the urban areas of Wilayah Persekutuan and Selangor from 2010 to 2011. Eight areas were purposively selected for the study and child care centers, kindergartens and primary schools within these areas were targetted for recruiting toddlers (1-3 years), preschoolers (4-6 years) and primary school children (7-10 years) into the study. These areas were selected based on their average household incomes, namely low, middle and high to reflect income distribution within the two urban areas [12].
Respondents
The inclusion criteria for subject selection were male or female children, aged 1-10 years and were of Malay, Chinese or Indian ethnic group. Children with physical disabilities and reported diseases (e.g. asthma, food allergies) were excluded from the study. The sample size calculation (based on 50% of Malaysian children (2-12 years old) did not achieve recommendation for energy intake, margin of error of 10%, 95% confidence level, design effect of 2) yielded a minimum number of 200 children required for this study. The sample size was increased to a minimum of 600 to accomodate for stratification of data by income levels (low, middle and high). Child care centers, kindergartens and primary schools were purposively chosen within the study areas to represent households with different socio-economic status. Parents were given information on research and those agreed to participate were required to provide informed consent. The final sample was 749 children, consisting of equal proportion of male and female children and one-third each of low, middle and high income households. The research protocol was approved by the Medical Research and Ethics Committee of Faculty of Medicine and Health Sciences, Universiti Putra Malaysia (IRB No: UPM/FPSK/PADS/T7-MJKEtikalPer).
Measurements
Parents and guardians were interviewed by trained enumerators using a pre-tested questionnaire to obtain demographic and socio-economic information of households and dietary intakes of children. All interviews were conducted either in the family homes, through telephones or at schools. For young children (1-6 years old), parents/guardians were asked to provide information on food/beverages consumed by the children. A combination of food recall (24 hour diet recall) and food record were used to obtain dietary intake on 1 weekday and 1 weekend. Parents were provided with a food record and a booklet containing pictures of common household measurements (e.g cups, glasses, spoons, bowls, fruit cuts) for estimation of children's food intakes. They were also briefed on the use of food record and booklet of common household measurments. For older children (7-10 years old), they were interviewed on food/beverages consumed within the 24 hour period (24 hour diet recall) preceding the interviews on 1 weekday and 1 weekend. Pictures of common household measurements were used to assist parents/guardians and older children in food recall. Food and beverages bought from school canteens on weekdays by older children were confirmed with enumerators checking the food types, amounts and brand as reported by children. Parents were also contacted to confirm food intakes of older children on weekends. A nutritionist field supervisor routinely conducted random checks of food recalls and records to ensure data quality.
Energy, nutrient and food group intakes of both days were calculated separately and the average intakes of the two days were used for diet analysis. Dietary intakes of both days (using recall and record) were found to be significantly correlated for energy (r = 0.49; P = 0.000) and nutrients (r = 0.37-0.69; P = 0.000). Diet adequacy of children was assessed in two ways. First, dietary data were analyzed using Nutritionist Pro software for energy and nutrients. The USDA Food Database was utilized for determining energy and nutrient values of foods and beverages. For foods (e.g local dishes) not available in the food database, at least 2 recipes were used to compute energy and nutrient values. To assess intake adequacy, comparison of energy and nutrient intakes by age group and sex were made to the Malaysian Recommended Nutrient Intake (RNI) [13] and US Dietary Reference Intakes (DRI) [14,15]. Daily energy and nutrient intakes did not include intakes of vitamin and mineral supplements. Second, intake servings of seven food groups (grains and cereals, fruits, vegetables, fish, legumes, meat and poultry, milk and dairy products) were calculated from food recall and record and the average intake serving (for two days) for each food group was evaluated according to the recommended food group servings for Malaysian children [16].
Dietary data were also checked for under and over-reporting of energy intake (implausible energy intake) using the method by Huang et al. [17]. Plausible energy intake of children was defined as sex- and age-specific ± 1 Standard Deviation (SD) cut-points of energy intake as a percentage of predicted energy requirement. As there was no plausibility range for children less than 3 years old and the ranges were similar for 3-13 year olds by sex and age groups, we used a less conservative plausibility range of 80-120% for all children, regardless of age and sex. The physical activity level (PAL) of all children was assumed to be low-active (PAL between 1.4 and 1.6). Using this plausibility range, approximately 24%, 50% and 26% were categorized as under-, plausible and over-reporters. However, we included all dietary data in the analysis as all data points were well within ± 3 SD of mean energy intake for each age group [18].
Statistical analysis
Statistical Package for Social Sciences version 19.0 was used for data analysis. Data are presented by age groups (1-3 years, 4-6 years and 7-10 years) [16] and stratified by income levels (low, middle and high). General linear model (One-Way Analysis of Covariance) was used to test differences in energy, nutrient and food group intakes according to income levels within each age group, adjusting for sex, ethnicity and body mass index. Data are presented as mean, standard error of the mean and percentages. Significant differences between income groups was determined using Bonferroni post-hoc test. Statistical significance was set at P < 0.05.
RESULTS
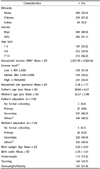
The sample consisted of 59.6%, 31.2% and 9.2% Malay, Chinese and Indian children, respectively with almost equal proprotion of boys (48.9%) and girls (51.1%) (Table 1). There were 181 toddlers (1-3 years old), 252 preschoolers (4-6 years old) and 316 primary school children (7-10 years old). There was a similar distribution of children in low (31.9%), middle (34.6%) and high (33.5%) income groups. The mean age of fathers (38.6 ± 6.4 years) was slightly higher than that of mothers (35.6 ± 5.5 years). Most fathers (79.8%) and mothers (81.5%) had at least higher secondary education. The mean birth weight and birth order of children was 3.0 ± 0.5 kg and 2.3 ± 1.6, respectively. The percentages of underweight, stunted and overweight/obese children were 15.2%, 18.7% and 21.4%, respectively.
Mean energy and nutrient intakes
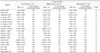
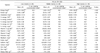
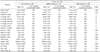
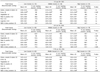
Energy and nutrient intakes of toddlers (1-3 yeras), preschoolers (4-6 years) and school children (7-10 years) by income levels are shown in Tables 2,3,4. Mean energy and nutrients (except for dietary fiber) for toddlers in all income groups either met or exceeded recommended intakes (Table 2). For energy and most nutrients, a majority of 1-3 year olds met recommended intakes and there was not much difference in percentages of children from different income levels meeting RNI. For preschoolers (Table 3), energy and most nutrients were significantly different by income levels with children from low and middle income households had significantly lower intakes than high income group. While mean energy intake of low income group was below requirement, mean intakes of vitamins A and D and calcium of low and middle income groups did not meet recommended levels. Although there was no significant difference for mean sodium and fiber intakes by income levels, mean sodium intake of high income group (M= 1,783) exceeded the allowed range (1,200-1,700 mg) and dietary fiber intake of all income groups were below the recommended range of 20-30 gram. For school children in all income groups (Table 4), the mean intakes for all nutrients except energy, vitamin D, folate, calcium and dietary fiber, achieved the recommended levels. There were significant differences in intakes of energy and several nutrients (protein, fats, carbohydrate, B vitamins, folate, calcium, iron, zinc and sugar) with low and middle income groups had lower intakes than high income group.
Mean intake of food groups
The food group intakes of children by income levels are presented in Table 5. For toddlers, only fruit intake was significantly different by income levels with children from low (M = 0.09 serving) and middle (M= 0.10 serving) income households had significantly lower mean intakes than children of high income group (M = 0.25 serving). However, mean intakes of fruits, vegetables and legumes for all income groups were still below the recommended servings. For preschoolers, there were significant difference in mean intakes of fruits, meat/poultry and milk/milk products by income levels with high income children had higher mean servings than children of other income groups. Mean intake of fruits (M= 0.07 serving vs M = 0.31 serving) and milk/milk products (M= 1.14 serving vs M = 1.88 serving) were significantly lower in low than high income groups while low income children (M= 0.78 serving) had significantly lower intake of meat/poultry than middle (M = 1.08 serving) and high income (M = 1.19 serving) children. Nevertheless, all food groups except for grains/cereals and meat/poultry did not achieve recommended levels. For school children, only mean intake of milk/milk products was significantly lower in low (M = 0.54 serving) than high (M = 0.93 serving) income children. Mean servings of all food groups except meat/poultry were below the recommended levels.
Percentage of children with inadequate or excess energy, nutrients and food groups intakes
For 1-3 year olds, higher percentages of low income children had inadequate intake of vitamin D (48.6%) and excess energy intake from sugar (16.7%) but lower percentages with excess energy intake from protein (63.9%) and inadequate meat servings (48.6%) (Table 2). Among preschoolers, more low income children had inadequate intakes of energy (63.5%) and nutrients (16-74%) and servings of grains and cereals (62.4%), meat and poultry (30.6%) and milk and dairy products (77.6%) as compared to middle and high income groups (Table 3). Similar to preschoolers, higher proportions of low income school children did not have adequate intakes of energy (76.8%) and most nutrients (24-67%) and servings of milk and dairy products (95.1%) (Table 4)
DISCUSSION
Socioeconomic status (SES) is recognized as an important determinant of health and nutrition as lower SES could contribute to health and nutrition disparities. Inadequate income, an indicator of lower SES, puts individuals at risk of developing unhealthy dietary patterns that could contribute to inadequate or excess intakes of energy and nutrients [19]. While children from poor households are at risk of having inadequate diets that could compromise physical growth [7,9,10], socioeconomic disadvantage during childhood i.e living in impoverished households can also increase the risk of obesity and chronic diet related diseases in adulthood due to mechanisms that are poorly understood [11].
In our study, toddlers (1-3 years old) in all income groups had similar energy and nutrient intakes and similar percentages meeting the recommended nutrient intakes. However, low income preschoolers (4-7 years old) and school age children (7-10 years old) had lowest intakes for most nutrients and highest percentages that did not meet energy and nutrient recommendations. In a study among infants and young children (0-24 months) from agriculture-based communities in Brazil [20], the major contributors to energy intake of young children (> 6 months) were (excluding breast milk) non-enriched rice and maize flours, non-enriched cow's milk and sugar (soft drinks, artificial juices and sugar added to porridges). Meat, fruits and vegetables were not consumed regularly by these young children. Iron intake was significantly different across tertiles of wealth index with higher intake in the highest than lowest tertile groups. Among 2-3 year old Hispanic and American young children enrolled in the Special Supplemental Nutrition Program for Women, Infants and children (WIC), majority had higher than recommended intakes for saturated fat and sodium but inadequate intakes of dietary fiber, whole grains, vegetables and milk and dairy products [9]. Studies also reported that older children as compared to younger children, regardless of income status, tend to have poorer diet quality characterized by foods that are low nutrient dense and high in fats, sodium and added sugar and inadequate dietary fiber [7,8,10].
There are several plausible explanations to the observed relationship between household income and dietary intakes of children. Higher income could mean a stronger purchasing power for better quality foods while limited income restricts access to nutrient-dense foods [19]. Food insecurity which could be experienced by low income households is associated with lower food expenditure. This could translate into the purchase of higher energy but lower nutrient dense foods which are more affordable as compared to fruits, vegetables, lean meats and fish. In addition, the high palatibility of foods high in sugar and fat could reinforce the liking for such high energy dense foods, particularly among children [21].
Food environment, particularly home and community, could also play a predominant role in influencing food choices of children. Exposure, availability and accessibility to foods at home could affect taste preference and intake of children [22,23]. Given that the energy cost is much lower (less expensive) for high energy dense foods, children in low-income households could be more exposed to high energy than high nutrient dense foods for meals and snacks at home. The shared home food environment could as well contribute to the parent-child dietary resemblance [24]. Keita et al. [8] reported that children living in disadvantaged urban neighbourhoods or communities were more likely than those residing in more advantaged urban neighbourhoods, to have poorer diet quality characterized by greater percentage of energy from fat and higher intakes of trans fat and sodium. Differences in access to grocery stores or food prices, quality and selection could possibly explain these dietary disparities.
Maternal education is another important factor underlying income differences in dietary intake of children. In Dutch INPACT Study [25], children of mothers with high education level consumed more fruits and vegetables per day and were more likely to have breakfast daily than children of low-educated mothers. Other studies have shown that children of educated mothers were less likely to be stunted, anemic or iron deficient [26,27]. Higher maternal education could be translated to better nutrition knowledge, decison making, feeding style and role model which could positively impact children's eating behaviors and consequently dietary intakes [6,28].
In the present study, a high proportion of preschoolers and school age children had total fat (58-68%) and saturated fat (60-70%) intakes exceeding recommendation. Based on the United States NHANES 1999-2004 data, the percentage of energy from macronutrients for 3-5 year olds were 54% (CHO), 13% (protein), 33% (total fat) and 12% (saturated fats) [7]. Manios et al. [29] reported that toddlers and preschoolers in Greece had mean energy intakes exceeding requirements with percentage of energy from protein, carbohydrate, fat and saturated fat were 17%, 46%, 40% and 16%. In the United States [30], mean energy intake of 6-10 year olds exceeded requirement while percentage of energy for total fat, saturated fat, carbohydrate and protein were 31%, 11%, 55% and 15%. The relatively high total fat and saturated fat intakes and low carbohydrate intake as percentage of energy intake observed among children of various age groups in these studies could be attributed to higher consumption of high-fat foods and lower intakes of whole grains, fruits and vegetables.
We showed that the mean protein intake of children in all age groups exceeded the age-specific recommendation and that almost all children met the RNI for protein intake. Several other studies in Malaysia have reported similar findings [31,32]. The amount and types of protein consumed in infancy and childhood could increase the risk of adiposity in later childhood. Gunther et al. [33] showed that high protein intakes at 12 months (2.5 g/kg body weighr) and 18-24 months (2.6 g/kg body weight) were independently associated with adiposity at the age of 7 years. Animal protein intake, particularly cow's milk and dairy products, at age 12 months and 5-6 years was found to be associated with unfavorable body composition at 7 years [34]. High protein intake could contribute to earlier (< 5-7 years of age) adiposity rebound in children and consequently higher risk of adult adiposity [35]. Although the cross-sectional design of this study did not allow any inference of causal relationship for protein intake and adiposity in children, in light of increasing overweight and obesity among Malaysian children and adults, it is worthwhile to further investigate the contribution of protein intake to BMI trajectory of Malaysian children that could explain overweight and obesity later in adulthood.
Despite the importance of fruits and vegetables for prevention of diet related chronic diseases, mean fruit and vegetable intakes of children and adults in many populations were lower than recommendations [36]. In our study, almost all children (> 95%) did not meet the recommended servings for fruits and vegetables. In the United States, the percentages of children aged 2-13 years not meeting recommended intakes of fruits and vegetables increased with age with more children not consuming adequate amounts of vegetables (80-96%) than fruits (31-78%) [37]. Several other studies also showed that children did not consume adequate servings of fruits and vegetables daily [38,39]. The limited available data on Malaysian children's consumption of fruits and vegetables also supported intakes lower than recommended amounts [31,40] with fruits were preferred more than vegetables [6,41].
The low intake of dietary fiber observed among children in this study is concomitant to their low consumption of fruits, vegetables and legumes. Although we did not determine intake of whole grain foods, it is highly possible that intake of these foods was low which could be partly due to limited availability of whole grain products in Malaysia. Kranz et al. [42] reported that higher fiber intake is associated with increased intake of nutrients and number of servings of food groups in American presechoolers. Low-fiber fruits and legumes were the main sources of dietary fiber for these preschoolers, indicating the children's preference for less fiber dense foods. The main sources of dietary fiber may vary by populations due to different cultural diets and availability of the fiber foods which may influence food preference and consequently intake of dietary fiber.
We showed that more than half of the older children did not meet the recommendations for calcium and vitamin D. A nationwide dietary survey of children in Malaysia [32] also reported that the percentage of children not achieving the recommended calcium intake was higher in older (4-12 years) than younger children (6 months-3 years). The low intake of calcium could be attributed to the low intake of milk and dairy products among older children. Although milk consumption is positively associated with nutrient intakes or nutrient dense diets in children and adolescents [43], excessive consumption of milk could displace the intake of important nutrients from foods in young children. As children grow older, the gradual decline in milk intake and increase consumption of less nutritious beverages (e.g. sugar sweetened beverages) could adversely influence calcium intake and consequently bone health [44]. Low vitamin D status among Malaysian children is a rising concern in Malaysia. Khor et al. [45] reported that among 402 urban primary school children, 37.1% and 35.3% had deficient and insufficient vitamin D status. A recent nationwide study [32] showed that 47.5% children (4-12 years old) had vitamin D insufficiency with a higher prevalence in urban (50.2%) than rural (36.0%) areas. As Malaysian children are less likely to be exposed to the sun as they tend to spend more time for indoor than outdoor activities, good dietary sources of vitamin D in the diets of children are lacking and vitamin D fortified food products are limited in the markets, Malaysian children are at risk for poor vitamin D status.
Studies have highlighted excessive consumption of sodium and sugar among children [30,38,46,47]. We showed that although the mean sodium intake of each age group was within the recommended amount, the mean sodium intakes of preschoolers and school age children were at the higher end of the recommended range. Similarly, all age groups had mean energy from sugar that was within recommended amount (15% of energy intake) with older children had higher intake (11%) than toddlers (7%). The percentage of children in each age group with excessive amount of sodium and sugar intakes are 26% and 12% (1-3 years); 47% and 27% (4-6 years); 33% and 23% (7-10 years). The Feeding Infants and Toddlers Study showed that US young children had higher than recommended amount of sodium with about 85% of 2-3 year olds consumed at least one serving of salty snacks, sweetened beverages, desserts or sweets on the survey day [38,46]. Ford et al. [47] reported that foods high in added sugars, sodium and solid fats predominated the top changes in per capita consumption among US preschoolers during the past 20 years (1989-2008). Among US 6-18 year olds, more than 97% exceeded the Tolerable Upper Intake Level for sodium [30]. In many developing countries undergoing nutrition transition, urbanization and globalization are associated with changes in activity and eating patterns of populations towards sedentary lifestyle and higher intakes of processed foods, ready-to-eat meals and snacks and hawker, fast food and restaurant meals that are relatively high in energy, total fats, sugars and sodium [48]. For growing children, intake of high energy and low nutrient dense foods can displace the essential nutrients required for growth and development which could put them at risk of either under- or overnutrition.
While informative, this study has several limitations that must be acknowledged. First, the findings are generalizable to only children living in urban communities that are similar to the selected study areas of Wilayah Persekutuan and Selangor. Nevertheless, the inclusion of children of various age groups and income levels could provide useful dietary information of children living in urban households. Second, the use of two days of diet recall and record might not reflect the usual food intakes of children and could be subjected to under- and over-reporting by parents, caregivers or older children. To ensure data quality, we carried out quality checks at various time points i.e during diet interviews, review of diet recalls and records, dietary analysis and data entry. For example, if there was a suspect that food was inadequately or excessively consumed, the information was verified again with parents, caregivers or children. Third, the analysis of energy, nutrients and food groups did not include breastmilk and dietary supplements which could lead to underestimation of reported values. In our sample of 1-3 year old children, about 59% of the children were still breastfed but almost all of these breastfed children received other milks, perhaps due to being in child-care centers. Based on food recalls and records, breastfeeding occured mostly at night (in home setting) while growing up milks or other milks (e.g. UHT milk) were given during the day (on both weekend and weekday). Approximately 56% of children in this study were given dietary supplements such as vitamin C, cod liver oil and multivitamins and minerals. Fourth, children in the age groups of 1-3 years and 4-6 years were recruited from child care centers and kindergartens, respectively. The dietary intakes of these children could be different from children of the same age groups being cared by parents or other caregivers in a home setting. In addition, the receipt of food assistance programs which was not examined in the study (e.g. school milk program, food basket for underweight children, school feeding program) might influence dietary intakes of children. Finally, data on sodium and sugar intake could be under or over-estimated. While the dietary software includes sugar and sodium occured naturally in foods or added to foods during processing, the amounts of salt and sugar added to mixed dishes and beverages (home prepared or bought from restaurants/food vendors) were only estimated. However, it is more likely that the data were underestimated as we included minimal amount of sodium and sugar in these mixed dishes and beverages.
Despite the limitations, this study highlights nutritional concerns among urban toddlers, preschoolers and school age children that are similar to those reported elsewhere. High intakes of total fat, saturated fats, sodium and low intake of calcium, dietary fiber and food group servings (fruits, vegetables, milk and dairy products) are of particular concerns among older children. Lower socioeconomic status may further limit children's accessibility to quality diet. Dietary guidance to parents or caregivers of children less than 10 years old should address quality foods (i.e more nutrient dense, calcium-rich, less salt, sugar and fats, plant-based) in the home food supply and development of healthy eating habits in children. There is a need for the involvement of various parties (parents, caregivers, schools, health professionals, relevant ministries and food industry) to ensure children, particularly those from low income households, meet the recommended amounts of nutrients, thus enabling the attainment of optimum growth and minimizing the risk of chronic diseases in adult life. The existing provision of national food assistance programs to children from low income households and promotion of breast-feeding could be among the many strategies that could improve health and nutrition of these children.
 XML Download