

 PDF
PDF ePub
ePub Citation
 Print
Print


INTRODUCTION
Prevalence of obesity increases gradually during adulthood, and the obesity rate was estimated at 36.8% for adult men and 24.8% for adult women in Korea [1]. Particularly in women, obesity rate at age 40 or above is rapidly increased to 46% as well as the incidence of metabolic syndrome [1]. The metabolic syndrome is characterized by improper blood lipid profiles, abdominal obesity, high blood glucose, and high blood pressure [2].
Dietary supplements or medications, which help to control appetite, increase metabolism, or decrease lipid-absorption, have been developed specifically for prevention of obesity and obesity related chronic diseases [3]. However, those medications developed previously have yielded several side effects, thus there has arisen a need for development of a supplement that minimizes the side effects while maximizing effectiveness or maintenance of weight loss.
Peanuts are also a good source of resveratrol in nature, and the resveratrol contents were found to be higher in sprouted peanuts than in peanuts [4]. In addition, peanut sprouts have plenty of certain nutrients, like essential amino acids and fatty acids, and antioxidants, which increase during germination of peanut kernels [5,6].
To date, some studies regarding peanut spouts, such as antioxidant ability [7,8,9,10], nutritional assessments [4,5,6], and laxative effect [11] have been reported. Although studies focusing on anti-obesity effects of resveratrol have been published [12,13,14,15], the study of peanut sprout on obesity is very limited [16,17]. Our previous in vivo study showed that feeding rats a high-fat and PSE supplements led to a decrease in the final weight gain as well as total visceral fat [17]. This effect was explained by the effects of peanut sprout extract in restraining adipocyte differentiation and proliferation [16,17].
As it was necessary to confirm the anti-obesity effects of peanut sprout extracts seen in animal experiments through human experiments, this study recruited overweight and obese women with body mass index (BMI) of at least 23 and determined the effects of peanut sprout supplementation.
SUBJECT AND METHODS
Recruiting subjects
Participants in the study were recruited by advertisement in newspapers and in posters at some hospitals. Healthy over-weight and obese women (BMI of 23 or above) between ages 20 to 55 enrolled in this study. Exclusion criteria included any chronic diseases such as diabetes, hypertension, cancers, heart-related diseases, and pregnant and lactating women. In addition, women who had weight loss-diet or therapy in the last 3 months, had more than 300 mg/dL of cholesterol, or had mental problems or alcohol issues were excluded. Ultimately, after the screening test, 45 participants were selected and provided written informed consent for the experiment.
PSE compositions and study treatments
The peanut sprout extract (PSE) powder was provided by ChonNam National University (ChonNam, Korea). The contents of crude protein, crude fat, and carbohydrate in PSE, as a dry basis, were 37.2%, 31.8%, and 23.1% (all w/w), and the remaining components were 7.0 % moisture and 6.9% ashes (data not shown). The resveratrol content of peanut sprout extracts was determined by high-performance liquid chromatography (HPLC) and the study method has been published elsewhere [10]. In HPLC, PSE used if this study was found to contain 89.1 ± 0.85 mg/g of trans -resveratrol from standard calibration measurement with a trans-resveratrol.
The amount of peanut sprout extract was determined according to the amount of resveratrol in the peanut sprout extract; the low PSE-dosage contained 250 mg RSV/day and high PSE dosage contained 500 mg RSV/day. One capsule of low PSE-dosage contained 47% of the peanut sprout extracts and 63% dextrin, making one capsule containing approximately 20.74 mg of resveratrol. One capsule of high PSE-dosage contained a 93.2% peanut sprout extract and 6.8% dextrin, in which one capsule contained 41.5 mg resveratrol. The placebo tablet was the same as the treatment capsule except that the peanut sprout extracts were replaced with 100% dextrin. The capsules were packaged identically with the same unclear bottle, so that neither researchers nor subjects were able to distinguish them by appearance.
Study design
This experiment was approved by the University Hospital Human Study Review Board (Seoul, Korea) (#EMCIRB-11-116), in accordance with the Declaration of Helsinki. This study was conducted as a randomized, double-blind, placebo-controlled trial. The 45 qualified participants who were selected from screening test, and signed the agreement paper were randomly divided into 3 groups-the control group, the low-dosage group, and the high-dosage group, each group included 15 subjects. The participants were instructed to take 4 capsules/ time, three times a day, 30 minutes before meals for 4 weeks, and each capsule was to be taken with 200 ml water. In the case that the participants did not consume the capsules before meals, they were advised to take the capsules at most 30 minutes after meals.
At the end of the study, all subjects were asked to bring back the remaining capsules to check compliance and adherence with the study. The participants were asked to maintain their current life style and dietary habits during the experiment. Anthropometry, body compositions, dietary intakes, and blood samples were evaluated upon admission and first and last week of the experiment. Any side effects during the experiment were investigated at the first week, 2 weeks, and 4 weeks through telephone, or face-to-face appointments.
Anthropometry and body composition measurements
Height was measured using a portable stadiometer to the nearest 0.1 cm. Waist circumference (WC) was measured midway between rib cage and superior border of the iliac crest after complete expiration using a measuring tape. Body weight and body fat (%) were measured by use of bioelectrical impedance analysis (In-body 3.0, Biospace, Seoul, Korea). BMI was also calculated using weight and height data. Subjects were required to visit the hospital two times during the experiment for anthropometrical, dietary, physiological, and biochemical analyses.
Blood sample analysis
Blood samples were collected in the morning at the first and last week of the experiment. Participants were invited to visit the hospital after an overnight fast. Venous blood samples were collected in tubes containing sodium EDTA (1 g/l). Whole blood drawn from subjects was used for analysis of Complete Blood Count (CBC). Serum samples were prepared within 1 h after blood collection by centrifugation (1000 g for 10 min at 4℃) for analysis of blood biochemical tests.
Analysis of hematological and biochemical parameters
For CBC test, the cell counting component counts the numbers and types of different cells within the blood; white blood cell (WBC), red blood cell (RBC), hemoglobin (Hb), hematocrit (Hct), mean corpusculer volume (MCV), mean corpuscular hemoglobin (MCH), mean hemoglobin corpuscular concentration (MCHC). Differential counts were analyzed. For blood biochemical tests, the serum concentrations of albumin, creatinine, blood urea nitrogen (BUN), glutamic oxalate transaminase (SGOT or ALT), serum glutamic pyruvate transaminase (SGPT, AST), γ-GTP (γ-glutamyl transpeptidase), Alkaline phosphatase, Total bilirubin, Total protein and glucose were determined using the automatic blood analyzer (ADVIA 2120, SIEMENS, Washington D.C. USA). Cholesterol, triglyceride, LDL-cholesterol, and HDL-cholesterol were also determined using the instrument of automatic blood analysis (ADVIA2120, SIEMENS, Washington D.C. USA). Cholesterol/HDL-cholesterol, HDL-cholesterol/LDL-cholesterol was calculated using the known formulas [18].
Dietary intake survey from 24 hour dietary recall
Two non-consecutive 24 hour recalls (one for weekday and one for weekend) on the first and last day of experiments were conduted by a trained dietitian.
The participants reported the types and quantities of all foods and beverages consumed during the preceding day and the weekend. In order to improve the amount of dietary intake, food models and photographic manual of food portion size were used. The dietary intake data were analyzed using the software (Can Pro 3.0) developed by the Korean Nutrition Association. After calculating energy and nutrients intakes, average intake was compared to the dietary reference intakes for Korean (KDRIs) and expressed as a percent KDRIs.
Compliance ratio (C.R.) calculation
We also assessed any side effects by asking the following questions, by phone at 2 weeks of experiments and by interviewing face to face on visiting day at the hospital on the last day of the experiment; ' did the tablets have any adverse effects on you or make you feel bad in any way?'. In respect of the pill count, a compliance ratio (C.R.) was calculated according to the formula:
Statistical analysis
The statistical analysis was performed using SPSS Ver.19.0 (SPSS Inc., Chicago, IL, USA). The data are presented as mean ± SD. Since the number of the subjects in each group was only 15, tests on the distribution (Kolmogorov-Smirnov-test) as well as skewness were performed to determine the normality of data. The skewness values of most variables, except some variables such as ALT and AST, were between -1 and +1, which are considered acceptable to prove normal distribution. Thus the differences between pre- and post-test in each group were evaluated using Student's paired t-test.
Analysis of covariance (ANCOVA) was performed to determine the effect of PSE treatment: variables at post-test as the dependent variable, group (the control and two intervention groups) as level of the independent variable, and the same variables at pre-test as the covariate.
RESULTS
Changes of physical characteristics among groups
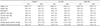
The changes of anthropometry and body compositions before and after the experiment are shown in Table 1. The placebo group lost a total of 0.5 kg over the 4 weeks, while the Low PSE group lost a total of 1.5 kg or 1.1 kg in the High PSE group over the 4 weeks; however, in all three groups, no statistically significant changes of body weight were observed between pre- and post- test. No statistically significant differences in BMI, body fat mass, fat-free mass, body fat percent between pre- and post- test were observed in all three groups.
In the waist-circumference, the PSE groups (both Low and High PSE group) showed statistically significant reduction at post-test, while no differences of waist circumferences were observed in the placebo group. The PSE treatment showed a significant dose-dependent effect [F = 6.24, P < 0.01].
In the Low PSE group systolic blood pressure showed a significant decrease between pre and posttest. Systolic blood pressure at posttest was also decreased in the High PSE group, although without statistical significance, whereas no changes of blood pressure were observed in the placebo group between pre- and post-test.
Changes of blood lipid profiles among groups
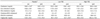
No statistically significant differences in cholesterol and HDL were observed between pretest and posttest in all groups (Table 2). Only in the High PSE group, mean LDL level at post-test, 104.7 mg/dL, decreased significantly from that of the pretest p (110.7 mg/dL) (P < 0.05). However, there was no PSE dose-dependent effect on LDL concentration ([F = 0.29, P > 0.05].
Among three groups, the change of triglyceride was significant between pre- and post-test only in the Low PSE group (P < 0.05). No statistically significant differences of TG were observed in either the High PSE group or the placebo group.
There was a main effect of the PSE treatments, whereby the reduction of TG concentration showed significant, dose-dependent association with the PSE treatments [F = 6.24, P < 0.01].
Hematological values
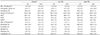
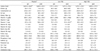
The hematological values in Hct, MCV, MCH, and MCHC, excluding hemoglobin, did not differ between pre- and post-test in all three groups (Table 3). In the High PSE group only, there was a significant increase of hemoglobin levels at post-test, compared to pre-test (P < 0.05). The MCH percentage (%) between pretest and posttest showed significant increases in all three groups, but the increases at the post test were similar among groups. There was no significant dose-dependent PSE effect on LDL concentration ([F = 0.52, P > 0.05]. In all three groups the differential white blood cell counts, including neutrophil, eosinophil, basophil, monocyte, and lymphocyte were not significantly different between pre and post-test.
Blood biochemical parameters
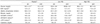
No significant differences in glucose, BUN, alkaline phosphatase, bilirubin, and creatinine levels were observed between pre and posttest in all groups (Table 4). The Low PSE group showed significant reductions in the levels of AST, ALT, and γGTP at posttest (P < 0.05). The levels of ALT, AST, and γGTP enzymes were also reduced in the High PSE group, however, in the High PSE group, only AST changes between pre- and post- test were statistically significant (P < 0.05). There was significant PSE dose-dependent effect on AST (SGOT) concentration ([F = 4.35, P < 0.05].
Calorie and nutrient intakes
No statistically significant differences with regard to energy and energy-dense nutrients were observed between pre- and post-test in all three groups (Table 5). It seemed that the placebo group consumed more protein and less CHO than the Low PSE group. The low PSE group had consumed much less energy at post-test, compared to either the placebo group or the High PSE group, but without statistical significance. No statistically significant differences in vitamin and mineral intakes, except vitamin C, were observed between pretest and posttest in all three groups. In the Low PSE group, not in the placebo group or the High PSE group, vitamin C intake was significantly different between pre- and post- test. However, there was no significant PSE dose-effect on vitamin C intake ([F = 0.299, P > 0.05]. Dietary cholesterol intake also showed a similar increase in all three groups, showing no significant differences between pre- and post- test in all three groups.
DISCUSSION
Waist circumference (WC) and waist-hip ratio (WHR) are widely used in assessing the relationship between body fat distribution and metabolic and cardiovascular diseases [19]. WC has been suggested as a health indicator for central obesity because WHR provides information on the regional distribution of adipose tissue that is independent of the degree of obesity and less closely linked to the amount of abdominal visceral adipose tissue [20].
The PSE supplements resulted in a significant reduction in waist circumference after 4 weeks on average. This reduction of waist circumference may have been associated with weight loss due mainly to loss of fat mass; the placebo group lost a total of 0.5 kg weight over the 4 weeks, while the experimental group lost a total of 1.5 kg in the Low PSE group or 1.1 kg in the High PSE group over the 4weeks. In determining dietary intake between pre-and post-test in all three groups, no significant differences in the energy or nutrient intakes were found. Thus the reduction of WC can be explained by the effects of the PSE supplements. If the experimental period were longer than 4 weeks, statistical significance in weight changes or body fat (%) may be seen. The result of the previous in vivo research is consistent with this human clinical study, showing that peanut sprout extract supplemented rats had significant reduction of final weight and epididymal fat weight, compared to high-fat fed rats [17]. Since there is no human clinical trial showing possible action of peanut sprout on weight reduction, further study with longer experimental periods and more subjects is needed to clarify the possible relationship. Although the mechanism of anti-obesity activity of peanut sprout is not yet clear, peanut sprout appears to activate the protein expressions of PPARγ and improve adiponectin secretion in adipose tissues which has been shown to play important roles in lipolysis and thermogenesis [17].
PSE supplementation appears to be effective in decreasing blood pressure as well as improving blood lipid profiles. The PSE group showed significantly decreased systolic blood pressure, compared to the placebo group (P < 0.05). The Low PSE group also showed significantly decreased TG levels while the LDL level was effectively decreased in the High PSE group, whereas no changes in blood lipid profiles were shown in the placebo group between pre- and post- test. Studies with animals as well as humans with RSV supplementation have reported reduced hepatic lipid synthesis, reduced heart rate, and lowered blood pressure [21,22]. Since resveratrol is one of the main components of peanut sprout, these health benefits of peanut sprouts could result in part from the effect of resveratol.
Besides resveratrol, peanut sprouts contain plenty of pholypherols, including gallic acid, protocatechuic acid, and caffeic acid, and total polyphenol content of peanut sprout is much higher than that of resveratrol [5,10]. Thus, it seems that a mixture of various active compounds of peanut sprouts as they occur during germination might have greater synergetic effects than individual component, resveratrol. In a recent animal study, rats administered peanut sprout extracts showed increases in stool frequency as well as fecal weight, and suggested that it is related to the other components, such as polypherols and fibers, in addition to resveratrol [11]. Two previous in vitro studies reported that combination treatment with resveratrol and other natural polypherols resulted in significantly suppressed lipid accumulation compared with the responses to resveratrol alone [23,24].
The changes of serum AST and ALT levels have been established as markers of liver injury. Plasma ALT levels are also associated with decreased hepatic insulin sensitivity and an increased risk for obesity related diabetes [25]. Obese patients with nonalcoholic fatty liver disease (NAFLD) commonly present with elevated markers of liver enzymes including AST and ALT [26]. This study showed a significant decrease in AST and ALT levels in the PSE group, but not in the placebo group, suggesting the safety of intake of peanut sprouts as a dietary supplement as well as possible protection against liver damage caused by obesity.
In addition to the biochemical parameters for proving safety of peanut sprouts supplements, we also assessed any side effects by asking about any adverse-symptoms and no side effects were reported during the study period. Only two people out of 45 were dropped because of personal matter. In respect to the pill count, average compliance rate was 97.5%. Thus we concluded that the dosage of peanut sprout extracts used in this study was safe without side effects.
In this study, high dose of PSE supplement did not double its effectiveness, compared to low dose of PSE. This may be due to an inadequate amount of high PSE supplemented. Another possibility is that high amounts of peanut sprouts may lead to low bioavailability in the body. Since high PSE contained higher amounts of peanut sprouts as well as Rasveratrol, there were consequently more food components that made resveratrol less effective [27]. This is the first study involving a human clinical trial with peanut sprout supplementation, further study determining adequate amount of peanut sprout extract to show optimal health effect and to determine the bioavailability with various dosages of peanut sprout in this setting is needed.
In conclusion, 4 weeks of peanut sprout extracts supplementation reduced waist-circumference. In addition, significant decreases in systolic blood pressure, blood triglyceride, ALT, and AST levels were observed in the PSE groups, not in the placebo group. Since no side effects and no toxicity of peanut sprout extracts supplementation in this human clinical trial were detected, it might be suggested that peanut sprout extract is a relatively safe functional food and intake of amounts of peanut sprouts may be beneficial for health.
 XML Download