

 PDF
PDF ePub
ePub Citation
 Print
Print


INTRODUCTION
A well-balanced diet is necessary for adolescents due to their rapid growth and physical maturation [1]. The dietary habits established during adolescence continue to track into adulthood, and establishing desirable dietary habits is very important to ensure high public health. However, rapid economic growth and Western lifestyle adoption over the last decade in Korea have led to changes in dietary habits, such as frequent dining out and fast food consumption, especially among adolescents. According to the Korean National Health Examination and Nutrition Survey (KNHANES) in 2012, the percentage of those aged 12-19 years who dined out at least once per day or skipped breakfast was 36.7% and 27.6%, respectively, and these percentages were higher than those in the adult population. Furthermore, the percentages of those consuming carbonated drinks and fast food more than three times per week were as high as 26.3% and 12.3%, respectively. American children and adolescents in a Minnesota study reported similar trends, in that consumption of soft drinks and fast food increased while that of fruits, vegetables, or milk decreased [2], and their preference for fast food or soft drinks led to nutritional imbalances [3]. These undesirable dietary habits affect the health status of adolescents.
Overweight and obesity in adolescents are serious health issues [4], and the prevalence of these disorders has increased rapidly around the world [5]. In addition, 70% of adolescents with obesity eventually become obese adults [6]. Pediatric obesity is also closely related to dyslipidemia or type 2 diabetes [7,8,9]. In a longitudinal study, obesity was shown to be strongly associated with cardiovascular risk factors in children and adolescents [10,11,12]. The pathological process of cardiovascular diseases (CVD) begins during childhood [13], and its risk factors include being overweight, abdominal obesity, hypertension, and glucose intolerance [13,14]. These features are defined as metabolic syndrome, and their presence has been associated with high risks for type 2 diabetes and CVD later in life [15].
Although there is currently no universally accepted definition for metabolic syndrome in adolescents, its prevalence is increasing. For example, the KNHANES on youth aged 10 to 18 years showed that the prevalence of metabolic syndrome increased from 4.0% in 1998 to 5.9% in 2001, 6.6% in 2005, and 7.8% in 2007 [16]. Recently, due to the arbitrary definitions of metabolic syndrome, several studies were conducted to structuralize the clustering phenomenon of the individual components of complex metabolic syndrome [17,18,19]. In these studies, three or four patterns of metabolic syndrome, including insulin resistance, obesity, dyslipidemia, and hypertension, were suggested. To more fully understand the etiology of metabolic syndrome, it is necessary to examine their relationships with metabolic syndrome risk factors.
Several studies have examined the association of dietary factors with metabolic syndrome or its risk factors in adolescents. A study from an Australian childhood cohort defined a 'high-risk cluster' by grouping individual metabolic abnormalities and observed a strong association between Western dietary patterns and a high-risk cluster in girls [20]. In a study on Korean adolescents, Kim et al. [21] reported positive associations of abdominal obesity, fasting glucose levels, and serum triglyceride levels with Western dietary patterns. Dietary patterns indicate the overall dietary quality of a population but do not provide information on the role of individual nutrients in metabolic disease.
Thus, this study aimed to cluster metabolic syndrome risk factors as well as their associations with dietary factors in adolescents using data from the Korean National Health and Nutrition Examination Survey.
SUBJECTS AND METHODS
Study population
The data in this study were obtained from Korean National Health and Nutrition Examination Surveys (KNHANES 2007-2010). Among 4,244 eligible adolescents aged 10-18 years, those who participated in both the health examination and dietary survey were selected (n = 3,490). We excluded those subjects who reported implausible energy intakes (< 500 or ≥5,000 kcal per day; n = 40) or showed missing values for blood or target variables (n = 492). A total of 2,958 subjects were analyzed in this study.
Clustering of metabolic syndrome risk factors
In this study, factor analysis was used to group six components of metabolic syndrome, including waist circumference, triglycerides, HDL-cholesterol, systolic and diastolic blood pressures, and fasting blood glucose levels. The identified patterns were considered and named according to the metabolic risk factors with higher factor loadings. Each subject was then categorized into quartiles by pattern score for each pattern.
Definition of metabolic syndrome for adolescents
The definition of metabolic syndrome in adolescents used in this study was adopted from the modified version of the National Cholesterol Education Program Adult Treatment Panel III (NCEP-ATPIII) [22]. Metabolic syndrome was diagnosed if more than three of the following five categories were satisfied: 1) waist circumference ≥90th percentile (based on gender-specific percentiles by age according to the Korean growth chart, 2007 [23]), 2) serum triglyceride level ≥110 mg/dL, 3) serum HDL-cholesterol level ≤40 mg/dL, 4) systolic or diastolic blood pressure ≥90th percentile (based on the normal blood pressure reference for Korean children and adolescents [24]), and 5) fasting blood glucose level ≥100 mg/dL.
Assessment of dietary intake
Information on dietary intake was obtained through 24-hour dietary recalls as part of the dietary survey. The nutrient intakes were compared across quartile groups for each identified pattern.
Measurements of other variables
In addition to metabolic syndrome components, pediatric obesity and insulin resistance were compared among quartiles for each pattern score. Pediatric obesity was defined using gender-specific BMI percentiles by age according to the Korean growth chart (2007): overweight (85-95th percentile) and obesity (> 95th percentile). Insulin resistance was defined using the homeostasis model assessment (HOMA), calculated as [fasting insulin (mU/mL) × fasting glucose (mmol/L)]/22.5.
Sociodemographic variables such as age, gender, household income, and physical activity were obtained from the questionnaire. Physical activity was defined as being moderately active using data on the frequency of moderate intensity exercise over the previous week.
Statistical analysis
All statistical analyses were conducted using SAS (Statistical Analysis System version 9.3, SAS Institute, Cary, NC, USA). For pattern analysis, factor analysis was performed using a varimax rotation (Proc Factor). Since the pattern analysis can be affected by differences in scales among indicators, the six risk factors of waist circumference, triglycerides, systolic and diastolic blood pressures, HDL-cholesterol, and fasting blood glucose were standardized prior to factor analysis. The number of factors was determined based on the eigenvalue, scree test, and interpretability of the derived factors [25]. The three patterns were identified and named according to the metabolic syndrome components with a factor loading greater than |0.4|. Each subject was categorized into quartiles by the pattern score for each pattern. General characteristics and nutrient intake were compared among pattern score quartiles.
All analyses accounted for the complex sampling design effect and appropriate sampling weights of the national survey. Demographic and biochemical variables across groups in each pattern were evaluated using the Rao-Scott chi-square test for categorical variables and GLM for continuous variables; both tests were performed using the PROC SURVEY procedure. Nutrient intakes across groups were analyzed by GLM using PROC SURVEYREG after adjusting for possible confounding variables. For the high blood pressure and dyslipidemia patterns, age, gender, and physical activity were adjusted, and for the glucose abnormality pattern, age and gender were adjusted. Adjusted means by group for each nutrient intake were analyzed using Bonferroni multiple comparison correction with alpha = 0.05.
RESULTS
Three distinct patterns of metabolic syndrome risk factors
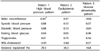
The individual risk factors for metabolic syndrome were grouped as three distinct patterns, and the factor loadings of each pattern are presented in Table 1. The first pattern was labeled the 'high blood pressure pattern' due to high loadings of systolic and diastolic blood pressures. The second pattern was the 'dyslipidemia pattern' due to high loadings of triglyceride and HDL-cholesterol levels. However, these two patterns shared modest loadings of waist circumference. The third pattern was labeled the 'glucose abnormality pattern' due to high loadings of fasting blood glucose levels.
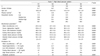
The general and biochemical characteristics of each pattern are presented in Tables 2, 3, 4. Metabolic syndrome risk factors showed different features according to pattern. For the high blood pressure pattern, all metabolic risk factors except serum triglycerides differed across the pattern score quartiles, as shown in Table 2. Among the variables, systolic and diastolic blood pressures and waist circumference markedly increased across the pattern score quartiles.
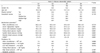
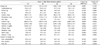
In the dyslipidemia pattern, all metabolic risk factors except for blood glucose differed significantly across pattern score quartiles, as shown in Table 3. Serum triglycerides, waist circumference, and systolic blood pressure markedly increased, whereas HDL-cholesterol decreased across quartiles. In the glucose abnormality pattern, all metabolic risk factors except for waist circumference differed significantly across quartiles, as shown in Table 4. In contrast with other patterns, waist circumference was not associated, and HDL-cholesterol slightly increased across quartiles.
The prevalence of metabolic syndrome or individual components showed different characteristics according to pattern. While subjects in the highest quartile of the high blood pressure pattern showed the highest prevalence of high blood pressure, those in the dyslipidemia pattern highest quartile showed the highest prevalence of hypertriglyceridemia and low HDL-cholesterol.
Regarding demographic variables, age, gender, and physical activity differed significantly across pattern score quartiles in the high blood pressure pattern and dyslipidemia pattern. Age was significantly associated, gender was marginally associated, and physical activity was not associated with the glucose abnormality pattern. Household income was not associated significantly with any of the three patterns.
Association of nutrient intake in the three distinct patterns
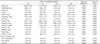
Nutrient intake across quartile groups in the blood pressure pattern is presented in Table 5. Carbohydrate intake and percentage of energy from carbohydrates differed significantly across quartiles after adjusting for all confounding factors, although there were no linear trends. Thiamin intake increased significantly across quartiles.
Nutrient intake across quartile groups in the dyslipidemia pattern is presented in Table 6. Energy, carbohydrate, protein, fat, calcium, phosphorus, sodium, and riboflavin intakes were significantly associated across quartiles after adjusting for all confounding factors. Among nutrients, fat and riboflavin intakes significantly decreased across quartiles, whereas sodium and niacin intakes significantly increased. The percentage of energy from fat also significantly decreased across quartiles.
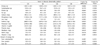
Nutrient intake across quartile groups for the glucose abnormality pattern is presented in Table 7. None of the nutrient intakes differed significantly across quartiles after adjusting for all confounding factors, although thiamin intake significantly increased across quartiles.
DISCUSSION
This study identified three distinct patterns among metabolic syndrome risk factors in a nationally representative sample of Korean adolescents and found that those patterns were differentially associated with nutrient intake. Among the three patterns, the dyslipidemia pattern was strongly associated with several nutrient intakes. No nutrient intake except for thiamin showed significant association with both the high blood pressure and glucose abnormality patterns.
We found that the six metabolic risk factors of interest were grouped into three distinct patterns characterized by their dominant traits. Although insulin resistance is considered to be an underlying factor, the mechanism causing metabolic syndrome is unclear. Kahn and colleagues [26] suggested more than one underlying factor in metabolic syndrome, which suggests a more complex etiology. Several studies have examined the structures of metabolic risk factors. Li and Ford [18] examined the construct validity of metabolic risk factors using confirmatory factor analysis and suggested that, among six components, waist circumference, triglycerides, fasting insulin, and systolic blood pressure are potentially useful phenotypic traits defined in adolescents. Huang and colleagues also conducted cluster analysis for metabolic syndrome in adults using metabolic risk factor cutoff values that were not applicable to children. They identified a high-risk group showing strong association with inflammatory markers, implying that even though metabolic syndrome shares common traits, dominant traits could lead to metabolic syndrome in a differential manner. Collectively, focusing on dominant traits and their associations with dietary factors would be more effective than focusing solely on metabolic syndrome, especially for adolescents whose biochemical parameters gradually increase.
In this study, we found that three distinct patterns were differentially associated with nutrient intake. Among the three patterns, the dyslipidemia pattern was strongly associated with several nutrient intakes. Interestingly, dietary fat intake decreased significantly across quartile groups. Many epidemiological studies reported that high saturated fat intake has adverse effects on metabolic syndrome, whereas high polyunsaturated fat intake has beneficial effects [27,28,29]. However, we could not examine the effects of different types of fatty acids on metabolic risk factors in this study due to the lack of a fatty acid nutrient database for Korean foods.
Even though the importance of dietary factors in the prevention of metabolic disease has been emphasized, only a few studies have actually investigated the associations between specific dietary factors and metabolic syndrome in adolescents. Dietary fiber has been reported to be positively associated with reduced risk of metabolic syndrome in American children and adolescents [30]. Higher overall healthy eating index and fruit intake are also associated with reduced risk of metabolic syndrome in American adolescents [31]. However, those studies did not report on the associations of individual components of metabolic syndrome.
In this study, several micronutrients such as calcium, phosphorus, sodium, riboflavin, and niacin were found to be significantly associated with the dyslipidemia pattern, whereas thiamin was associated with the blood pressure and glucose abnormalities patterns. There are only limited studies on the relationships between micronutrient intakes and metabolic syndrome or its components. Bakker et al. [32] reported that thiamin intake appears to have a strong and relevant association with glucose tolerance, which is in agreement with high thiamin intake in the glucose abnormalities pattern in this study. Regarding dyslipidemia, few studies have examined micronutrient intakes. Jacqmain et al. [33] reported that high calcium intake is associated with a plasma lipoprotein-lipid profile, including greater HDL cholesterol levels. Several recent studies on metabolic syndrome and micronutrient intakes reported an association between high sodium intake and metabolic syndrome in Chilean adults [34] and Korean females [35]. In addition, Beydown et al. [36] reported an inverse relationship between calcium, magnesium, and phosphorus intakes and metabolic disorders among US adults based on data from NHANES 1994-2004. To better understand the role of diet on the etiology of metabolic syndrome or its components, future studies should explore mechanisms underlying the associations between specific patterns of metabolic risk factors and dietary factors.
There were several limitations to this study. First, it was a cross-sectional study and thus no causal inferences could be drawn. Second, we obtained dietary intake information via a single 24-hour recall survey, which may not represent typical dietary intakes. However, we categorized subjects into quartiles according to their pattern scores and compared mean values among the groups. Finally, the definition of metabolic syndrome in children and adolescents has not been well established, awhich suggests misclassification is a concern. Nevertheless, this study is the first to characterize metabolic risk factors using factor analysis and to examine the associations between identified patterns and dietary factors in a large nationally representative adolescent sample.
The results of the present study suggest that individual risk factors for metabolic syndrome are characterized and differentially associated with dietary factors. Thus, dietary recommendations or strategies should be designed according to specific patterns. Future studies elucidating the underlying mechanisms of specific patterns can help clarify the role of diet in the development and prevention of metabolic syndrome in Korean adolescents.

 XML Download