Journal List > Nutr Res Pract > v.8(1) > 1051440

Lee, Park, and Kim: Factors associated with low water intake among South Korean adolescents - Korea National Health and Nutrition Examination Survey, 2007-2010

Abstract

Water is essential for life and plain water instead of sugar-sweetened beverages is one approach for decreasing energy intake. Due to limited data on characteristics associated with water intake among Korean adolescents, this study examined associations of demographic and behavioral characteristics with plain water intake by using nationally representative sample of South Korean adolescents. The data (2007-2010 Korea National Health and Nutrition Examination Survey) for 1,288 high school-aged adolescents (15-18 years) were used. Multivariable logistic regression was used to calculate adjusted odds ratios (OR) for factors associated with low water intake (< 4 cups/day) and very low water intake (< 2.5 cups/day). Nationwide, 38.4% and 19.0% of adolescents reported drinking water < 4.0 cups/day and < 2.5 cups/day, respectively. The mean plain water intake was 5.7 cups/day for males and 4.1 cups/day for females. Females had significantly higher odds for drinking water < 2.5 cups/day (OR = 2.2) than males, whereas adolescents with low milk consumption had significantly lower odds for drinking water < 2.5 cups/day (OR = 0.7). Factors significantly associated with a greater odds for drinking water < 4 cups/daywere being female (OR = 2.8) and not meeting physical activity recommendations (≥ 20 min/day on < 3 days/week) (OR = 1.6). Being underweight, overweight, and obese were significantly associated with reduced odds for drinking water < 4 cups/day (OR = 0.7, 0.4 and 0.5, respectively). However, intake of soda, coffee drinks, fruits, vegetables, and sodium and eating out were not significantly associated with low or very low water intake. These findings may be used to target intervention efforts to increase plain water intake as part of a healty lifestyle.

Introduction

Consuming water is essential for life and drinking water is zero-calorie, thirsty quenching beverage option. Consuming plain water can help weight management [1-4] and may prevent potential adverse consequences associated with sugar-sweetened beverage (SSB) intake, such as dental caries [5], obesity [6-9], and type 2 diabetes [10] if substituted for SSBs. Furthermore, previous studies suggested that low plain water intake was associated with other less desirable behaviors such as poor dietary quality and lifestyle [11,12]. Kant and Graubard reported that plain water intake was inversely associated with intake of total sugars among youth aged 2-19 years [12]. Most recently, Park and colleagues reported that factors significantly associated with low plain water intake were lower consumption of milk, fruits (including 100% fruit juice), and vegetables, higher consumption of non-diet soda and other SSBs, frequently using fast-food restaurants, and physical inactivity among US high school students [11].
Based on Korean Health Statistics in 2010, the highest consumers of sodas (both non-diet and diet) were adolescents (aged 12-18 years) compared to other age groups. Furthermore, the prevalence of obesity is higher in adolescents (12.7%) compared to youth under 12 years of age (9.6% for children aged 2-5 years and 8.8% for children aged 6-11 years) [13]. There is a growing concern regarding low physical activity among Korean high school-aged adolescents due to great emphasis on academic achievement. For example, most high schools in South Korea have replaced physical education class with other major classes, such as Math and English [14].
Unlike South Korea, efforts to promote plain water intake are increasing in the United States. For example, the US Department of Agriculture requires schools participating in the National School Lunch Program as of fall 2011 to make free potable water available to students where meals are served [15]. Although, drinking plain water is generally known as a part of healthy diet, plain water intake has received little attention in South Korea. The Korean National Health and Nutrition Examination Survey (KNHANES) has collected plain water consumption data since 2007. However, to our knowledge, no study has examined plain water consumption patterns among Korean youth. Therefore, to inform the development of efforts to promote water intake in South Korea, the purposes of this study were to explore plain water consumption and to examine whether low plain water intake is associated with other less healthful dietary and behavioral factors among Korean high school-aged adolescents (15-18 years). It was hypothesized that less healthful dietary practices and physical inactivity would be associated with low water intake.

Subjects and Methods

Sample and survey administration

This study was based on KNHANES data in 2007-2010. The KNHANES conducted by Korea Centers for Disease and Control (KCDC) is a sequential series of cross-sectional survey of the South Korea civilians, non-institutionalized individuals (aged ≥ 1 year) designed to obtain nationally representative estimates of health and dietary indicators [16]. The KNHANES was approved by the KCDC Institutional Review Board.The KNHANES consists of four different surveys: a health interview survey, a health behavior survey, a health examination survey, and a nutrition survey. The nutrition survey collects dietary intake data using 24-hr recall and food frequency questionnaire. The KNHANES collects data via household interview and direct physical examinations in mobile examination centers. The survey uses a stratified multistage probability sampling design and the samples for each year were independent of each other. Weights indicating the probability of being sampled were assigned to each respondent, enabling the results to represent the entire country. A total of 1,598 adolescents aged 15-18 years participated in the health behavior survey, 1,467 participated in the health examination survey, and 1,291 participated in the nutrition survey in 2007-2010. This cross-sectional study included 1,288 high school-aged adolescents who participated in the health examination study, health behavior survey, and the nutrition survey, including responses for plain water intake. Overall response rate for KNHAENS in 2007-2010 was 78.4%.

Outcome variable

The outcome of interest was plain water intake. Participants were asked "Usually, how many cups of plain water did you drink a day?"For χ2 tests, four mutually exclusive water intake categories were created; < 2.5, 2.5 to < 4, 4 to < 6, and ≥ 6 cups/day based on the data distribution (quartile). For logistic regression analysis, plain water intake was dichotomized into < 2.5 and ≥ 2.5 cups/day for Model 1 as well as < 4 and ≥ 4 cups/day for Model 2, using upper values for the first and second quartiles as cutoffs. For the purpose of this study, very low water was defined as plain water intake < 2.5 cups/day and low water intake was defined as plain water intake < 4 cups/day.

Exposure variables

Mutually exclusive response categories were created for each exposure variable. Demographic variables included were age (≤ 15, 16, 17 and ≥ 18 years) and sex. Height was measured with a stadiometer (SECA 225, Vogel & Halke, Hamburg, Germany), and body weight was measured on a balanced scale (GL-6000-20, CAS Korea, Seoul, Korea). Based on measured height and weight, the body mass index (BMI, kg/m2) was calculated and classified as underweight (< 5th percentile for BMI by age and sex), normal weight (≥ 5th to < 85th percentile), overweight (≥ 85th to < 95th percentile), and obese (≥ 95th percentile) based on age- and sex-specific reference data from the Korean growth charts [17]. Overall, Korean growth charts have similar curves to the US CDC growth charts, although the 95th and 50th percentiles for BMI are minimally higher in Korean growth chart than the US CDC growth chart [18]. Dietary intake variables included were milk (< 200 and ≥ 200 g/day), soda (both non-diet and diet; < 0 times/month, > 0 to < 1 time/month, ≥ 1 time/month to < 1 time/week and ≥ 1 time/week), coffee drinks (all types of coffee; < 0 times/month, > 0 to < 1 time/month, ≥ 1 time/month to < 1 time/week and ≥ 1 time/week), meeting fruit intake guideline for Koreans (yes or no), meeting vegetable intake guideline for Koreans (yes or no), and sodium intake (< 2,000 and ≥ 2,000 mg/day). For the soda question, participants were asked 'During the past 1 year, on average how often did you drink soda or carbonated beverages (e.g., cola, cider, or fruit-flavored carbonated beverages)?'. The Korean government recommends different daily intake (in servings) for each food group based on caloric intakes, age, and sex groups [19]. For example, dietary intake guidelines for adolescents are two servings of fruits per day and seven servings of vegetables per day. Sodium cut off points was based on the World Health Organization recommendation of 2,000 milligrams per capita per day [20,21]. Behavioral variables included being physically active at least 20 minutes/day during the past seven days (< 3 and ≥ 3 days/week) and frequency of eating out (< 1, 1, and > 1 time/day). For the eating out question, participants were asked 'During the past 1 year, on average how often did you eat out?'. The physical activity cut point was based on the KCDC guideline [22], and cut point for eating out was based on that used in previous studies [23, 24]. Only two exposure variables, soda and coffee drink intake, had missing data and 1.4% were missing for each; adolescents with missing data on these variables were excluded from analyses when the variable was used.

Statistical analysis

Chi-square tests were used to examine the previously described characteristics with plain water intake among high school-aged adolescents and P < 0.05 was used for statistical significance. Two multivariable logistic regression models were fit to estimate adjusted odds ratios (ORs) and 95% confidence intervals (CIs) for variables associated with very low and low plain water intake (< 2.5 cups/day and < 4 cups/day, respectively). All variables listed above were included in the multivariable logistic regression models (n = 1,270 without any missing data). Of note, there were no significant differences in age, sex, and weight status between adolescents who were included in the logistic regression models and those who were not included. Sample weights were applied to all analyses to provide nationally representative estimates. All statistical analyses were conducted using SAS (release 9.2; 2009, SAS Institute Inc, Cary, NC, USA) and incorporated appropriate procedures to account for the complex sample design.

Results

Characteristics of the study population and their associations with plain water intake among high school-aged adolescents

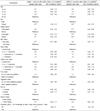
The final analytic sample was 1,288 adolescents. Overall, mean plain water intake was 5 cups/day (5.7 cups/day for males, 4.1 cups/day for females) (Fig. 1). Nationwide, 19.0% and 38.4% of the adolescents reported drinking water < 2.5 cups/day and < 4 cups/day, respectively (Table 1). Based on χ2 tests, plain water intake significantly differed by sex, weight status, vegetable intake, sodium intake, and physical activity. For example, the proportion of adolescents drinking plain water < 2.5 cups/day was highest among females, those who were normal weight, those who did not meet vegetable intake guidelines, those with lower sodium intake, and those who did not meet the physical activity recommendation (Table 1).

Adjusted odds ratios for variables associated with very low plain water intake among high school-aged adolescents

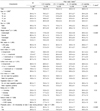
Based on multivariable logistic regression analysis, the odds for drinking water < 2.5 cups/day was significantly higher among females (OR = 2.2) but lower among those who consumed milk < 200 g/day (OR = 0.7; vs. ≥ 200 g/day). Factors significantly associated with greater odds for plain water intake < 4 cups/day were being female (OR = 2.8) and not meeting physical active recommendation (OR = 1.6). Compared to normal weight youth, being underweight, overweight, and obese were significantly associated with reduced odds for plain water intake < 4 cups/day (OR = 0.7, 0.4 and 0.5, respectively) (Table 2).

Discussion

Previous studies conducted in American adolescents, which showed that 54% of US high school students (grades 9 through 12) drank < 3 times/day of plain water [11] and 64% of Florida middle school students (grades 6 through 8) drank < 3 glasses/day of plain water [25]. However, our finding that the prevalence of low water intake (< 4 cups/day) among Korean high-school aged adolescents (15-18 years) was 38% cannot be directly compared to these studies because the definition of low water intake is different.
Mean plain water intake was 5.7 cups/day for boys and 4.1 cups/day for girls in the present study, and these were higher than those of US youth. Based on the 2005-2008 National Health and Nutrition Examination Survey (NHANES), mean plain water intake among US youth (aged 12 to 19 years) was 3.6 cups for boys and 3.1 cups for girls [26]. Additionally, females were twice as likely to be very low consumers and almost three times more likely to be low water consumers than males in the present study. However, this finding is inconsistent with previous studies, in which sex was not significantly associated with low water intake among US adolescents [11,25,26]. Further research is needed to find out why Korean female adolescents have lower water consumption than males.
Consistent with previous studies [11,26], overweight and obese adolescents in the present study were 60% and 50% less likely to be low water consumers compared with normal weight adolescents. Park and colleagues [11] noted that obese adolescents might try to limit energy intake from beverages by substituting plain water for SSBs, and this tactic is supported by evidence from two studies that found that those who were trying to lose weight were less likely to drink SSBs compared to students who were not trying to do anything about their weight [27,28]. Although the present study did not find a significant association between low water intake and high soda intake, plain water may play a role in decreasing energy intake when it is substituted for SSBs and possibly reducing the risk of obesity [2].
Only a few studies have examined possible associations between water intake and dietary or behavioral factors among youth [11,12,25]. Park and colleagues found that low water intake was significantly associated with other fluid intake from other beverage including low consumption of milk and 100% fruit juice, and high consumption of non-diet soda, and fruit-flavored drinks/sports drinks among Florida middle school students [25]. In the NHANES study, plain water intake was also inversely associated with intake of fluid from other beverages [12]. Inconsistent with previous studies [11,25], very low water intake was significantly inversely associated with low consumption of milk; however, low or very low water intake had no significant association with intake of other fluid including soda and coffee drinks among the Korean adolescents in the present study. It is possible that the Korean adolescents may replace plain water with milk. Drinking milk is very important, especially for adolescents, because milk provides key nutrients, such as calcium, vitamin D, and protein [29]. Therefore, considering different benefits of consuming plain water and milk, it may be important to provide nutrition education to adolescents about the benefits of healthier beverages such as water and milk.
In our study, lower water intake was associated with not meeting vegetable intake guideline based on unadjusted analysis, but it became insignificant after controlling for other factors. Although, the variables were slightly different than those used in the present study, Park and colleagues found that the strongest factor associated with low water intake was low vegetable intake among US high school students [11]. Also, results from NHANES showed that fiber intake was positively associated with plain water intake among US adolescents [12].
The finding from the present study regarding physical activity is consistent with previous studies. Kant and Graubard found that participation in physical activity was associated with higher water intake among US youth (aged 2-19 years) [12], and Park and colleagues reported that Florida adolescents who did not participate in team sports during the previous year were more likely to be low water consumers compared to those who participated in at least three team sports [25]. It is not surprising that participation in physical activity and sports would lead to higher water consumption because of thirst and need for hydration. The American Academy of Pediatrics recommends that physically active adolescents drink plain water for their hydration with the exception of athletes with prolonged, vigorous sports or intense physical activity who may need more rapid replenishment of carbohydrates and/or electrolytes [30].
The major strengths of this study are that it is based on a large, nationally representative sample, it had very small amount of missing data on only two exposure variables, and it had measured weight and height from which obesity status could be ascertained. However, this study is subject to limitations. First, KNHANES data are self-reported except for height and weight, and the extent of under reporting or over reporting of beverage consumption cannot be determined. Second, the associations are cross-sectional, so causality and directionality of these cannot be determined. Last, this study included only limited beverage items which were included in KNHANES food frequency questionnaires; therefore, they are not representative of all beverages that might be associated with water consumption in this age group.
In conclusion, nationwide in South Korea, mean plain water intake was 5.7 cups/day for males and 4.1 cups/day for females. About 1 in 5 15-18 year-olds reported drinking less than 2.5 cups of water per day and about 2 in 5 adolescents reported drinking less than 4 cups of water per day. Furthermore, odds for drinking < 2.5 cups of water/day was significantly higher among females, but lower among low-milk consumers. Factors significantly associated with a greater odds for drinking < 4 cups of water/day were being female and not meeting physical activity recommendations. Being underweight, overweight, and obese were significantly associated with reduced odds for plain water intake < 4 cups/day. Our findings may be used to tailor intervention efforts to increase plain water intake as part of a healthy lifestyle among Korean adolescents.

Figures and Tables

Fig. 1
Mean plain water intake is presented as cups per day. *P < 0.05
nrp-8-74-g001
Table 1
Characteristics of the study population and their associations with plain water intake among high school-aged adolescents in South Korea-Korean National Health and Nutrition Examination Survey, 2007-2010
nrp-8-74-i001

1)The question asked was, "Usually, how many cups of plain water did you drink a day?".

2)χ2 tests were used for each variable to examine differences across categories.

3)Because of rounding, weighted percentages may not add up to 100%.

4)Unweighted sample size.

5)Measured weight and height were used to calculate body mass index (BMI). Underweight was defined as BMI < 5th percentile; normal weight was defined as BMI ≥ 5th to < 85th percentile; overweight was defined as BMI ≥ 85th to < 95th percentile; and obesity was defined as BMI ≥ 95th percentile based on age- and sex-specific reference data from the Korean growth charts.

Table 2
Adjusted odds ratios for variables associated with very low plain water intake1)(< 2.5 cups/day) and low plain water intake (< 4 cups/day) among high school-aged adolescents in South Korea - Korean National Health and Nutrition Examination Survey, 2007-2010 (n = 1,270)
nrp-8-74-i002

1)The question asked was, "Usually, how many cups of plain water did you drink a day?".

2)Model 1 included all variables of study. Reference category included adolescents who drank ≥ 2.5 cups of plain water/day.

3)Model 2 included all variables of study. Reference category included adolescents who drank ≥ 4 cups of plain water/day.

4)Significant finding based on the 95% CI (ie, the CI does not include 1).

5)Measured weight and height were used to calculate body mass index (BMI). Underweight was defined as BMI < 5th percentile; normal weight was defined as BMI ≥ 5th to < 85th percentile; overweight was defined as BMI ≥ 85th to < 95th percentile; and obesity was defined as BMI ≥ 95th percentile based on age- and sex-specific reference data from the Korean growth chart.

Notes

The findings and conclusions in this report are those of the authors and do not necessarily represent the official position of the Centers for Disease Control and Prevention.

References

1. Muckelbauer R, Libuda L, Clausen K, Toschke AM, Reinehr T, Kersting M. Promotion and provision of drinking water in schools for overweight prevention: randomized, controlled cluster trial. Pediatrics. 2009; 123:e661–e667.
crossref
2. Daniels MC, Popkin BM. Impact of water intake on energy intake and weight status: a systematic review. Nutr Rev. 2010; 68:505–521.
crossref
3. Wang YC, Ludwig DS, Sonneville K, Gortmaker SL. Impact of change in sweetened caloric beverage consumption on energy intake among children and adolescents. Arch Pediatr Adolesc Med. 2009; 163:336–343.
crossref
4. Tate DF, Turner-McGrievy G, Lyons E, Stevens J, Erickson K, Polzien K, Diamond M, Wang X, Popkin B. Replacing caloric beverages with water or diet beverages for weight loss in adults: main results of the Choose Healthy Options Consciously Everyday (CHOICE) randomized clinical trial. Am J Clin Nutr. 2012; 95:555–563.
crossref
5. Armfield JM, Spencer AJ, Roberts-Thomson KF, Plastow K. Water fluoridation and the association of sugar-sweetened beverage consumption and dental caries in Australian children. Am J Public Health. 2013; 103:494–500.
crossref
6. Ludwig DS, Peterson KE, Gortmaker SL. Relation between consumption of sugar-sweetened drinks and childhood obesity: a prospective, observational analysis. Lancet. 2001; 357:505–508.
crossref
7. Ebbeling CB, Feldman HA, Chomitz VR, Antonelli TA, Gortmaker SL, Osganian SK, Ludwig DS. A randomized trial of sugar-sweetened beverages and adolescent body weight. N Engl J Med. 2012; 367:1407–1416.
crossref
8. Malik VS, Schulze MB, Hu FB. Intake of sugar-sweetened beverages and weight gain: a systematic review. Am J Clin Nutr. 2006; 84:274–288.
crossref
9. de Ruyter JC, Olthof MR, Seidell JC, Katan MB. A trial of sugar-free or sugar-sweetened beverages and body weight in children. N Engl J Med. 2012; 367:1397–1406.
crossref
10. Malik VS, Popkin BM, Bray GA, Després JP, Willett WC, Hu FB. Sugar-sweetened beverages and risk of metabolic syndrome and type 2 diabetes: a meta-analysis. Diabetes Care. 2010; 33:2477–2483.
crossref
11. Park S, Blanck HM, Sherry B, Brener N, O'Toole T. Factors associated with low water intake among US high school students - National Youth Physical Activity and Nutrition Study, 2010. J Acad Nutr Diet. 2012; 112:1421–1427.
crossref
12. Kant AK, Graubard BI. Contributors of water intake in US children and adolescents: associations with dietary and meal characteristics-- National Health and Nutrition Examination Survey 2005-2006. Am J Clin Nutr. 2010; 92:887–896.
crossref
13. Ministry of Health and Welfare, Korea Centers for Disease Control and Prevention. Korea Health Statistics 2010: Korea National Health and Nutrition Examination Survey (KNHANES V-1). Cheongwon: Korea Centers for Disease Control and Prevention;2011.
14. Park MK. The current state of the school athletic, and policy challenges. Sport Sci. 2009; 9:2–10.
15. United States Department of Agriculture, Food and Nutrition Service (US). Healthy Hunger-Free Kids Act of 2010 [Internet]. Alexandria (VA): Food and Nutrition Service;2012. cited 2012 Dec 31. Available from: http://www.fns.usda.gov/cnd/Governance/Legislation/CNR_2010.htm.
16. Ministry of Health and Welfare, Korea Centers for Disease Control and Prevention. Korea National Health and Nutrition Examination Survey [Internet]. Cheongwon: Korea Centers for Disease Control and Prevention;2012. cited 2012 Dec. Available from: https://knhanes.cdc.go.kr/knhanes.
17. Moon JS, Lee SY, Nam CM, Choi JM, Choe BK, Seo JW, Oh K, Jang MJ, Hwang SS, Yoo MH, Kim YT, Lee CG. 2007 Korean National Growth Charts: review of developmental process and an outlook. Korean J Pediatr. 2008; 51:1–25.
crossref
18. Korea Centers for Disease Control and Prevention. Korean Pediatric Society. Establishing Commission for Growth Curve of Children and Adolescents. 2007 Korean National Growth Charts: Commentary [Internet]. Cheongwon: Korea Centers for Disease Control and Prevention;2007. cited 2012 Dec 31. Available from: http://www.cdc.go.kr/CDC/notice/CdcKrTogether0302.jsp?menuIds=HOME001-MNU0004-MNU0085-MNU0088&cid=9838.
19. The Korean Nutrition Society. Dieatry Reference Intakes for Koreans 2010. Seoul: The Korean Nutrition Society;2010.
20. World Health Organization (CH). Food and Agriculture Organization (US). WHO Technical Report Series 916. Diet, Nutrition and the Prevention of Chronic Diseases. Report of a Joint WHO/FAO Expert Consultation. Geneva: World Health Organization;2003.
21. World Health Organization (CH). Review and Updating of Current WHO Recommendations on Salt/Sodium and Potassium Consumption. Geneva: World Health Organization;2011.
22. Ministry of Health and Welfare, Korea Centers for Disease Control and Prevention. Analysis Guideline for Korea National Health and Nutrition Examination Survey. Cheongwon: Korea Centers for Disease Control and Prevention;2011.
23. Centers for Disease Control and Prevention (CDC). Beverage consumption among high school students --- United States, 2010. MMWR Morb Mortal Wkly Rep. 2011; 60:778–780.
24. Park S, Blanck HM, Sherry B, Brener N, O'Toole T. Factors associated with sugar-sweetened beverage intake among United States high school students. J Nutr. 2012; 142:306–312.
crossref
25. Park S, Sherry B, O'Toole T, Huang Y. Factors associated with low drinking water intake among adolescents: the Florida Youth Physical Activity and Nutrition Survey, 2007. J Am Diet Assoc. 2011; 111:1211–1217.
crossref
26. Sebastian RS, Wilkinson Enns C, Goldman JD. Drinking Water Intake in the U.S.: What We Eat In America, NHANES 2005-2008. Washington, D.C.: Agricultural Research Service;2011. cited 2012 Dec 31. Available from: http://ars.usda.gov/SP2UserFiles/Place/12355000/pdf/DBrief/7_water_intakes_0508.pdf.
27. Park S, Sherry B, Foti K, Blanck HM. Self-reported academic grades and other correlates of sugar-sweetened soda intake among US adolescents. J Acad Nutr Diet. 2012; 112:125–131.
crossref
28. Isasi CR, Soroudi N, Wylie-Rosett J. Youth WAVE Screener: addressing weight-related behaviors with school-age children. Diabetes Educ. 2006; 32:415–422.
29. Rural Development Administration (KR). The Food Composition Table in Korea. 7th ed. Suwon: Rural Development Administration;2006.
30. Committee on Nutrition and the Council on Sports Medicine and Fitness. Sports drinks and energy drinks for children and adolescents: are they appropriate? Pediatrics. 2011; 127:1182–1189.
TOOLS
ORCID iDs

Sohyun Park
https://orcid.org/http://orcid.org/0000-0002-8192-7048

Mi-Hyun Kim
https://orcid.org/http://orcid.org/0000-0003-1828-0955

Similar articles