

 PDF
PDF ePub
ePub Citation
 Print
Print


INTRODUCTION
Obesity has become a pandemic and leads to many health problems, such as metabolic syndrome; Korean young adults also face the challenges of obesity. According to the Korean National Health and Nutrition Examination Survey conducted in 2010 [1], the prevalence of obesity was 20.5% in those aged between 19 and 29 years and 31.0% among those in their 30s.
Nelson et al. [2] noted that young adults, particularly those aged between 18 and 25, were vulnerable to obesity due to dramatic lifestyle changes, such as living alone, reduced physical activity, and declines in overall diet quality. Obesity at a young age may lead to serious health problems with advancing age. Young people with a higher body mass index (BMI) have a significantly higher risk for coronary heart disease than their slender counterparts, and the risk for coronary heart disease increases by 3.3% for women and by 3.6% for men for every 1% increase in BMI above the desirable level [3]. In light of these statistics, weight control could be more vital in the earlier stages of life for the prevention and management of metabolic syndrome [4].
Among the various weight management strategies, behavioral modification has been highlighted as a healthy and effective weight loss method because it can lead to overall changes in lifestyle. Milsom et al. [5] reported that 110 obese women aged 50 to 75 lost an average of 10.2% of initial weight through a 6-month lifestyle intervention using a 500-1,000 kcal deficit diet and individual counseling. After a 1-year lifestyle modification with a diet of 1,200-1,500 kcal per day and group education, a total of 55 middle-aged obese subjects had an average weight loss of 6.7 kg [6]. A 24-month intervention that provided group education and individual counseling sessions led to an average weight reduction of 5.1 kg in 138 middle-aged obese patients with at least one cardiovascular disease risk factor [7].
However, studies that have investigated the overall impact of behavioral modification on clinical characteristics and dietary intake among young obese subjects are relatively limited. It has been reported that subjects under 40 years of age and those without obesity-related complications were more likely to drop out from weight loss interventions [8,9,10,11]. These results indicate that young obese subjects might be less motivated. Weight-loss interventions often result in a wide range of weight-loss achievements even within the same study group [10]. Therefore, understanding key factors that contribute to better compliance and successful weight loss would help develop strategies for more effective weight-loss interventions.
In this study, we investigated the effect of a 12-week weight management program with behavioral modification on the clinical characteristics and dietary intakes of young and otherwise healthy obese adults. The program included dietary and physical activity aspects, intensive group education, and individual counseling sessions for effective behavioral modification. We tried to identify the traits of those who lost more weight to identify the key factors leading to a successful weight loss.
SUBJECTS AND METHODS
Subjects
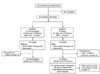
The study was conducted from September 2009 to June 2011. One hundred fifty-four subjects aged 19 to 45 years were screened using questionnaires, and 86 subjects were excluded from the study (Fig. 1). Subjects who were taking dietary supplements or medications known to affect serum lipid profiles were excluded from the study. Subjects with a high Beck Depression Inventory (BDI) score or any chronic disease, including endocrine, hepatic, renal, thyroid, or cardiac dysfunction, were also excluded from the study. Subjects who did not submit a 3-day dietary record at baseline were excluded from the study as well.
Forty-seven subjects with a BMI over 25 kg/m2 were recruited into the obese group, and 21 subjects with a BMI between 18.5 and 23 kg/m2 were recruited into the normal weight group. Of these, 63 subjects (44 obese and 19 normal weights) completed the study, and 59 subjects (40 obese and 19 normal weights) with complete dietary record data were included in the dietary intake analysis.
The protocol was approved by the Seoul National University Institutional Review Board (SNUIRB, IRB No. 0908/001-007), and written informed consent was obtained from all subjects.
The 12-week weight management program
At baseline, all subjects received information about the aims and schedule of the study. The 12-week weight management program included 5 group education sessions and 6 individual counseling sessions (baseline and week 2, 4, 6, 10, and 12) to induce dietary and behavioral modification in the obese subjects. Subjects in the normal weight group attended 6 individual counseling sessions to evaluate their dietary intake and exercise patterns and were asked to keep their usual eating and exercise pattern to maintain body weight.
The topics of the group education sessions for the obese subjects were as follows: 1) planning for weight loss and how to write dietary records (baseline); 2) how to lose weight in a healthy way (week 2); 3) understanding the food exchange system and food labeling (week 4); 4) portion size control (week 6); and 5) strategies to maintain weight loss (week 12). During the individual counseling sessions, a registered dietitian evaluated 3-day dietary records and reinforced the incorporation of low-fat, low-sugar, low-salt, high-fiber, and low-energy diets. The obese subjects were also encouraged to exercise regularly and to modify undesirable eating behaviors, such as late-night snacking or binge eating.
The overall weight reduction goal was to lose about 0.5 kg per week by reducing calorie intake by 300-500 kcal per day from the estimated energy requirements and increasing physical activity. Mean recommended energy intakes for weight loss were 1,715 kcal/d for obese men and 1,390 kcal/d for obese women. A personalized goal was set for each obese subject following an individual interview with a registered dietitian at baseline. The food exchange system from the Korean Diabetic Association was used for meal planning. Recommended servings of each food group based on caloric goals and the amount of carbohydrate, protein, and fat were provided to each subject. On average, energy from carbohydrate, protein, and fat were 60%, 21% and 19%, respectively, in the individual plans. This recommendation was within the acceptable macronutrient distribution ranges (AMDR) for Koreans, in which carbohydrate comprises 55-70%, fat comprises 15-25%, and protein comprises 7-20% of the total calorie intake.
Anthropometric and blood pressure measurement
Body weight, waist and hip circumferences, and fat mass were measured using InBody 520 (Biospace, Korea). Standing height without shoes was measured using a stadiometer. BMI and waist-to-hip ratio (WHR) were calculated from the height and body weight and waist and hip circumferences, respectively. Blood pressure was measured using an automatic blood pressure monitor (Jawon Medical, Korea) after subjects rested for more than 10 minutes.
Biochemical analysis
Blood was collected in serum separator tubes (BD vacutainer® SST, Becton Dickinson, Flanklin Lakes, NJ) after a 12-hour fast. The serum was separated by centrifugation and stored at -70℃ until analysis. Blood glucose, total cholesterol, HDL cholesterol, and triglyceride concentrations were measured using Cobas Integra® 400 plus (Roche, Switzerland). LDL cholesterol was measured by elimination and an enzymatic assay (Green Cross Reference Lab, Korea). Nonesterified fatty acids (free fatty acids, FFA) in serum were measured using SICDIA NEFAZYME (Shinyang Chemical Co., Ltd., Korea). Serum leptin and high-molecularweight-adiponectin (HMW-adiponectin) concentrations were determined using ELISA kits (Millipore, Billerica, MA) according to the manufacturer's instructions. The HMW-adiponectin was measured after the pretreatment of serum samples with digestion solution to remove hexameric and trimeric adiponectins.
Dietary Intake Assessment
All subjects were asked to provide 3-day dietary records (2 weekdays and 1 weekend day) at baseline, 2-, 4-, 6-, 10-, and 12-week time points. The intake and amount of food consumed was confirmed with individual interviews using pictures of the food in actual size. Analysis of nutrient intake was conducted using CAN-Pro 3.0, a nutritional analysis program developed by the Korean Nutrition Society. To evaluate changes in dietary intake, 3-day dietary records at baseline and week 12 were used. An average of the 3-day dietary intake was used as the daily intake of each subject.
Analysis of information from individual counseling
Information regarding exercise patterns, weight change history, family history of obesity and chronic diseases, goal weight, and weight control experiences of the subjects were collected through individual counseling. According to the weight change history, subjects who became obese after high school graduation were classified as having adult obesity.
Statistical analysis
Data were analyzed using SPSS software (version 19.0; SPSS Inc., Chicago, IL). Variables were examined for normality, and values that were not normally distributed were analyzed using non-parametric tests. Baseline characteristics, except dietary intake, were compared between the normal weight and obese groups using Student's t-test; baseline dietary intakes were tested using a 2-way ANOVA to evaluate the effects of sex and weight group.
To determine the effects of the 12-week program on anthropometric and clinical characteristics among obese subjects, subjects were divided into three subgroups based on the magnitude of weight loss: weight loss < 3 kg (< 50% of goal achievement), weight loss 3-6 kg (50-100%), and weight loss > 6 kg (> 100%).
To test for changes in anthropometric and clinical characteristics and dietary intakes before and after the program, the paired t-test or Wilcoxon's signed-rank test was used. To identify key factors for successful weight loss, the chi-square test was used for categorical variables and the Student's t-test was used for continuous variables of obese subgroups. Data are reported as the mean ± standard error. Significance was set at P < 0.05.
RESULTS
Changes in anthropometric characteristics after 12-week program participation
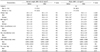
The mean age of the normal weight group was 26.4 years, and that of the obese group was 30.5 years. Although we tried to match demographic characteristics other than BMI between the two groups, subjects in the obese group were older than those in the normal weight group. However, most of the normal weight and obese subjects were in their 20s. The heights of the obese and normal weight groups were similar for both men (174.2 ± 1.7 cm in obese vs. 174.0 ± 0.7 cm in normal weight) and women (160.7 ± 1.4 cm in obese vs. 162.3 ± 1.1 cm in normal weight). The weight and BMI of the obese group were significantly higher than those of the normal weight group as subjects were assigned to the groups according to their BMI (Table 1). The waist circumference of the obese group was also significantly higher than that of the normal weight group.
Body weight, BMI, waist circumference, WHR, and body fat mass decreased significantly in the obese group after program participation. In the normal weight group, there was no significant change in weight, BMI, waist circumference, hip circumference, or fat mass during the 12-week period.
Changes in clinical characteristics after 12-week program participation
A comparison of clinical characteristics before and after the 12-week program is shown in Table 2. The obese group had significantly higher total cholesterol, LDL cholesterol, and triglyceride concentrations and systolic and diastolic blood pressures than those of the normal weight group at baseline. HDL cholesterol concentration was significantly lower in the obese subjects than the normal weight subjects at baseline. There was no significant difference in fasting blood glucose between the two groups.
After 12 weeks, significant decreases in serum triglyceride and free fatty acid (FFA) concentrations were observed in the obese group. Diastolic blood pressure tended to decrease (P = 0.066), and HDL cholesterol tended to increase (P = 0.061) in the obese group.
There was no significant change in LDL cholesterol in either the normal weight or obese groups at the 12-week time point. However, the large weight loss group (> 6 kg loss) showed a significant decrease in LDL cholesterol (from 128.3 ± 5.2 to 108.2 ± 10.6 mg/dL, P = 0.029). Similarly, while the change in blood glucose concentration was not significant in the obese group, a significant decrease in blood glucose concentration was observed in the large weight loss group (from 103.5 ± 6.6 to 90.0 ± 4.5 mg/dL, P = 0.027).
Obese subjects had significantly higher baseline serum leptin compared with normal weight subjects, and significant decreases in serum leptin concentrations in the intermediate (from 6.45 ± 0.94 to 4.76 ± 1.03 ng/mL, P = 0.017) and large weight loss groups (from 8.16 ± 3.43 to 4.45 ± 2.22 ng/mL, P = 0.046) were observed after program participation. Serum leptin concentrations in the normal weight group increased significantly despite no significant weight change in the normal weight group. Serum high-molecular-weight (HMW)-adiponectin concentrations at baseline were not different between the two groups and did not change with weight loss.
Comparison of dietary intakes before and after 12-week program participation
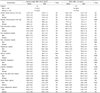
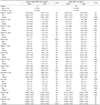
Energy, macronutrients, and cholesterol intakes were estimated by 3-day dietary records (Table 3). There was a significant decrease in dietary intakes of energy, fat, and cholesterol in the obese group after program participation. A significant decrease in percent energy from fat and a tendency towards decreased animal fat intake (P = 0.069) in the obese group were also observed. The decline in cholesterol intake was significant in all obese subgroups (data not shown). Carbohydrate and protein intakes of the obese group did not change significantly with program participation.
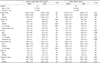
Dietary vitamin and mineral intakes assessed by 3-day dietary records are presented in Table 4. At baseline, obese subjects consumed significantly higher amounts of vitamin B2, B6, niacin, phosphorus, and sodium than did normal weight subjects.
Significant decreases in phosphorus and sodium intakes were observed in the obese group after program participation. The obese group showed a tendency of increased vitamin C intake (P = 0.071) after program participation. While vitamin B2, vitamin E, and zinc intakes decreased significantly in the obese group after the 12-week program, the intake levels still met Dietary Reference Intakes for Koreans (KDRIs; data not shown).
Comparison of obese subgroups divided according to weight loss magnitude
To identify factors for successful weight loss, we compared the characteristics of obese subgroups. Because all subjects in the large weight loss group (> 6 kg loss; > 100% of goal achievement) became obese in adulthood, participated in every individual counseling session, and submitted all 3-day dietary records, a statistical analysis between the large and small weight loss group was impossible for these values. Therefore, we compared the small weight loss group (< 3 kg loss; < 50% of goal achievement) with the intermediate and large weight loss groups combined (≥ 3 kg loss).
Subjects in the intermediate and large weight loss group were more diligent in submitting 3-day dietary records than those in the small weight loss group (4.9 / 5.0 vs. 4.3 / 5.0, respectively, P = 0.008; average of actual number of submissions/ number of submissions requested). In addition, those in the intermediate and large weight loss group tended to attend individual counseling more often than those in the small weight loss group (4.9 / 5.0 vs. 4.7 / 5.0, respectively, P = 0.074).
The proportion of subjects who became obese after graduating high school was significantly higher in the intermediate and large weight loss group than that in the small weight loss group (93.7% vs. 46.4%, respectively, P = 0.003).
DISCUSSION
In this study, we examined the effect of a 12-week weight management program with group education and individual counseling sessions on clinical characteristics and dietary intakes in young obese but otherwise healthy adults; most of the subjects were in their 20s. Obese subjects lost an average of 2.7 kg (i.e., 3.3% of body weight), and BMI, waist and hip circumferences, WHR, and fat mass decreased after program participation. While the magnitude of weight loss seemed somewhat modest compared to the goal (> 6 kg loss), it was similar to what has been reported in previous studies [6,13]. In addition, 36% of obese subjects lost more than 3 kg (average loss of 5.5 kg and 6.6% of initial body weight).
Significant improvement in lipid profiles of the obese group, a decrease in triglyceride and FFA, was observed despite a modest weight loss. A significant decrease in serum glucose was observed only in the large weight loss group (> 6 kg loss). These results are consistent with previous studies. Lang et al. [12] reported that a 3.2% reduction in body weight through an 8-week program with exercise and nutrition education did not lead to a reduction in serum fasting glucose concentrations despite observed improvements in blood lipid profiles. Dansinger et al. [13] showed that a 2-month calorie restriction resulted in 3.5 kg of weight loss and a reduction in cardiac risk factors but no change in glucose concentrations. It seems that lipid profiles are more sensitive to modest weight loss than blood glucose concentration.
Leptin and adiponectin are adipose tissue-specific proteins, and obese people are reported to have higher leptin and lower adiponectin concentrations [14,15]. In the present study, serum leptin in the obese group decreased significantly in both intermediate (5.0% weight loss) and large weight loss groups (9.1% weight loss). This is consistent with the finding that at least 5% weight loss is required to decrease leptin concentrations in obese people [15,16]. On the contrary, serum HMW-adiponectin concentration at baseline was not different between the obese and normal groups, which is inconsistent with findings from other studies [12,15]. However, the finding by Kuo et al. [17] that there was no significant correlation between plasma adiponectin and BMI in a healthy population is consistent with the results observed in this study. No change in serum HMW-adiponectin concentration following weight loss might indicate that adiponectin is less responsive than leptin to a moderate weight reduction. Elisabet et al. [18] also reported that 10-week hypoenergetic (-600 kcal/day) diets in obese but otherwise healthy subjects led to a significant reduction in leptin secretion but no significant change in adiponectin concentration with 7.5% weight loss.
It seems that a significant reduction in energy and fat intakes contributed to weight loss in the obese group in this study. In addition, a significantly positive correlation between changes in percent calories from animal fat and BMI was observed in the obese group (r = 0.325, P = 0.041), which is consistent with the results from the study by Alison et al. [19]. The percent of calories from animal fat showed a positive association with weight gain in 41,518 women in the Nurses' Health study. Obese subjects appeared to reduce animal based food intake during weight management program participation because significant decreases in cholesterol and sodium were observed. This may be the effect of nutrition education: in a study conducted by Dansinger et al. [13], obese subjects who were asked to maintain a restricted caloric intake (1,200-1,600 kcal) and received group education reduced intake by an average of 244 kcal per day and reduced intakes of carbohydrate, total and saturated fat, and cholesterol. Considering the positive association between fat intake and blood lipid profile, including triglyceride and cholesterol levels, the improvements in lipid profiles could be attributed to reduced fat intake, which was the main dietetic strategy in the 12-week education program. Decreased phosphorus intake might be explained by the reduced intake of processed foods and animal protein by the obese subjects, given that processed foods and animal protein usually contain high quantities of phosphorus. In addition, a significant decrease in sodium intake and a tendency towards increased vitamin C intake were observed in the obese subjects. Therefore, the 12-week program with nutrition education and personalized nutrition guidance in this study appeared to help obese subjects incorporate healthier eating patterns, as evidenced by reduced sodium and phosphorus intake and increased vitamin C intake.
Subjects who lost more than 6 kg participated more actively in the program than subjects who lost less than 3 kg. Higher attendance at individual counseling sessions and more diligent submission of dietary records have been reported to result in more successful weight loss and better clinical outcomes [20]. Given that participation can mediate the relationship between autonomous motivation and weight loss [21], those who lost more weight may have been more motivated. Significantly more frequent submission of dietary records in those who lost more weight was observed (P = 0.008), and attendance at the scheduled individual counseling sessions tended to be higher (P = 0.074). In light of these results, the submission of 3-day dietary records seemed to be a more sensitive indicator of autonomous motivation than attendance because keeping a dietary record likely plays a role in self-monitoring [22], the centerpiece of behavioral modification for weight loss, by helping with self-assessment and providing evaluative information [23,24,25].
The age of obesity onset has been reported as a predictor of dropout [9] rather than as a key factor for successful weight loss. However, we identified the age subjects became obese as a key factor for successful weight loss; in this study, those who became obese after high school graduation achieved more successful weight loss compared with those who were obese during childhood despite no difference in the family history of being overweight. This result may be because those who have been obese since childhood are more likely to have deeply rooted behavioral factors related to weight gain, such as specific dietary patterns. In a study by Dunn et al. [26], of young adults in the highest or lowest intake quintiles for 13 nutrients at baseline, over 60% of the subjects remained in the same or adjacent quintiles after 7 years, which indicates that people tend to maintain their dietary habits.
There are some limitations to this study. The mean age of the obese group was significantly higher than that of the normal weight group, although we tried to match for factors other than BMI between the two groups. Additionally, the extrapolation of our results to a more heterogeneous population might be limited because the subjects included in our study were highly educated and comprised a fairly homogenous population.
In conclusion, the 12-week weight management program led to significant improvements in anthropometric and clinical characteristics, which seemed to be due to significant decreases in energy and fat intakes. Although obese subjects in this study were young and otherwise healthy, moderate weight loss resulted in beneficial effects on metabolic risk factors such as high triglyceride and FFA concentrations.
 XML Download