Journal List > Nutr Res Pract > v.8(2) > 1051362

Lim, Lee, Park, Kim, Joh, and Oh: Weight misperception and its association with dieting methods and eating behaviors in South Korean adolescents

Abstract

BACKGROUND/OBJECTIVES

There is little information on the association between weight misperception and eating behavior in Korean adolescents. Therefore, we investigated the association of food intake habits and dieting method and disturbed eating behavior (DEB) in relation to weight misperception.

SUBJECTS/METHODS

Data was collected by using a nationwide online panel survey from 6,943 adolescents enrolled in middle/high school. DEB was measured with the Eating Attitudes Test (EAT-26) and those who scored ≥ 20 on the EAT-26 were considered to have eating disorder. Logistic regressions were conducted to examine the association between weight misperception based on self-reported weight status and dieting method and eating behaviors.

RESULTS

The proportion of weight underestimation was 23.5% and that of overestimation was 24.0%. Weight overestimating girls were more likely to engage in various unhealthy dieting practices (OR = 1.69 for fasting; OR = 1.88 for laxative or diuretic use; OR = 2.05 for self-induced vomiting after meals; P < 0.05). Moreover, there was a strong association between overestimation and undesirable eating behaviors, especially among girls, e.g.: having breakfast (OR = 0.85), high consumption of fast foods (OR = 1.28) and regular sodas (OR = 1.39), but not among boys. In both genders, weight overestimation appears to be a major risk factor for DEB (OR = 1.34 for boys and OR = 1.41 for girls; P < 0.05).

CONSLUSIONS

Weight overestimation is associated with unhealthy weight control practices and eating behaviors. We particularly found a significant association between weight overestimation and DEB among nationwide Korean adolescents.

INTRODUCTION

Weight-related health concerns among adolescents have been increasing over the past two decades in Western countries [1]. In particular, weight misperception is a significant concern in both developed and developing countries [2,3,4]. Weight misperception among adolescents is affected by various factors including their socio-demographic and environmental characteristics (e.g.: age, gender, ethnicity, location of residence, household income, peer weight norms, and parental perceptions of their children's weight status) [4,5,6,7,8,9,10,11] and is shown to be associated with disturbed eating behaviors (DEB) and unhealthy weight control practices, such as fasting, self-induced vomiting, or using diet pills [12,13].
Weight misperception is also becoming a prevalent concern among adolescents in East Asian countries. Previous studies suggested that adolescents in East Asian countries tend to overestimate their weight at a similar or higher level than those in Western countries with a higher prevalence of obesity [2,3,14]. About 23% of adolescent girls in the U.S. reportedly had weight misperceptions in 2007 [15]. The prevalence of weight misperceptions in Asian countries, as reported in the literature, ranges between 16.3% and 87.0% and varies depending on age, gender, and ethnicity composition of the study population [11,16,17]. In particular, some developing Asian countries have become beauty-oriented societies where people are judged more for their appearance than other personal traits. In addition, cultural beliefs and beauty ideals are changing the norms with ever-increasing peer pressure on adolescents [2,3].
However, studies on weight misperception and its relationship with eating behaviors and lifestyles among Asian adolescents are scarce; furthermore, the limited number of studies available has been conducted in small non-representative samples in selected geographic areas [10,11].
The aims of this study were to estimate the prevalence rate of weight misperception and to examine the association of dieting methods and eating behaviors in relation to weight misperception among South Korean adolescents. In addition, we examined the association between weight misperception and DEB in Korean adolescents.

SUBJECTS AND METHODS

Study population and database: OnKAPS (Online Korean Adolescent Panel Survey)

This study used cross-sectional baseline data from the Online Korean Adolescent Panel Survey (OnKAPS). The OnKAPS aimed to estimate the number of adolescents at risk for developing eating disorders and to identify the risk factors associated with these disorders. The study was initiated in 2009 and follow-up surveys were conducted subsequently every 2 years. A nationwide South Korean adolescent panel was selected according to the distribution of this population across 16 regions, adolescent age groups, and genders reported in the 2005 Korean Population Census. An online survey method was used for this study since the internet usage rate for those aged 12-18 years is close to 100% in South Korea. Our Candidate panels were members of Embrain Research Company (Embrain Co. Ltd, Seoul, South Korea). Potential respondents were invited to take part in the survey, which they could access upon agreement to participate. Of the 16,090 Korean students who received an invitation email, 9,327 contacted the survey webpage. A total of 7,711 individuals completed all survey questions. The sample used for analysis included 6,943 students aged 12-18 years (3,476 boys and 3,467 girls). We excluded 768 students who 1) did not match the basic information such as age or region, or 2) answered with ''I don't know'' for our interesting variables in this study, or 3) recorded either too short or two long duration of the web-survey (less than 5 minutes, over than 50 minutes). The response rate was 48%.
The survey questionnaire consisted of the following three components: 1) socio-demographic and other general information; 2) weight perception and the Eating Attitudes Test (EAT-26) (developed and validated for South Korean adolescents) [18]; and 3) dieting methods, eating behaviors, and physical activity. Questions in the online survey were arranged by topic within each component to improve response rates and the quality of responses. The survey questionnaire was designed to be answered within 15 to 20 minutes. More detailed information on this study is provided in the previous publication [19].
This study was approved by the Korea Food and Drug Administration's Institutional Review Board, and all participants signed a written informed consent form before participating in the study. The online survey was conducted by the Embrain Online Research Company (Embrain Co. Ltd, Seoul, South Korea) between October and November, 2009.

Key measurements

Classification of overweight and obesity: Body mass index (BMI) was calculated by using self-reported weight and height data. We used the 2007 Korean National Growth Charts [20] to define weight status. The charts defined: a) underweight as BMI < 5th percentile, b) overweight as 85th percentile ≤ BMI < 95th percentile, c) obesity as BMI ≥ 95th percentile [20]. Due to the relatively small sample size, we combined all subjects with BMI ≥ 85th percentile while performing the analyses.
Classification of weight perception: Participants were asked about their own weight status with this question, "How do you describe your body weight?" Response choices were "very thin", "thin", "normal", "fat", and "very fat". Weight misperception was assessed based on the agreement between the reported BMIs and the perceived weights of the subjects: underestimation, consensus, or overestimation.
Dieting methods: Participants were asked if they had used any of the following methods to lose weight during the last 12 months: "fasting"; "diet pills (with prescription)"; "diet pills (without prescription)"; "laxative or diuretic use"; "self-induced vomiting after meals"; "one-food diet"; "herbal medicine use"; "functional foods"; "others". Response choices were "yes" or "no".
Dietary intake: Participants were asked how often they consumed the selected 9 food items, which are commonly consumed among South Korean adolescents, over the past 30 days (i.e., fast foods, regular sodas, fruits, milk, vegetables, and instant noodles). They were also asked about the frequencies of having breakfast and dinner with their family over the past 30 days. In addition, participants' eating out patterns over the past year were assessed. For the purposes of regression models, these eating behavior variables were dichotomized based on the distribution of responses (e.g.: eating out (≥ 2 times/week), having breakfast and dinner with family (≥ 1 time/day), having fast foods, regular sodas, and instant noodles (≥ 2 times/week), fruits (≥ 2 servings/day), milk (≥ 2 servings/day), and vegetables (≥ 3 servings/day)).
DEB: The Eating Attitudes Test-26 (EAT-26) has been widely used to identify individuals with eating disorders [18]. A score of 20 or above indicates that the subject needs to be further evaluated by a qualified professional to determine if he/she meets the diagnostic criteria for an eating disorder (scores can range from 0 to 78 points). We used the validated Korean version of the EAT-26 for our study sample [18]. Following the results from the pre-test, we modified one sentence by adding a synonym within the parenthesis to help participants understand the meaning of the following four responses; "Display self-control around food", "Give too much time and thought to food", "Like my stomach to be empty", "Enjoy trying new rich foods"; to each question. The same scoring method was used as the original version [18].
Physical activity: Participants were asked about their physical activity levels: regular exercise and screen time. Level of regular exercise was assessed by asking this question, "Did you do at least 30 minutes of exercise that was hard enough to make you sweat and to make breathing difficult at least ≥ 3 times per week?" The screen time was estimated based on the responses given to this question, "On an average, how many hours do you watch TV, play video games, or surf the internet?"
Socioeconomic Status (SES): SES was determined based on the responses given to this question, "What is your household's economic status?" Response choices were "highest", "high", "middle", "low", and "lowest". To test the reliability of the reported SES, we randomly selected 50 participants and asked their parents about their annual household income over the phone. We found a significant correlation (r = 0.64, P < 0.0001) between the reported SES and the annual income [19].
School type: Response choices to the question on school type was like following, "What type of school and class do you attend?", were "single-gender school", "single-gender class in co-educational school", or "co-educational class in co-educational school". We regrouped school type into "single education by sex" and "co-educational" during data analysis.

Statistical analyses

Differences in continuous variables were tested using t-tests and ANOVA, and in categorical data using χ2 tests. Logistic regressions were used to examine association of dieting methods and eating behaviors in relation to weight misperception by gender. The multivariate model was controlled for age, BMI, school type (single education by sex, co-educational), location of residence (urban, suburban, rural), and economic status (high, middle, low) in stratified gender analysis. Data management and data analysis were performed with SAS Version 9.2.

RESULTS

Weight perception and characteristics

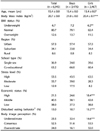
Based on self-reported weight and height information, 12.6% of the study sample was overweight (Table 1), 10.7% of male subjects and 15.2% of female subjects were at risk for developing eating disorders. Proportion of female subjects reporting their weight heavier was twice as high (32.0% compared with 16.1% for male subjects) whereas male subjects were more likely to underestimate their weight compared with female subjects.
Table 2 depicts the reported weight status, dieting methods and eating behaviors by weight perception. Weight misperception was prevalent, even among those with normal weight. In particular, 44.1% of boys underestimated their weight while around half of the girls overestimated their weight (P < 0.05). Girls were more likely to follow unhealthy dieting practices than boys. Fasting and one-food diet were the most common practices regardless of gender. Moreover, girls, who perceived themselves as obese, tried more of the unhealthy dieting methods while boys were only significantly represented in fasting (7.9%) and one-food diet (2.5%) methods.
The proportion of DEB in the overestimation group (those overestimating their weight) (boys 13.7%, girls 18.8%) was higher compared with other weight perception groups. The underestimation group (those underestimating their weight) exercised more regularly than the overestimation group (41.4% vs. 30.1% respectively, P < 0.0001). There was no significant difference in the frequency of exercise across weight perception in girls. However, lower frequency of having breakfast and higher consumption of regular sodas were observed in the weight misperception groups than the consensus group.

Weight perception and dieting methods

Our logistic analysis showed that weight misperception was significantly associated with dieting methods (Table 3). Among boys, the underestimation group was less likely to fast [Odds ratio (OR) = 0.65 (0.40-1.08)] when compared with the consensus group where the overestimation group was more likely to fast [OR = 1.85 (1.26-2.72)]. In particular, weight overestimating girls were more likely to try various unhealthy dieting methods. The OR and 95% CI were 1.69 (1.37-2.10) for fasting, 1.88 (1.12-3.15) for laxative or diuretic use, 2.05 (1.29-3.27) for self-induced vomiting after meals, 1.55 (1.21-1.98) for one-food diet, and 1.77 (1.11-2.72) for functional foods, respectively.

Weight perception and eating behaviors

We also assessed the association between weight misperception and eating behaviors (Table 4). After controlling for covariates, weight overestimating boys had an increased OR for reporting the risks for DEB [OR = 1.35 (1.01-1.81)] than the consensus group, whereas we could not find any significant association between weight underestimation and eating behavior factors. Our results revealed relatively strong associations among girls, particularly with regards to weight overestimation. Girls who perceived their weight incorrectly were less likely to have breakfast every day. In addition, girls who overestimated their weight had an increased OR for consuming fast foods [OR = 1.28 (1.02-1.60)] and regular sodas [OR = 1.39 (1.09-1.77)]. Weight overestimating girls also had a higher risk of DEB [OR = 1.41 (1.15-1.74)] compared with the consensus group.

DISCUSSION

Based on our findings, approximately half of South Korean adolescents had distorted weight perceptions. Girls were more likely to overestimate their weight while boys were more likely to underestimate their weight. Overestimation groups tended to try more unhealthy dieting practices, such as use of laxative or diuretics, fasting, one-food diet, and functional foods; this was more prevalent among girls. Girls who reported their weight to be overestimation had higher intakes of regular sodas and fast foods, and skipped breakfast more often. The risk for developing an eating disorder was high for overestimation groups regardless of gender. Our results revealed relatively strong associations between weight misperception and eating behaviors among girls as well.
Martin et al. [7] studied a nationally representative sample of US adolescents and reported that 18.0% of the sample underestimated, while 11.5% overestimated their weight. A previous Korean study conducted among 8th (14 years of age) and 11th (17 years of age) grade students reported a high prevalence of weight overestimation in girls and a high prevalence of weight underestimation in boys (12% of boys vs. 24% of girls overestimated their weight, while 28% of boys vs. 10% of girls underestimated their weight). The results of this study, in regards to the relationship between gender difference and weight misperception [16], are consistent with our results. Similar results were reported from a Dutch study that revealed 37.6% weight overestimation and 11.2% weight underestimation among girls [21]. Our results confirm the findings from similar studies in other countries-China, Japan, Australia-that while weight overestimation seems to be more prevalent among girls, boys are more likely to underestimate their weight [5,11,22]. On the other hand, weight misperception rates for our study differed from those of previous studies. The discrepancy might have been due to age [17], gender [7], ethnicity [7], and environmental disparities, e.g.: parents' awareness of their children being overweight [9], peer weight norms [4], and public sentiments regarding ideal body size [6]. For example, the incidence of weight overestimation was higher among female Asian adolescents [7,11,16,17], whereas Asian-American girls were more likely to underestimate their weights when compared with Caucasian female adolescents in the U.S.. [7].
Normal-weight adolescents in the U.S., especially females, who perceived themselves as overweight, were three times more likely to have unhealthy weight control behaviors [23]. Furthermore, lower body satisfaction predicted higher levels of dieting and unhealthy weight control behaviors [24]. In South Korea, a recent study confirmed this relationship between weight status and dieting among adolescents [16]. Moreover, this study looked at the correlation between unhealthy weight control behaviors and suicidal ideation [25]. To make things worse, nowadays, beauty ideals among adolescents have shifted towards severe thinness [26]. Therefore, South Korean female adolescents need appropriate education on healthy weight management for growth and development while addressing long-term problems due to unhealthy dieting methods.
Only a few studies have examined the association among weight misperception, dieting methods and eating behaviors. Despite the limitations in making comparisons to our results, it appears that among Chinese adolescents, weight overestimating females were likely to consume more fruits or snacks and drink less milk [11]. Moreover, another Chinese study on weight overestimating adolescents linked weight overestimation to unhealthy weight-related behaviors [27]. Weight underestimating African-American female adolescents also had unhealthy dietary practices, such as consuming less than the recommended number of servings of fruits and dairy per day. However, weight overestimating male adolescents were less likely to consume snacks [28]. We also found that weight misperceiving girls seemed to skip breakfast frequently and that weight overestimating girls consumed fast foods and regular sodas more frequently. Results obtained from our study indicated that these weight overestimating girls tried to lose weight by using unhealthy dieting methods; however, they did not try to correct their eating habits to achieve optimal health and weight control.
In a previous study based on a nationally representative sample in the U.S., both boys and girls who accurately perceived their weight reported some healthy weight-related behaviors, such as higher consumption of fruits and vegetables, than those who misperceived their weight [15]. As we have concluded from this study [15], accurate weight perception in adolescents affects correct self-assessment of dietary habits, which means that it may positively help with their growth and development. Therefore, South Korean clinicians or government agencies related to adolescent health issues should consider developing and implementing educational programs while getting parents, peers and school teachers involved in correcting adolescents' misperception of their own weight status.
To our best knowledge, no study has examined the association between weight misperception and DEB in a nationwide sample in South Korea. In terms of DEB as defined by the EAT-26 score, the prevalence of DEB among participants in our study differed by weight perception status. A previous study showed that 10.8% of high school girls in Hong Kong scored above the diagnostic level on the EAT-26 [3]. A more recent study [29] reported that 5.1% of Japanese female students with a mean age of 19.6 years was above the diagnostic level on the EAT-26. Our results revealed a higher percentage than these two studies. However, most studies did not account for factors such as DEB prevalence in relation to weight misperception. To decrease the risks of DEB, correction of weight misperceptions is urgently needed.
Our study has several strengths. The study population came from a nationwide sample of South Korean adolescents. Detailed information on the participants' weight control methods, eating attitudes and eating behaviors was collected. In addition, this study was the first attempt to try to find an association between weight misperception and eating behaviors by using a nationwide sample of South Korean adolescents. However, our study also has several limitations. First, because weight and height of participants were self-reported, reporting bias and measurement errors were two of the considerations, although the reported mean BMI and the prevalence of obesity in our study were similar to those reported by the Korea National Health and Nutrition Examination Survey [30]. Second, our cross-sectional study design was not optimal for the investigation of the direction of causal inferences.
In conclusion, half of South Korean adolescents had misperceptions about their weight. Some of them were trying to lose weight by using unhealthy dieting methods. Weight overestimation was associated with a higher risk for DEB for both genders. Moreover, there were strong associations between weight overestimation, unhealthy dieting methods and eating behaviors, particularly among female adolescents. As we had expected, in this nationwide study, adolescents who perceived themselves as overweight tended to try to lose weight by using unhealthy dieting methods and consumed foods highly associated with inducing obesity. Clinical and public programs should focus on teaching adolescents how to choose foods and desirable dietary habits in order to lose weight, when medically deemed appropriate, as well as preventing or correcting weight misperceptions.

Figures and Tables

Table 1
Socio-demographic characteristics of South Korean adolescents by gender
nrp-8-213-i001

1)Definition is based on the Eating Attitudes Test (EAT-26). Individuals with a high EAT-26 score (≥ 20 points) should be interviewed by a qualified professional to determine if they meet the diagnostic criteria for an eating disorder (scores can range from 0 to 78).

*P < 0.05, **P < 0.01, and ***P < 0.001, difference by gender using Student t-test.

Table 2
Differences in reported body weight status, dieting methods, and lifestyles among South Korean adolescents by weight perception
nrp-8-213-i002

*P < 0.05, **P < 0.01, and ***P < 0.001, difference by gender and weight perception by using Chi-square test.

Letters with different superscripts in the same row indicate statistical significance at P < 0.05 by using Tukey's multiple range test.

1)Body weight status: a) underweight, BMI < 5th percentile; b) normal, 5th percentile ≤ BMI < 85th percentile; c) overweight, 85th percentile ≥ BMI

2)Adjusted for age, body mass index, school type, location of residence, and economic status.

3)Frequency of eating out over the past year

4)Frequency of consumption over the past 30 days

5)Definition is based on the Eating Attitudes Test (EAT-26). Individuals with a high EAT-26 score (≥ 20 points) should be interviewed by a qualified professional to determine if they meet the diagnostic criteria for an eating disorder (scores can range from 0 to 78).

6)Three or more times/week, ≥ 30 min/occasion

7)Adjusted for age, body mass index, school type, location of residence, and economic status.

Table 3
Associations (OR and 95% CI) between weight misperception and dieting methods among South Korean adolescents1),2)
nrp-8-213-i003

1)These were based on multinomial logistic regression analyses. All models were controlled for age, body mass index, school type, location of residence, and economic status.

2)The models compared with subjects who did not attempt any of the listed dieting methods.

*P < 0.05, **P < 0.01, and ***P < 0.001.

Table 4
Associations (OR and 95% CI) between weight misperception and eating behaviors among South Korean adolescents1),2)
nrp-8-213-i004

1)These were based on multinomial logistic regression analyses. All models were controlled for age, body mass index, school type, location of residence, and economic status.

2)Modeling the probability for each category of outcome variables: eating out (≥ 2 times/week), having breakfast and having dinner with family (≥ 1/day), fast food, regular soda, and instant noodles (≥ 2/week), fruit (≥ 2/day), milk (≥ 2 times/day), vegetable (≥ 3/day), and presence of disturbed eating behavior (EAT-26 score ≥ 20 points).

*P < 0.05, **P < 0.01, and ***P < 0.001.

ACKNOWLEDGEMENTS

This research was supported by a grant (09082KFDA904) received in 2009 from the Korean Food and Drug Administration.

Notes

This research was supported by a grant (09082KFDA904) received in 2009 from the Korean Food and Drug Administration.

References

1. Wang Y, Lobstein T. Worldwide trends in childhood overweight and obesity. Int J Pediatr Obes. 2006; 1:11–25.
crossref
2. Chisuwa N, O'Dea JA. Body image and eating disorders amongst Japanese adolescents. A review of the literature. Appetite. 2010; 54:5–15.
crossref
3. Lee S, Lee AM. Disordered eating in three communities of China: a comparative study of female high school students in hong kong, Shenzhen, and rural hunan. Int J Eat Disord. 2000; 27:317–327.
crossref
4. Perkins JM, Perkins HW, Craig DW. Peer weight norm misperception as a risk factor for being over and underweight among UK secondary school students. Eur J Clin Nutr. 2010; 64:965–971.
crossref
5. Abbott RA, Lee AJ, Stubbs CO, Davies PS. Accuracy of weight status perception in contemporary Australian children and adolescents. J Paediatr Child Health. 2010; 46:343–348.
crossref
6. Bergstrom R, Neighbors C. Body Image Disturbance and The Social Norms Approach: An Integrative Review of the Literature. J Soc Clin Psychol. 2006; 25:975–1000.
crossref
7. Martin MA, Frisco ML, May AL. Gender and race/ethnic differences in inaccurate weight perceptions among U.S. adolescents. Womens Health Issues. 2009; 19:292–299.
crossref
8. Nolan L, Grigorenko A, Thorstensson A. Balance control: sex and age differences in 9- to 16-year-olds. Dev Med Child Neurol. 2005; 47:449–454.
crossref
9. Rudolph H, Bluher S, Falkenberg C, Neef M, Korner A, Wurz J, Kiess W, Brahler E. Perception of body weight status: a case control study of obese and lean children and adolescents and their parents. Obes Facts. 2010; 3:83–91.
crossref
10. Wang Y, Liang H, Chen X. Measured body mass index, body weight perception, dissatisfaction and control practices in urban, low-income African American adolescents. BMC Public Health. 2009; 9:183.
crossref
11. Xie B, Chou CP, Spruijt-Metz D, Reynolds K, Clark F, Palmer PH, Gallaher P, Sun P, Guo Q, Johnson CA. Weight perception and weight-related sociocultural and behavioral factors in Chinese adolescents. Prev Med. 2006; 42:229–234.
crossref
12. Strauss RS. Self-reported weight status and dieting in a cross-sectional sample of young adolescents: National Health and Nutrition Examination Survey III. Arch Pediatr Adolesc Med. 1999; 153:741–747.
crossref
13. Cooke R, Sawyer SM. Eating disorders in adolescence. An approach to diagnosis and management. Aust Fam Physician. 2004; 33:27–31.
14. Wardle J, Haase AM, Steptoe A. Body image and weight control in young adults: international comparisons in university students from 22 countries. Int J Obes (Lond). 2006; 30:644–651.
crossref
15. Edwards NM, Pettingell S, Borowsky IW. Where perception meets reality: self-perception of weight in overweight adolescents. Pediatrics. 2010; 125:e452–e458.
crossref
16. Lee G, Ha Y, Vann JJ, Choi E. Weight perception and dieting behavior among Korean adolescents. J Sch Nurs. 2009; 25:427–435.
crossref
17. Kaneko K, Kiriike N, Ikenaga K, Miyawaki D, Yamagami S. Weight and shape concerns and dieting behaviours among pre-adolescents and adolescents in Japan. Psychiatry Clin Neurosci. 1999; 53:365–371.
crossref
18. Choi JH, Ahn DH, Nam JH, Jo YK, Choi BY. Reliability and validity of Eating Attitude Test-26 for Korean adolescents. Korean J Child Adol Psychiatry. 1998; 9:91–97.
19. Lee HJ, Park S, Kim CI, Choi DW, Lee JS, Oh SM, Cho E, Park HK, Kwon KI, Oh SW. The association between disturbed eating behavior and socioeconomic status: the Online Korean Adolescent Panel Survey (OnKAPS). PLoS One. 2013; 8:e57880.
crossref
20. Moon JS, Lee SY, Nam CM, Choi JM, Choe BK, Seo JW, Oh K, Jang MJ, Hwang SS, Yoo MH, Kim YT, Lee CG. 2007 Korean National Growth Charts: review of developmental process and an outlook. Korean J Pediatr. 2008; 51:1–25.
crossref
21. ter Bogt TF, van Dorsselaer SA, Monshouwer K, Verdurmen JE, Engels RC, Vollebergh WA. Body mass index and body weight perception as risk factors for internalizing and externalizing problem behavior among adolescents. J Adolesc Health. 2006; 39:27–34.
crossref
22. Suka M, Sugimori H, Yoshida K, Kanayama H, Sekine M, Yamagami T, Kagamimori S. Body image, body satisfaction and dieting behavior in Japanese preadolescents: The Toyama birth cohort study. Environ Health Prev Med. 2006; 11:24–30.
crossref
23. Talamayan KS, Springer AE, Kelder SH, Gorospe EC, Joye KA. Prevalence of overweight misperception and weight control behaviors among normal weight adolescents in the United States. ScientificWorldJournal. 2006; 6:365–373.
crossref
24. Neumark-Sztainer D, Paxton SJ, Hannan PJ, Haines J, Story M. Does body satisfaction matter? Five-year longitudinal associations between body satisfaction and health behaviors in adolescent females and males. J Adolesc Health. 2006; 39:244–251.
crossref
25. Kim DS, Cho Y, Cho SI, Lim IS. Body weight perception, unhealthy weight control behaviors, and suicidal ideation among Korean adolescents. J Sch Health. 2009; 79:585–592.
crossref
26. Wiseman CV, Sunday SR, Becker AE. Impact of the media on adolescent body image. Child Adolesc Psychiatr Clin N Am. 2005; 14:453–471. viii–ix.
crossref
27. Shi Z, Lien N, Nirmal Kumar B, Holmboe-Ottesen G. Perceptions of weight and associated factors of adolescents in Jiangsu Province, China. Public Health Nutr. 2007; 10:298–305.
crossref
28. Chen X, Wang Y. Is ideal body image related to obesity and lifestyle behaviours in African American adolescents? Child Care Health Dev. 2011.
crossref
29. Makino M, Hashizume M, Yasushi M, Tsuboi K, Dennerstein L. Factors associated with abnormal eating attitudes among female college students in Japan. Arch Womens Ment Health. 2006; 9:203–208.
crossref
30. KCDC. The Fourth Korea National Health and Nutrition Examination Survey (KNHANES IV), 2007-2009. Korean Centers for Disease Control and Prevention;2010.
TOOLS
Similar articles